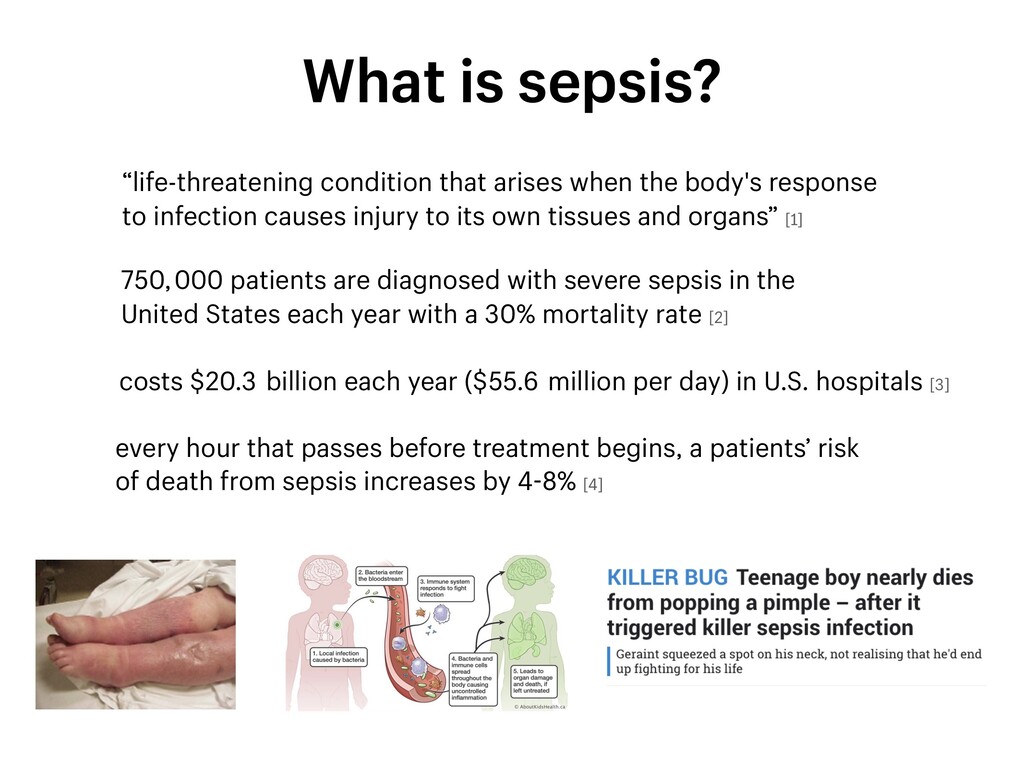
causes injury to its own tissues and organs” [1] 750, 000 patients are diagnosed with severe sepsis in the United States each year with a 30% mortality rate [2] costs $20.3 billion each year ($55.6 million per day) in U.S. hospitals [3] every hour that passes before treatment begins, a patients’ risk of death from sepsis increases by 4-8% [4] What is sepsis?
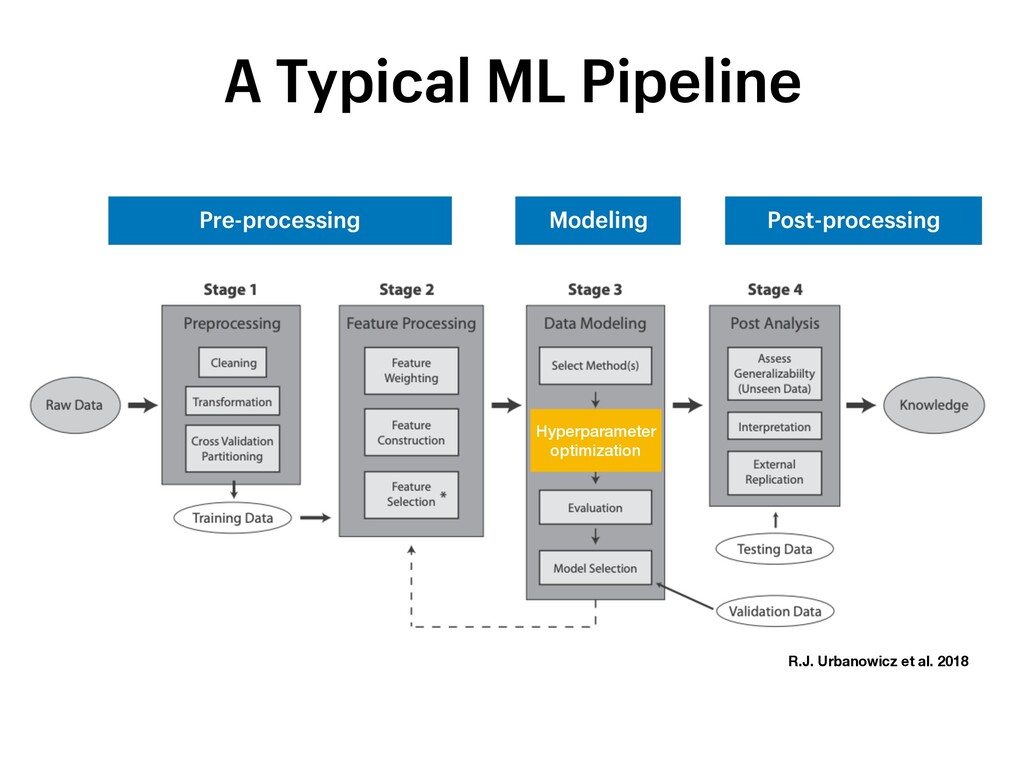
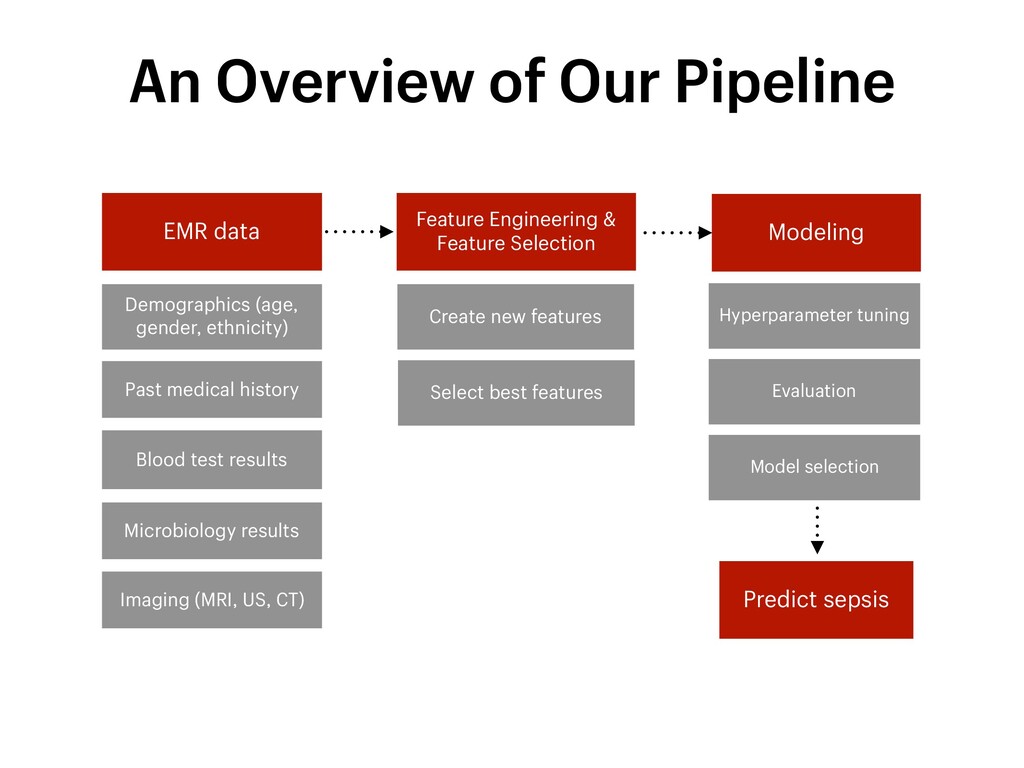
Imaging (MRI, US, CT) Predict sepsis Demographics (age, gender, ethnicity) Modeling Feature Engineering & Feature Selection Model selection Hyperparameter tuning Create new features Evaluation Select best features An Overview of Our Pipeline
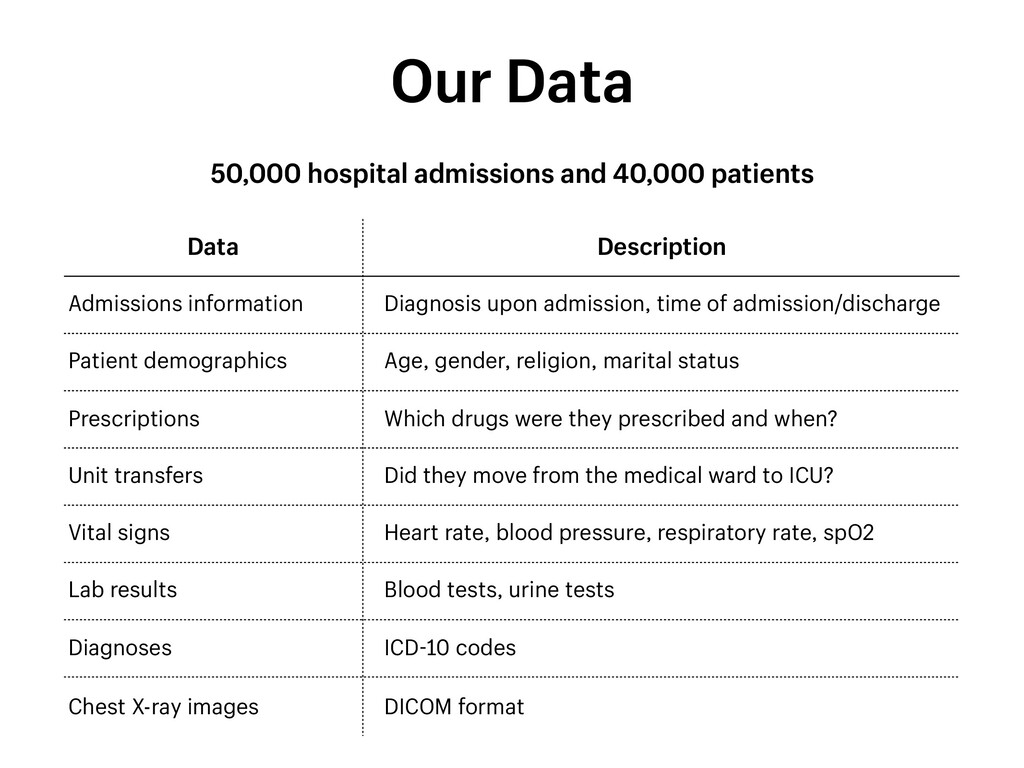
Patient demographics Age, gender, religion, marital status Prescriptions Which drugs were they prescribed and when? Unit transfers Did they move from the medical ward to ICU? Vital signs Heart rate, blood pressure, respiratory rate, spO2 Lab results Blood tests, urine tests Diagnoses ICD-10 codes Chest X-ray images DICOM format 50,000 hospital admissions and 40,000 patients Our Data
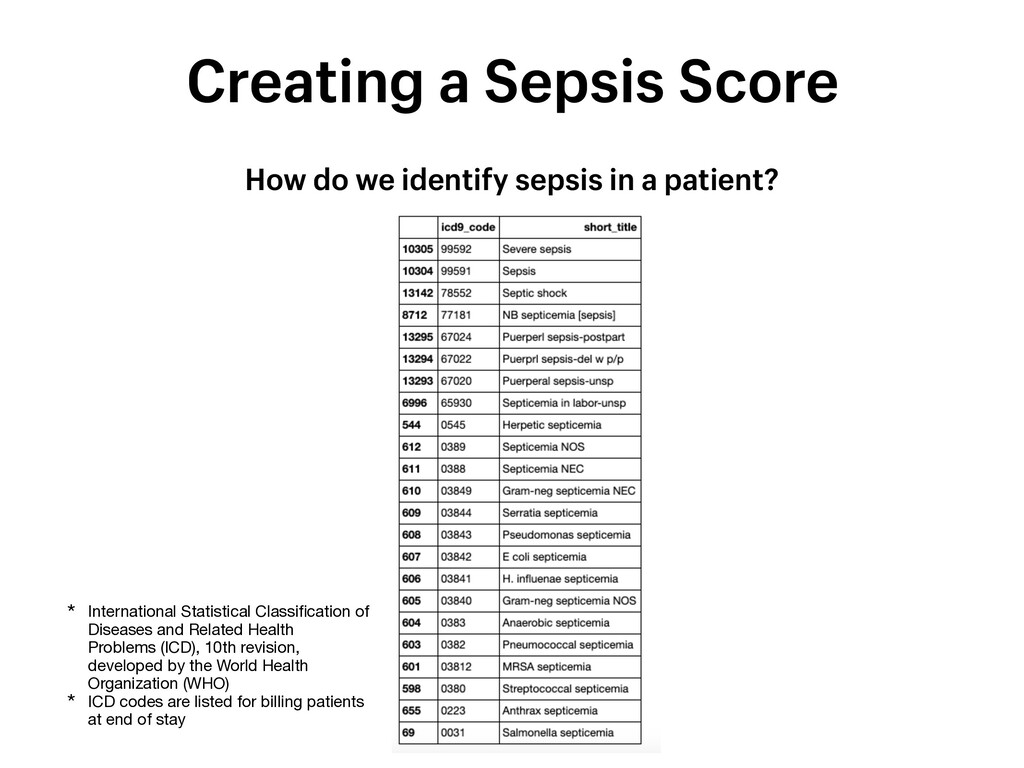
Statistical Classification of Diseases and Related Health Problems (ICD), 10th revision, developed by the World Health Organization (WHO) * ICD codes are listed for billing patients at end of stay Creating a Sepsis Score
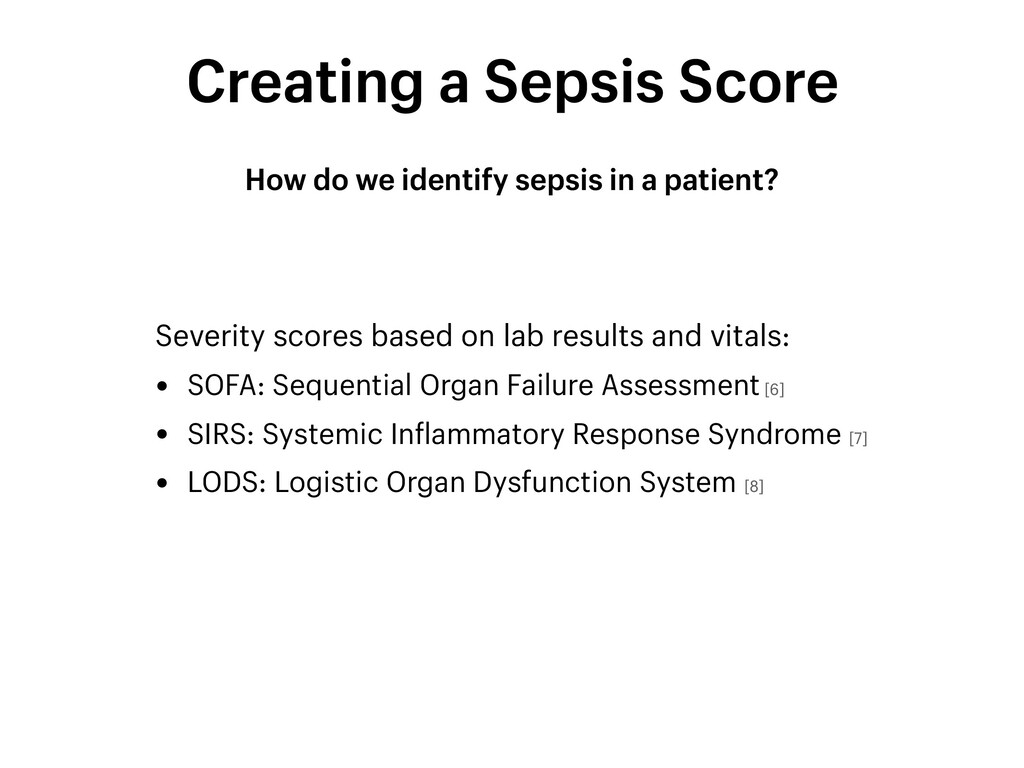
based on lab results and vitals: • SOFA: Sequential Organ Failure Assessment [6] • SIRS: Systemic Inflammatory Response Syndrome [7] • LODS: Logistic Organ Dysfunction System [8] Creating a Sepsis Score
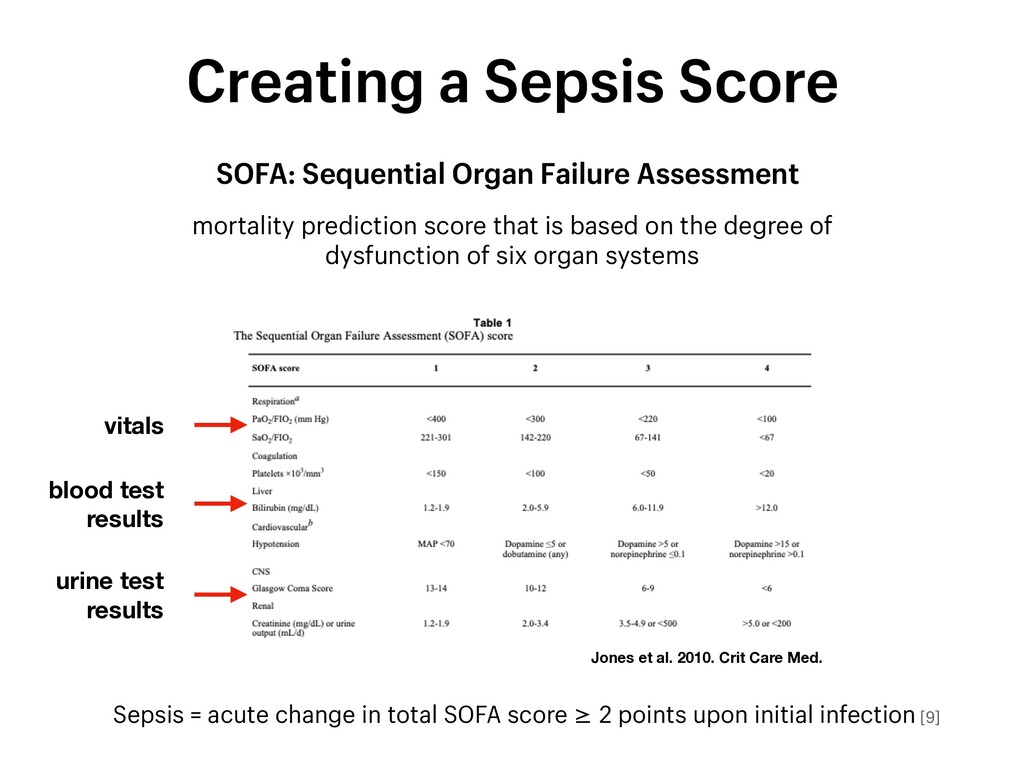
based on the degree of dysfunction of six organ systems Jones et al. 2010. Crit Care Med. vitals blood test results urine test results Sepsis = acute change in total SOFA score ≥ 2 points upon initial infection [9] Creating a Sepsis Score
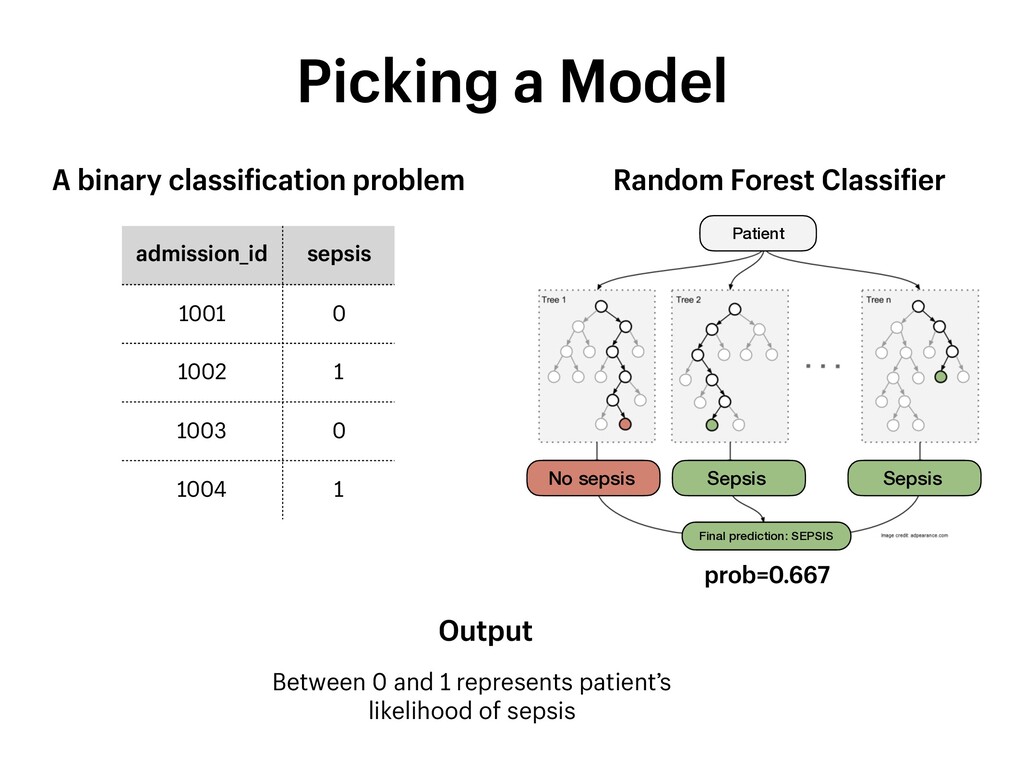
0 1004 1 A binary classification problem Output Between 0 and 1 represents patient’s likelihood of sepsis A forest of decision trees Patient Sepsis Sepsis No sepsis Final prediction: SEPSIS prob=0.667 Picking a Model
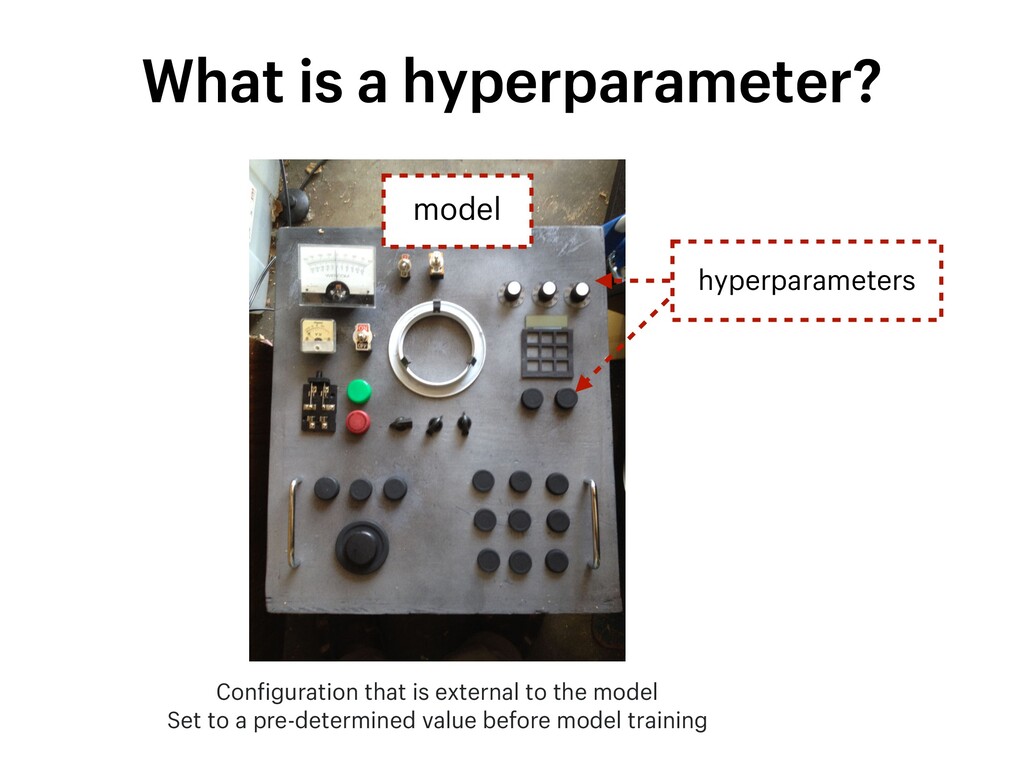
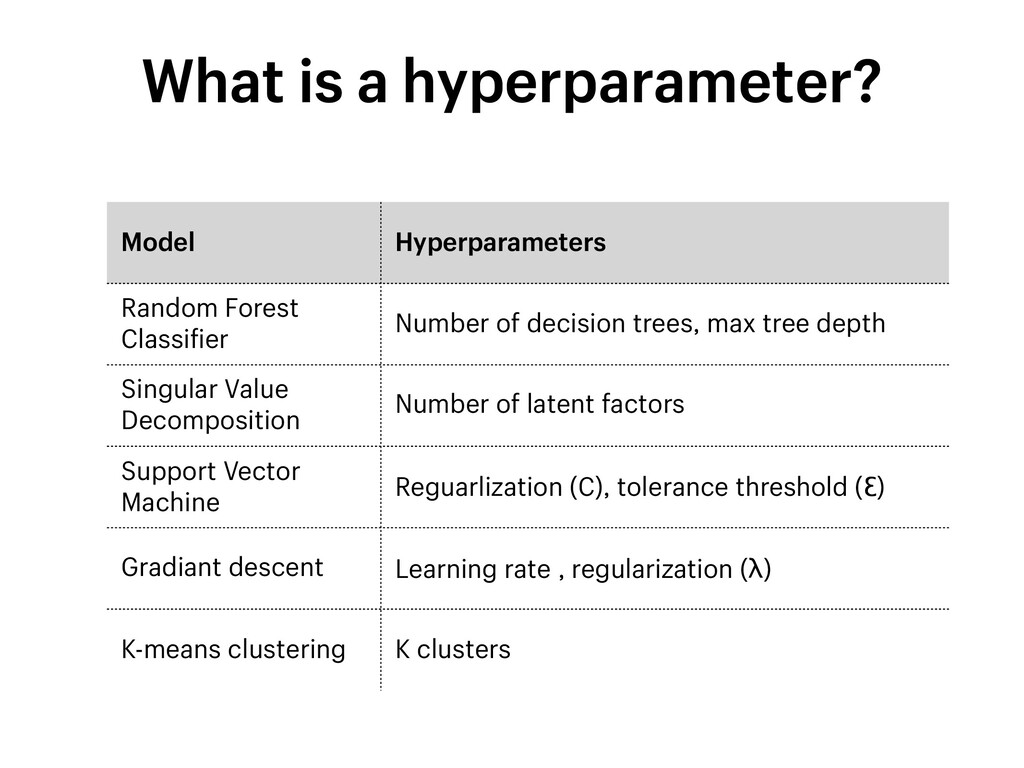
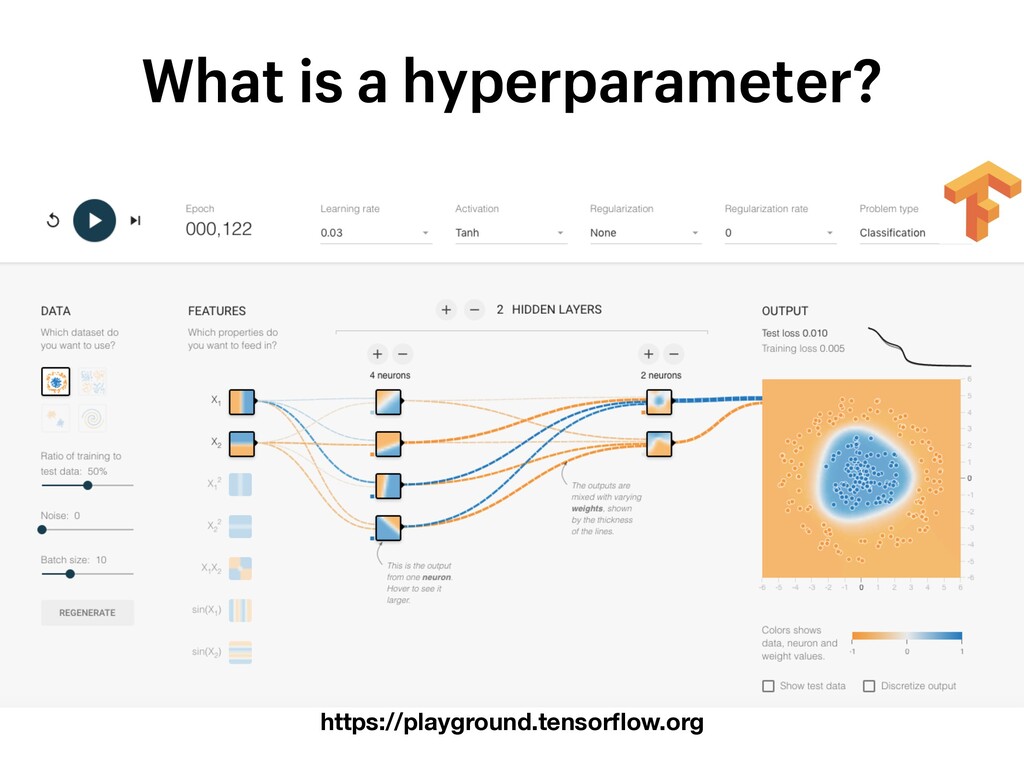
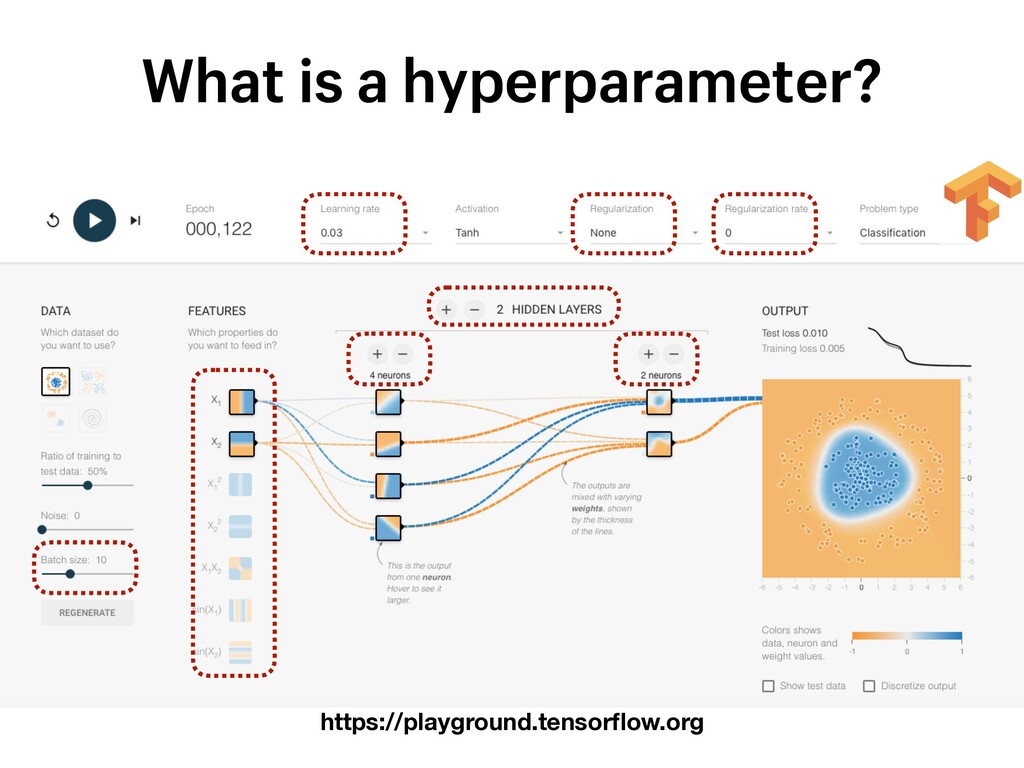
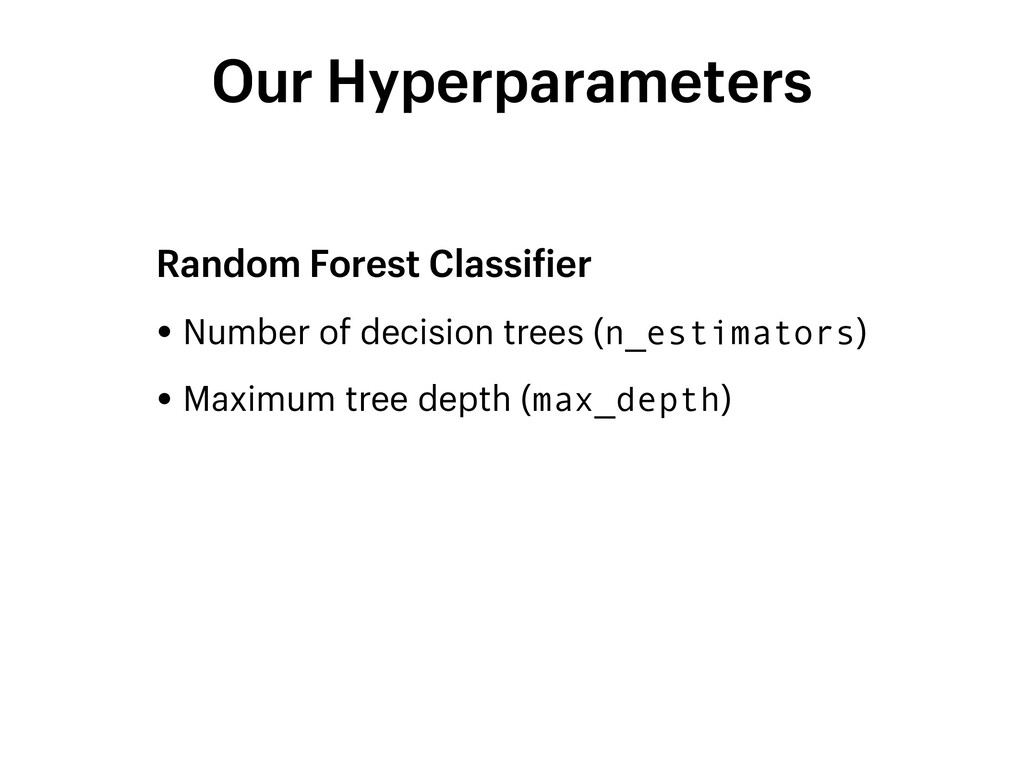
of decision trees, max tree depth Singular Value Decomposition Number of latent factors Support Vector Machine Reguarlization (C), tolerance threshold (Ɛ) Gradiant descent Learning rate , regularization (λ) K-means clustering K clusters
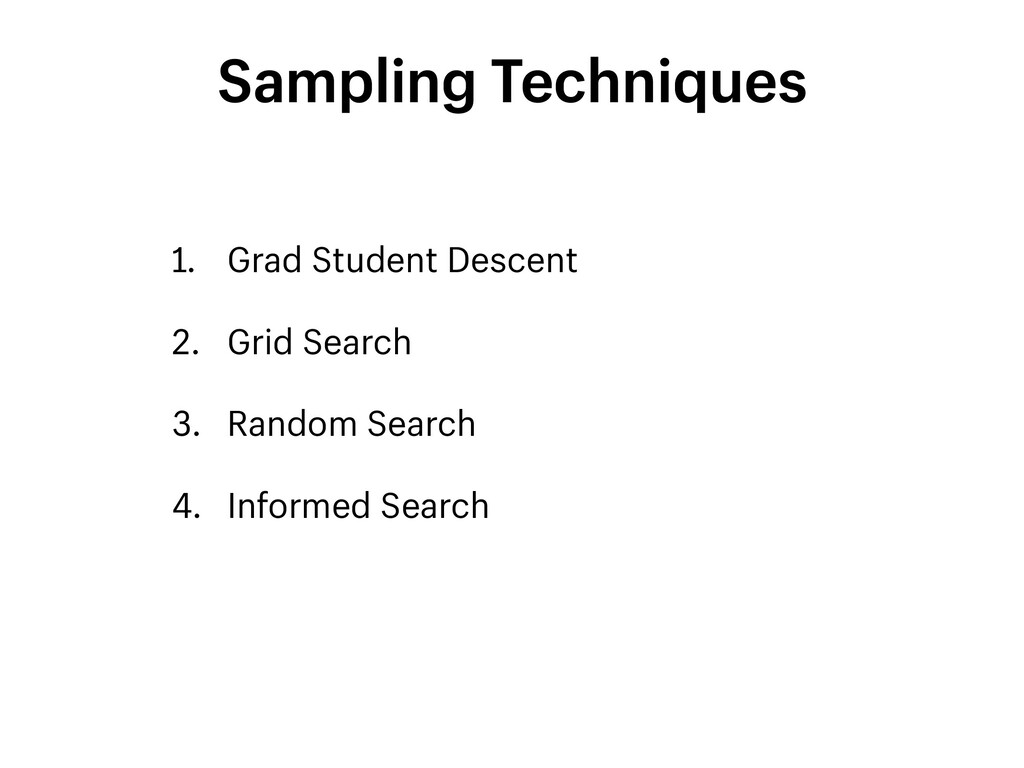
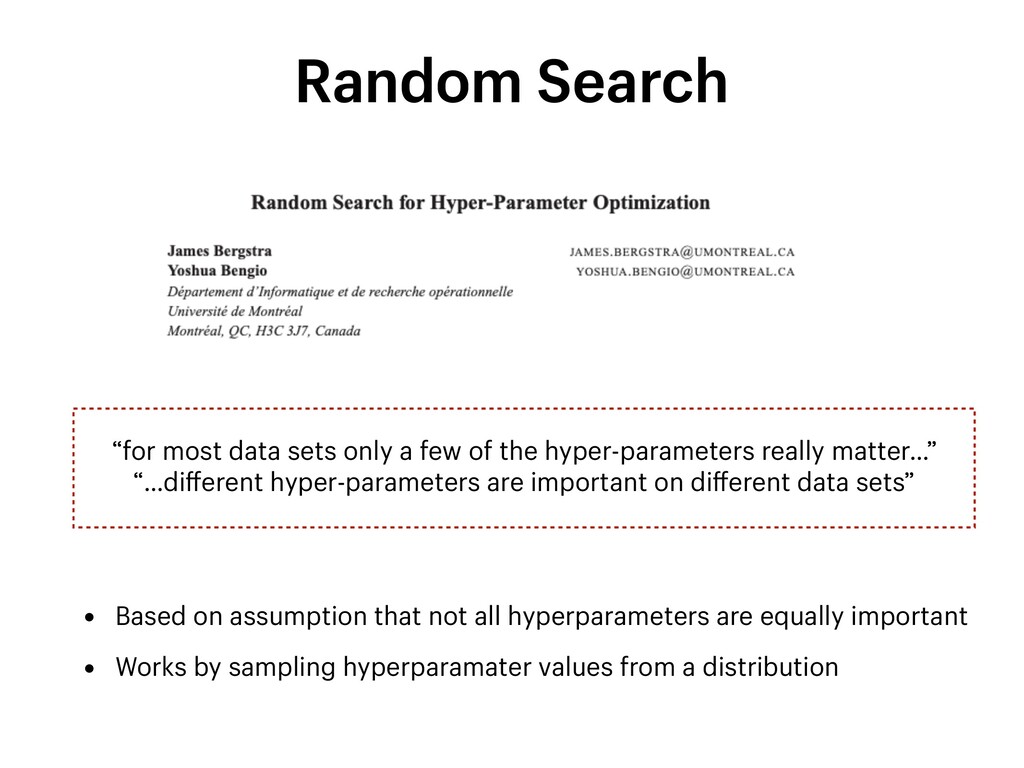
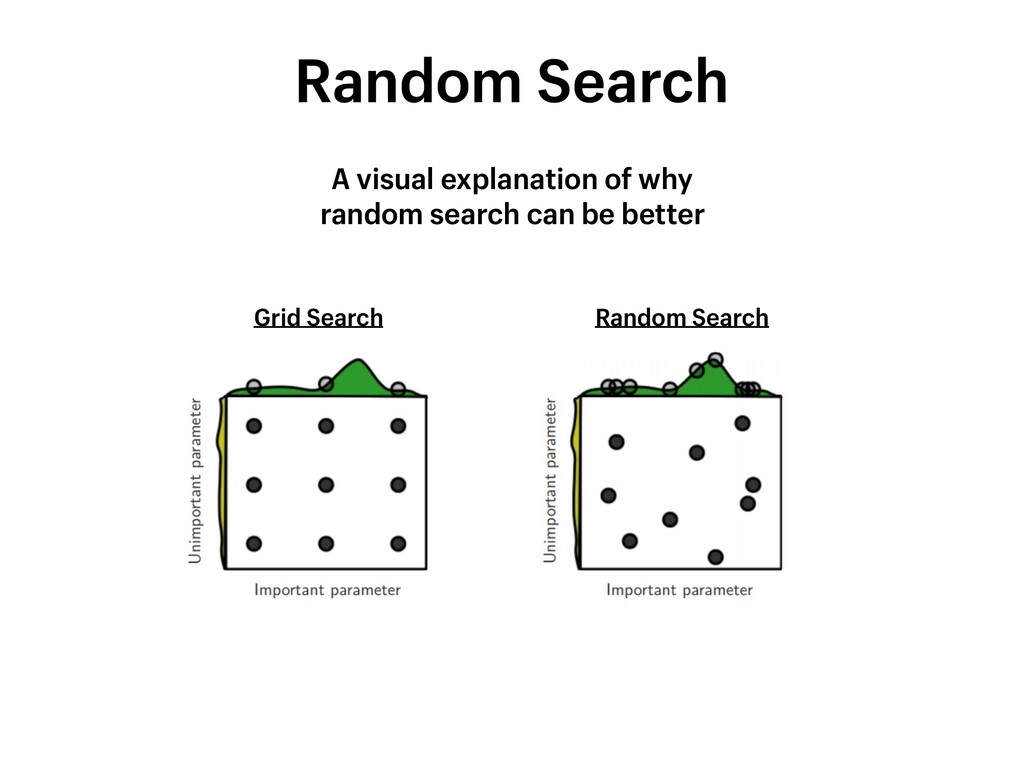
really matter…” “…different hyper-parameters are important on different data sets” • Based on assumption that not all hyperparameters are equally important • Works by sampling hyperparamater values from a distribution Random Search
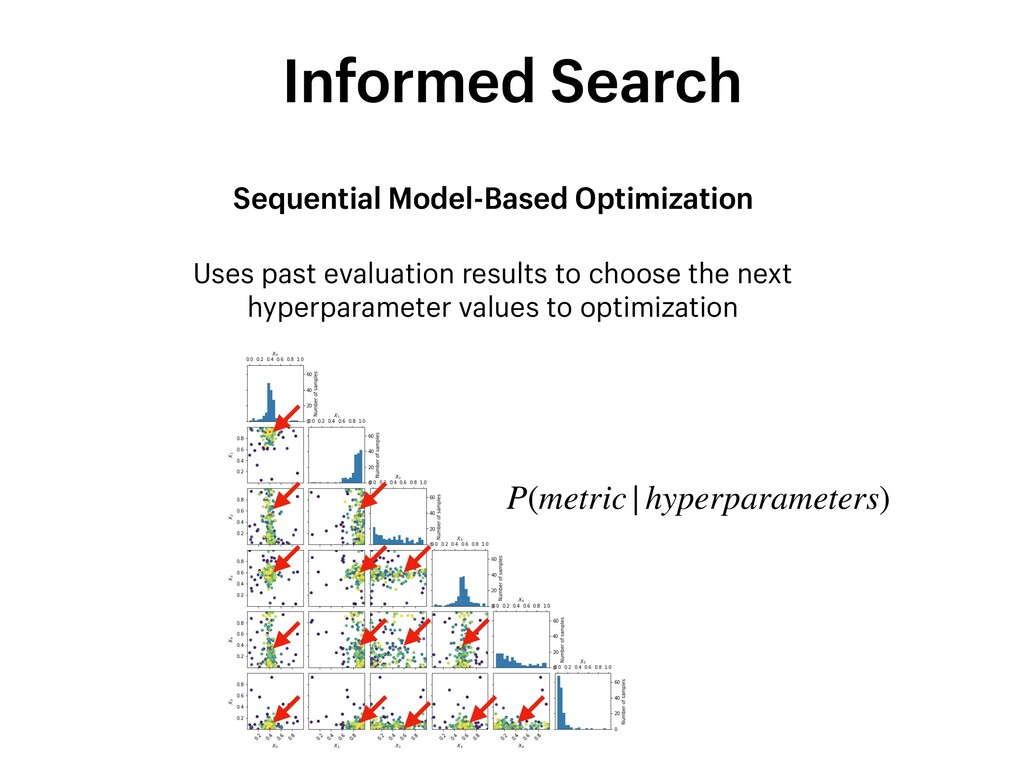
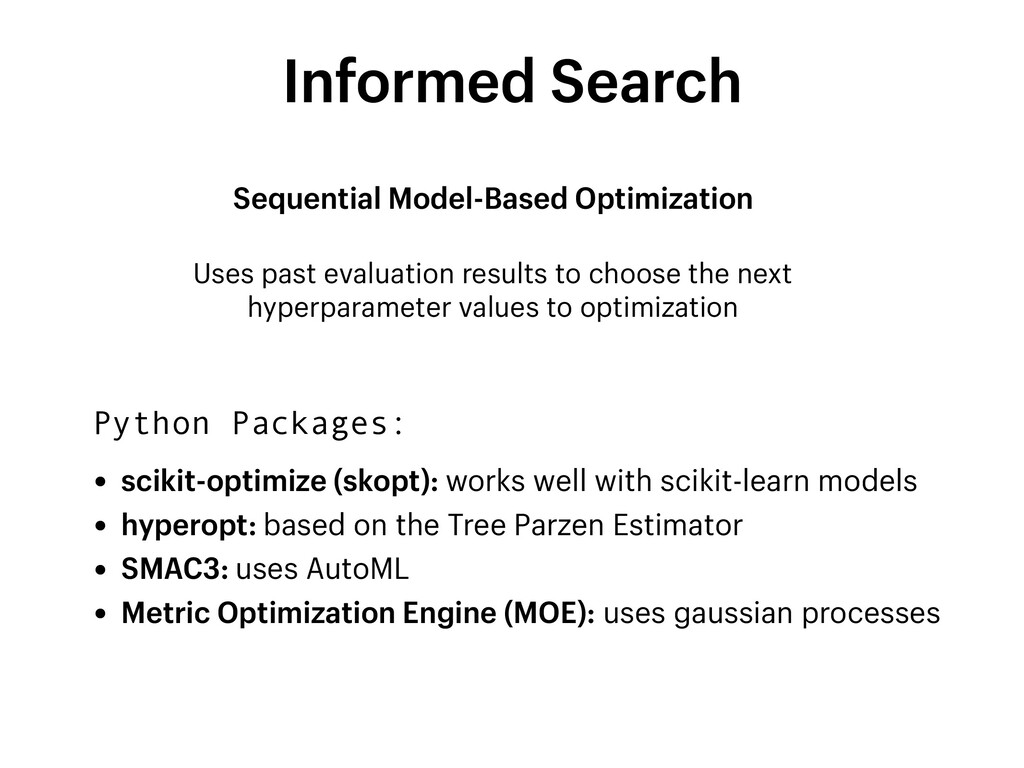
based on the Tree Parzen Estimator • SMAC3: uses AutoML • Metric Optimization Engine (MOE): uses gaussian processes Sequential Model-Based Optimization Informed Search Uses past evaluation results to choose the next hyperparameter values to optimization Python Packages:
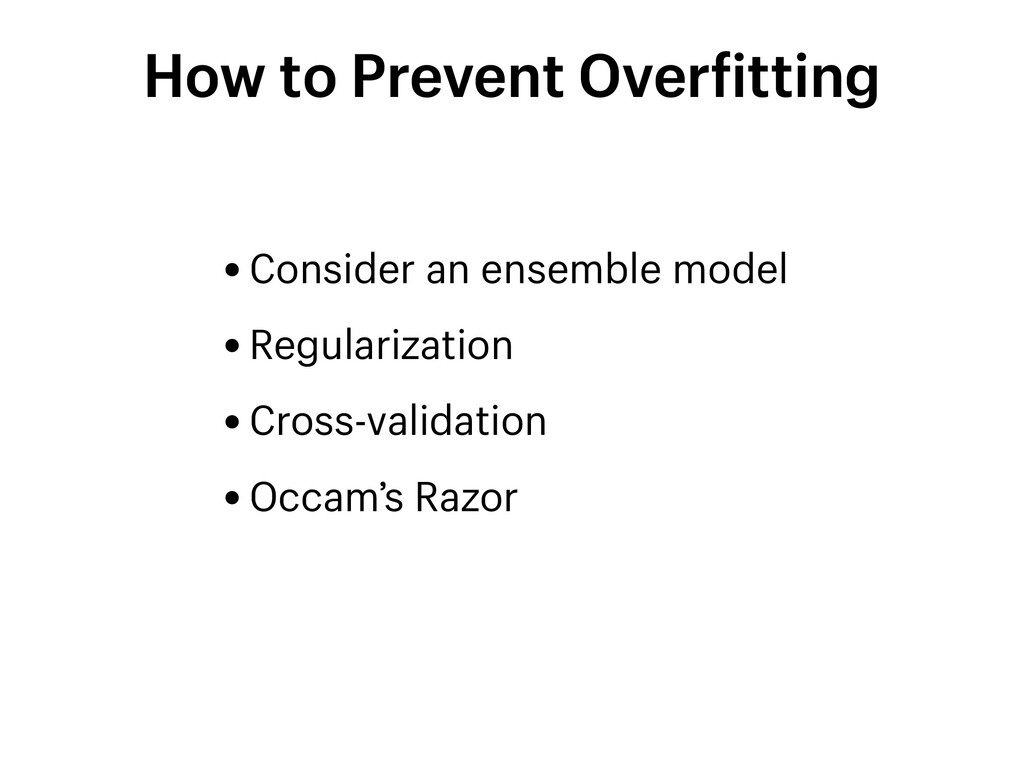
tightly bound to training set How to Detect It High performance on training set Poor performance on test set Overfitting When it’s too good to be true…
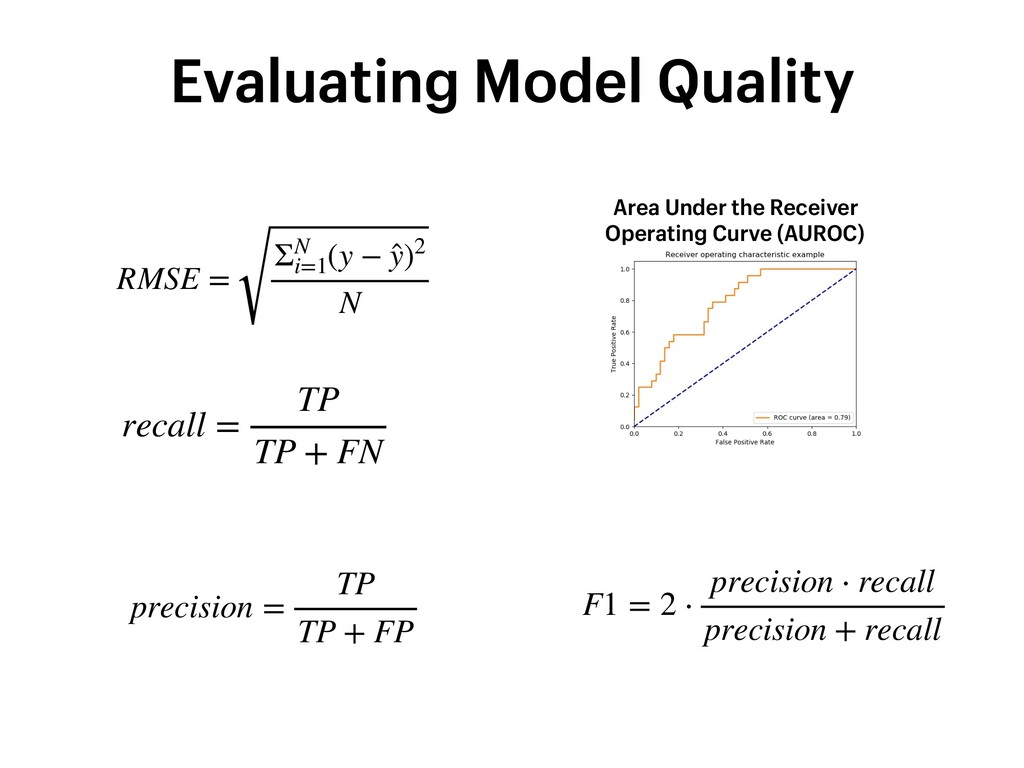
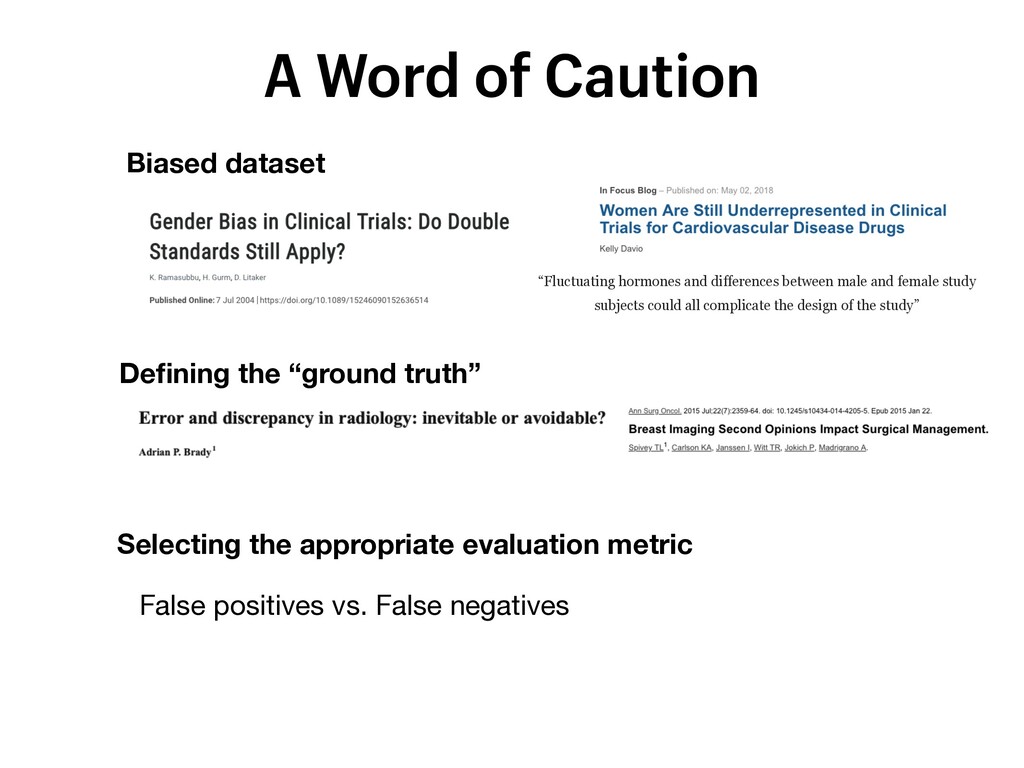
study subjects could all complicate the design of the study” Defining the “ground truth” Selecting the appropriate evaluation metric False positives vs. False negatives A Word of Caution
decades of mortality trends among patients with severe sepsis: a comparative meta-analysis. Crit Care Med 2014;42:625. 3) Cost H et al. In Healthcare Cost and Utilization Project (HCUP) Statistical Briefs: MDAgency for Healthcare Research and Quality USA, 2006. 4) Angus DC et al. Epidemiology of severe sepsis in the United States: analysis of incidence, outcome, and associated costs of care. Criti Care Med. 2001;1303-10. 5) Martin GS et al. The Epidemiology of Sepsis in the United States from 1979 through 2000. N Engl J Med 2003; 348:1546-1554. References


 topspinj
 snoozer05
 kentapapa
 occhi
occhi
 gogutan
 sh_fk2
 joere
joere
 ama_ch
 akizhou
 prog893
 jtakeda
 fufufukakaka
 k1style
 sonatard
 lara
lara
 reverentgeek
 marketingsoph
 ks91
ks91
 madoxten
 sabderemane
 cassininazir
 frankvandijk
 kristinabergwall1
 tanoku

![Search Space skelarn.ensemble.RandomForestClassifier() • n_estimators = [5,10,50] • max_depth =](https://files.speakerdeck.com/presentations/e55b23af97fd4f0a99f38b0df79b3f3d/slide_29.jpg)

![Jill Cates twitter: @JillACates github: @topspinj [email protected] Free Lunch Thank](https://files.speakerdeck.com/presentations/e55b23af97fd4f0a99f38b0df79b3f3d/slide_40.jpg)