Upgrade to Pro — share decks privately, control downloads, hide ads and more …

Breaking the black-box

Breaking the black-box

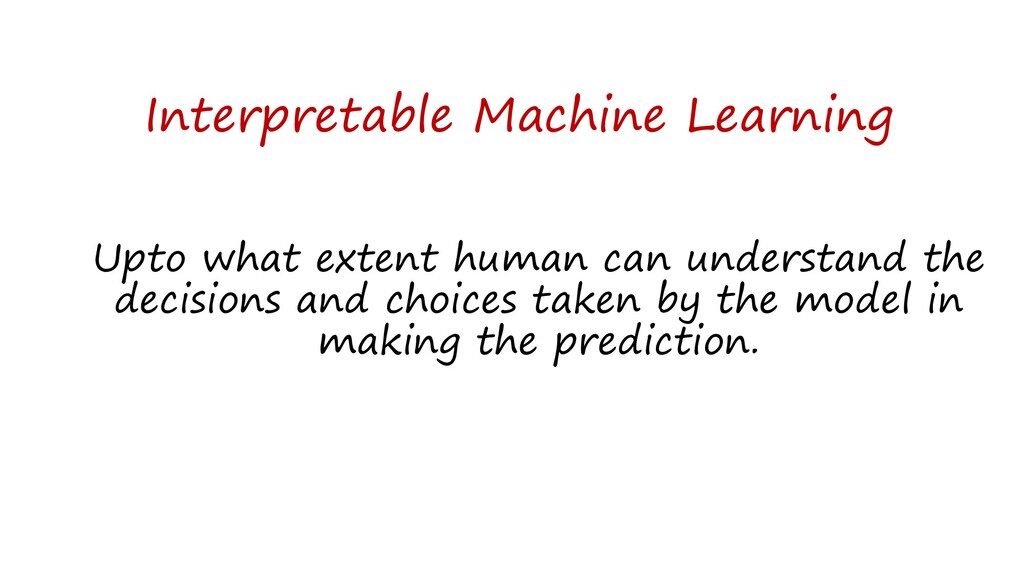
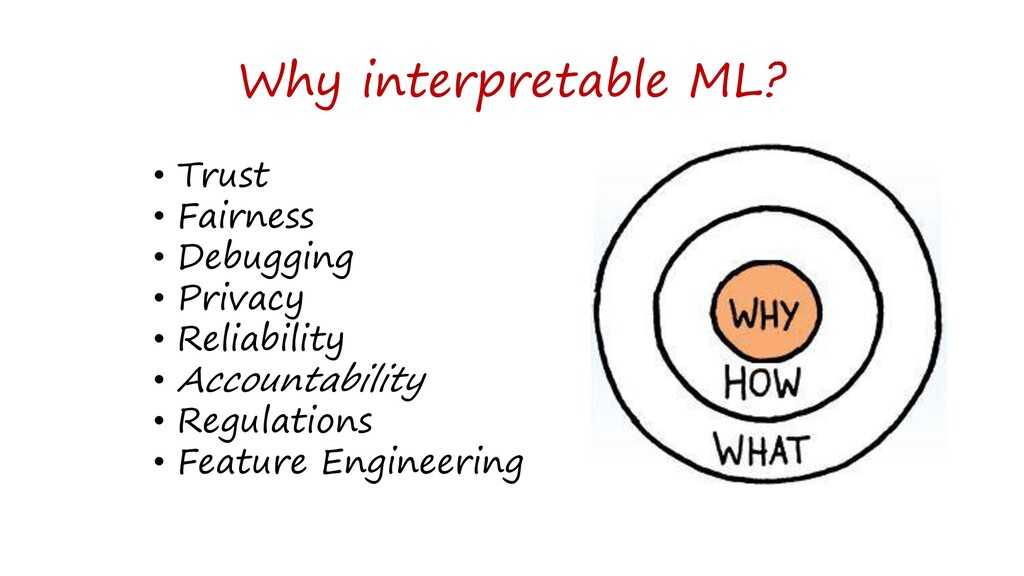
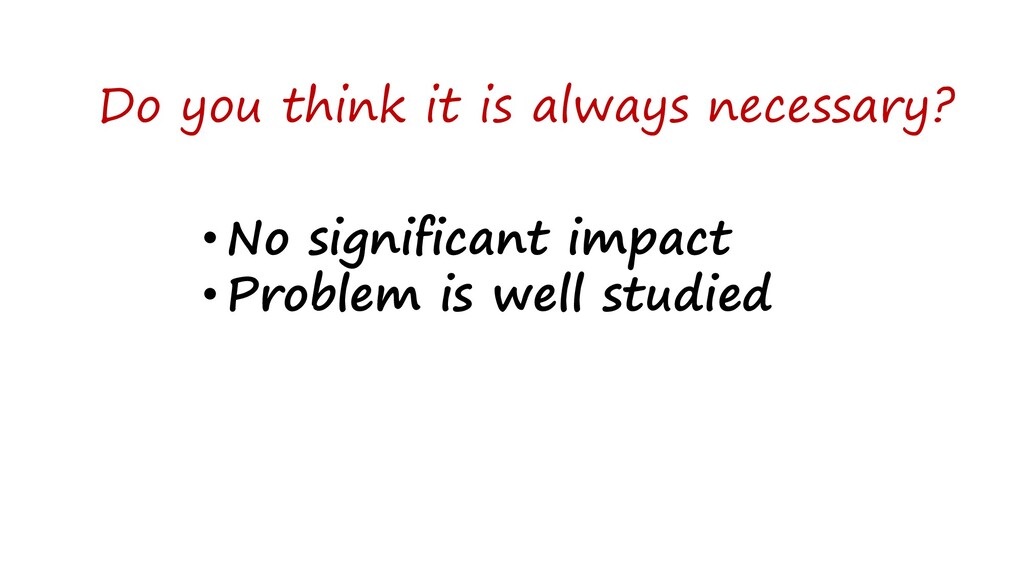
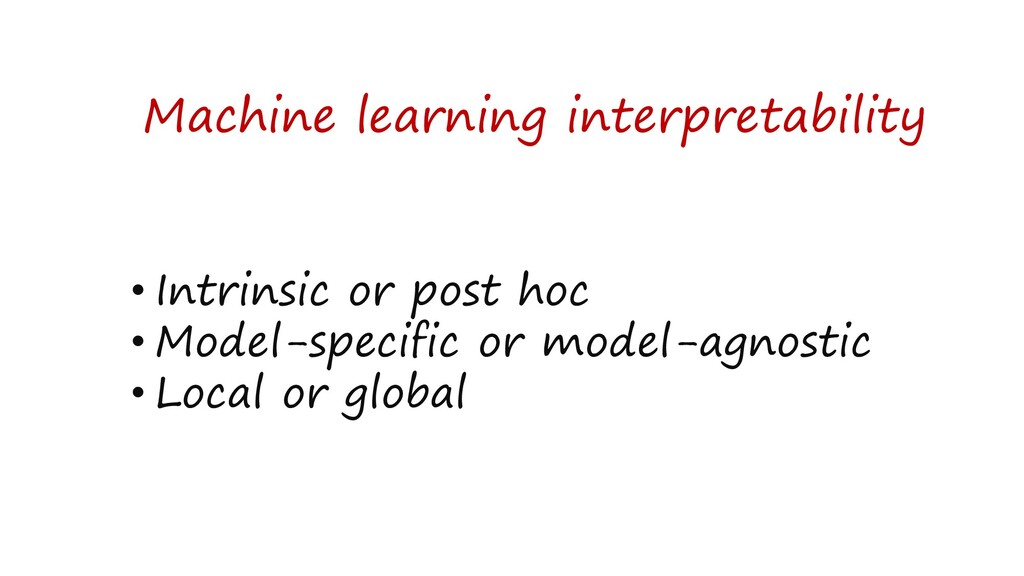
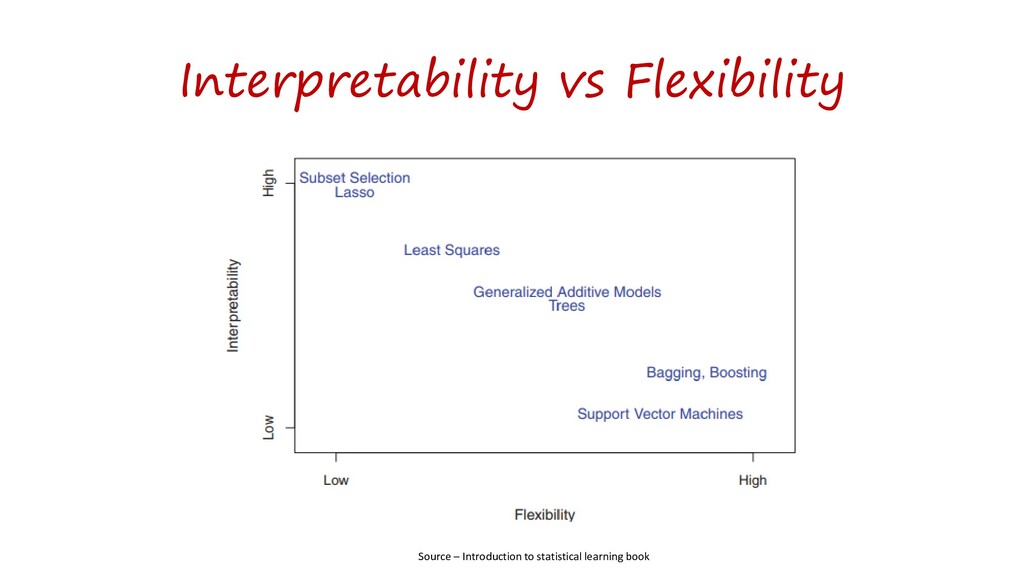
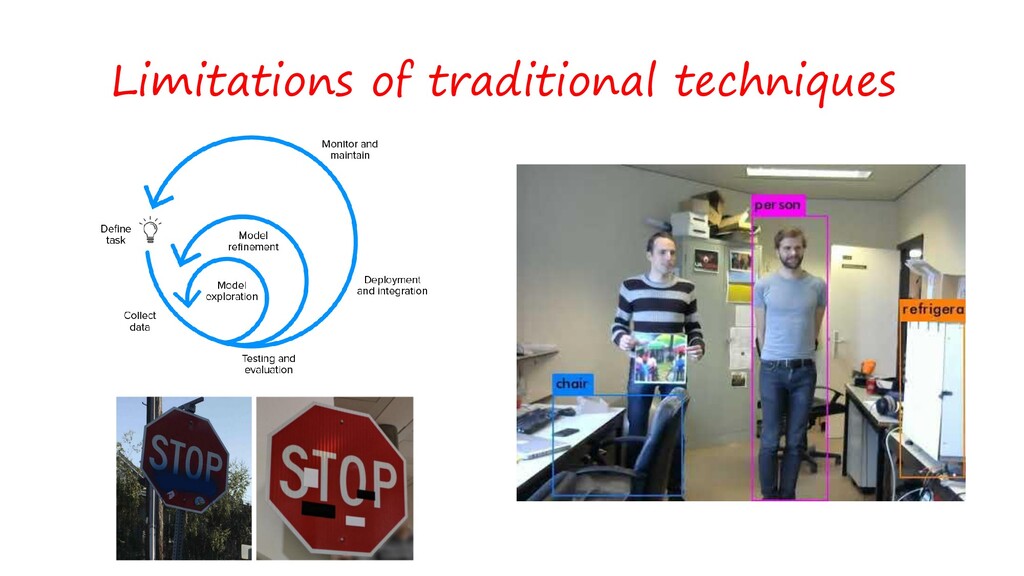
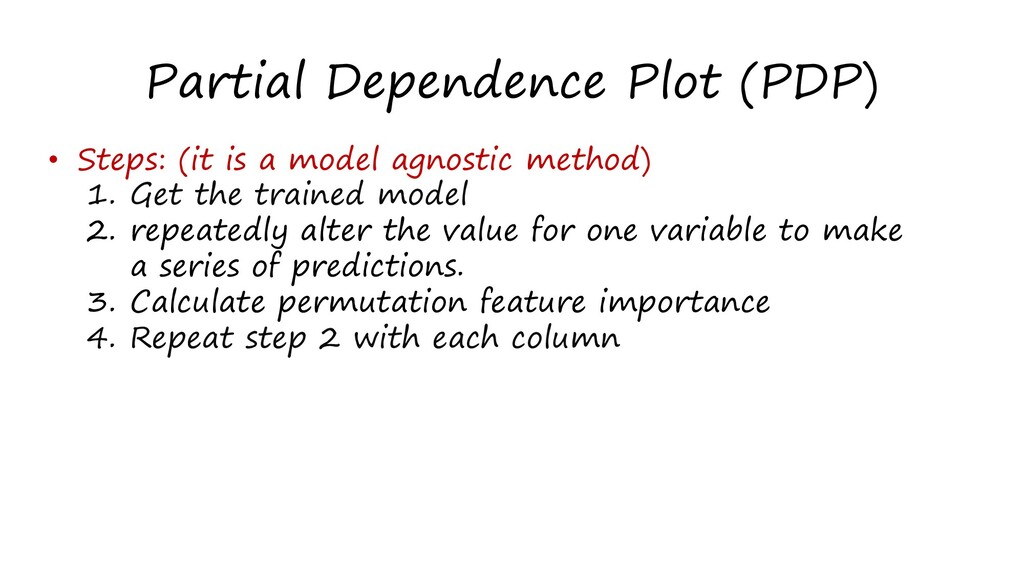
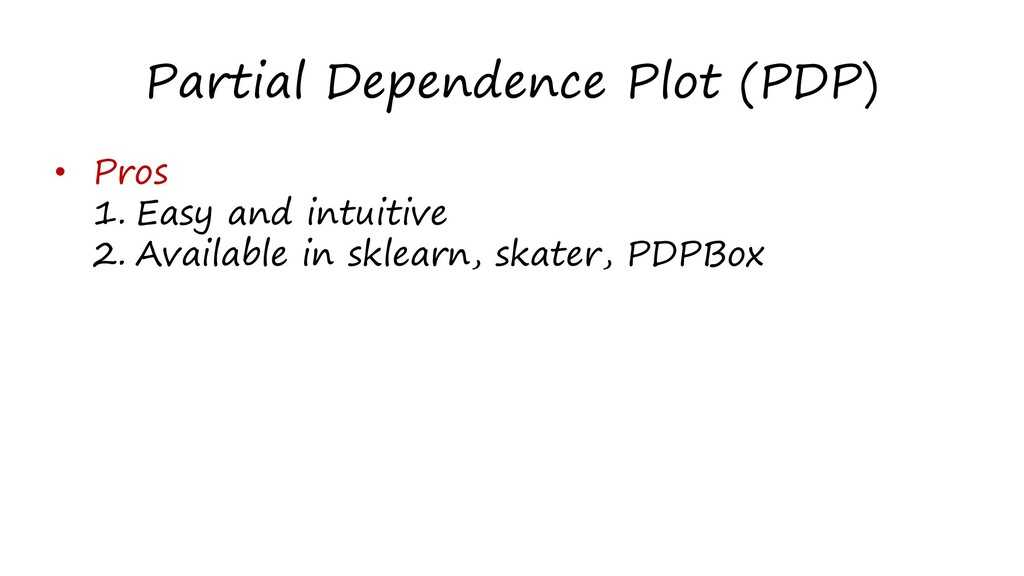
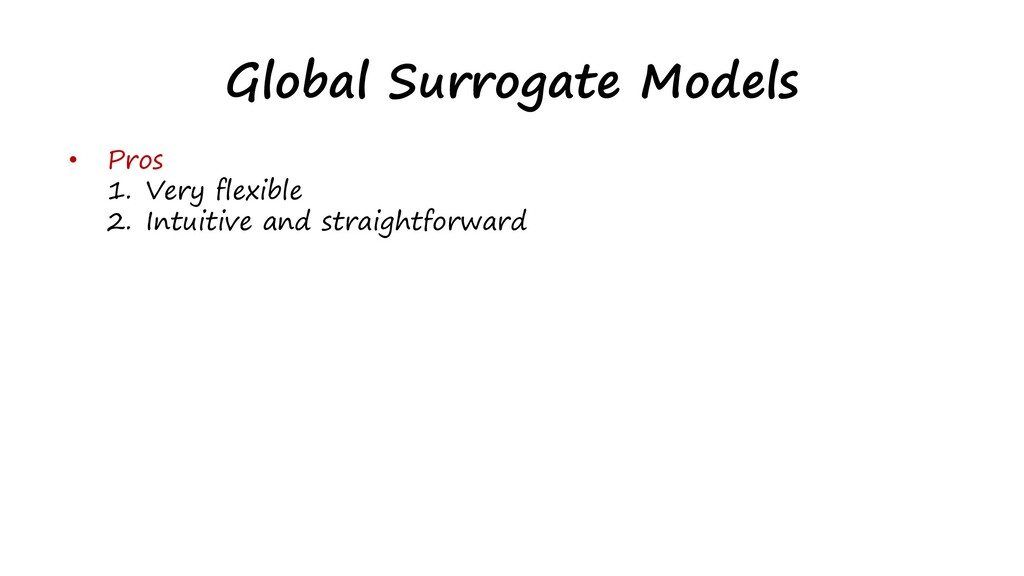
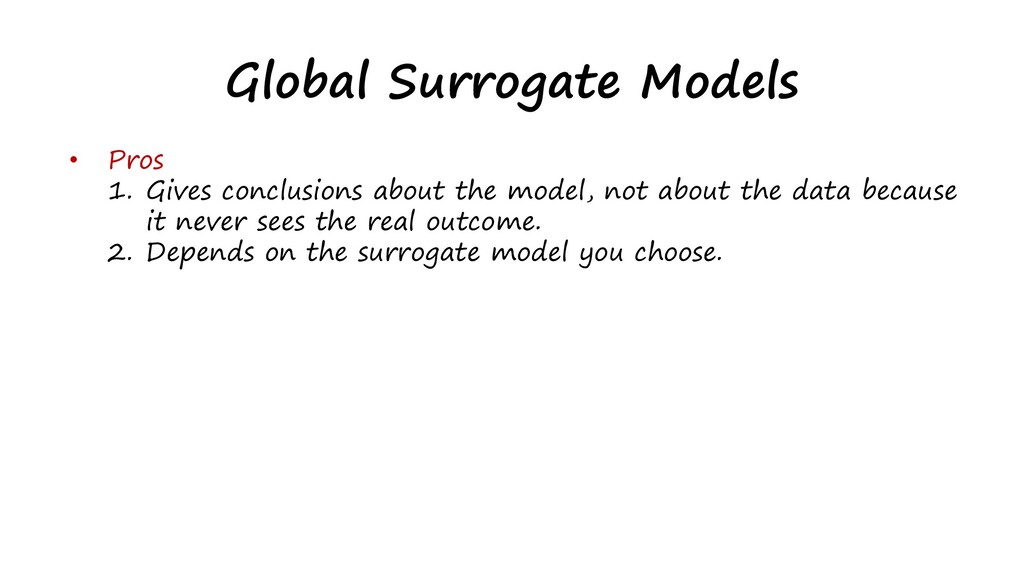
With the more complex algorithms like deep neural networks, random forest with 1000s of trees or dense machine learning models we are achieving the desired accuracy with a sacrifice of interpretability. If we are more interested in interpretability, we are sacrificing accuracy. In domains like finance or banking both are needed in justifying a prediction which helps the client and customers to understand why it predicted in that way. so how do we build interpretable machine learning models or explainable artificial intelligence? In this workshop, I will be explaining why it is important to build Interpretables models and how to draw insights from it and how to trust your model and make human to understand them, with the help of available methods.

uday kiran

March 21, 2020
Tweet

More Decks by uday kiran

Other Decks in Education

Transcript

  1. Black box? According to Oxford it is a complex system

    or device whose internal workings are hidden or not readily understood.
  2. Interpretable Machine Learning Upto what extent human can understand the

    decisions and choices taken by the model in making the prediction.
  3. Why interpretable ML? • Trust • Fairness • Debugging •

    Privacy • Reliability • Accountability • Regulations • Feature Engineering
  4. Do you think it is always necessary? • No significant

    impact • Problem is well studied
  5. Scope of interpretability • Global • How does the model

    make predictions? • How do parts of the model affect predictions? • Local • Why did the model make certain prediction for a single instance? • Why did the model make certain predictions for a group of instances?
  6. Traditional Techniques • Exploratory data analysis • Principal Component Analysis

    (PCA) • Self-organizing maps (SOM) • Latent Semantic Indexing • t-Distributed Stochastic Neighbor Embedding (t-SNE) • variational autoencoders • clustering •Performance evaluation metrics • precision •recall, •accuracy, •ROC curve and the AUC •(R-square) •root mean-square error •mean absolute error •silhouette coefficient
  7. Permutation Feature Importance • Steps: (it is a model agnostic

    method) 1. Get the trained model 2. Shuffel the values in column and calculate the loss 3. Calculate permutation feature importance 4. Repeat step 2 with each column
  8. Permutation Feature Importance • Pros 1. Simple and intuitive 2.

    Available through the eli5 and skater library 3. Easy to compute 4. Does not require retraining
  9. Permutation Feature Importance • Cons 1. Unclear about using test

    or tranin data 2. Different shuffles may give different results 3. Greatly influenced by correlated features 4. Requires labelled data
  10. Partial Dependence Plot (PDP) • Steps: (it is a model

    agnostic method) 1. Get the trained model 2. repeatedly alter the value for one variable to make a series of predictions. 3. Calculate permutation feature importance 4. Repeat step 2 with each column
  11. Partial Dependence Plot (PDP) • Pros 1. Easy and intuitive

    2. Available in sklearn, skater, PDPBox
  12. Partial Dependence Plot (PDP) • Cons 1. Assumption of feature

    independence (chek Accumulated Local Effect Plots) 2. maximum number of features
  13. Global Surrogate Models • Steps (Solving machine learning interpretability by

    using more machine learning!) 1. Get the data 2. Train Black-box model 3. Train interpretable model 4. Measure how well the surrogate model replicates the predictions of the black box model 5. Interprete the surrogate model.
  14. Global Surrogate Models • Pros 1. Gives conclusions about the

    model, not about the data because it never sees the real outcome. 2. Depends on the surrogate model you choose.
  15. Local Interpretable Model-agnostic Explanations (LIME) • Steps 1. Select your

    instance of interest for which you want to have an explanation of its black box prediction. 2. Perturb your dataset and get the black box predictions for these new points. 3. Weight the new samples according to their proximity to the instance of interest. 4. Train a weighted, interpretable model on the dataset with the variations. 5. Explain the prediction by interpreting the local model.
  16. Local Interpretable Model-agnostic Explanations (LIME) • Pros 1. Flexibility 2.

    Works withtabular data, text and images 3. Guaranteed high precision
  17. Local Interpretable Model-agnostic Explanations (LIME) • Cons 1. No correct

    definition of the neighborhood 2. if you repeat the sampling process, then the explanations that come out can be different. 3. Still in development phase
  18. Shapley Values and SHapley Additive exPlanations (SHAP) • Pros 1.

    fairly distributed 2. solid theory 3. explain a prediction as a game
  19. Shapley Values and SHapley Additive exPlanations (SHAP) • Cons 1.

    lot of computing time 2. can be misinterpreted 3. no prediction model 4. no prediction model