Lars Kristensen (CfA) and WISH & HOP Teams Leiden Observatory, The Netherlands Low-mass star formation using high-J CO and O2 lines Monday, March 4, 13
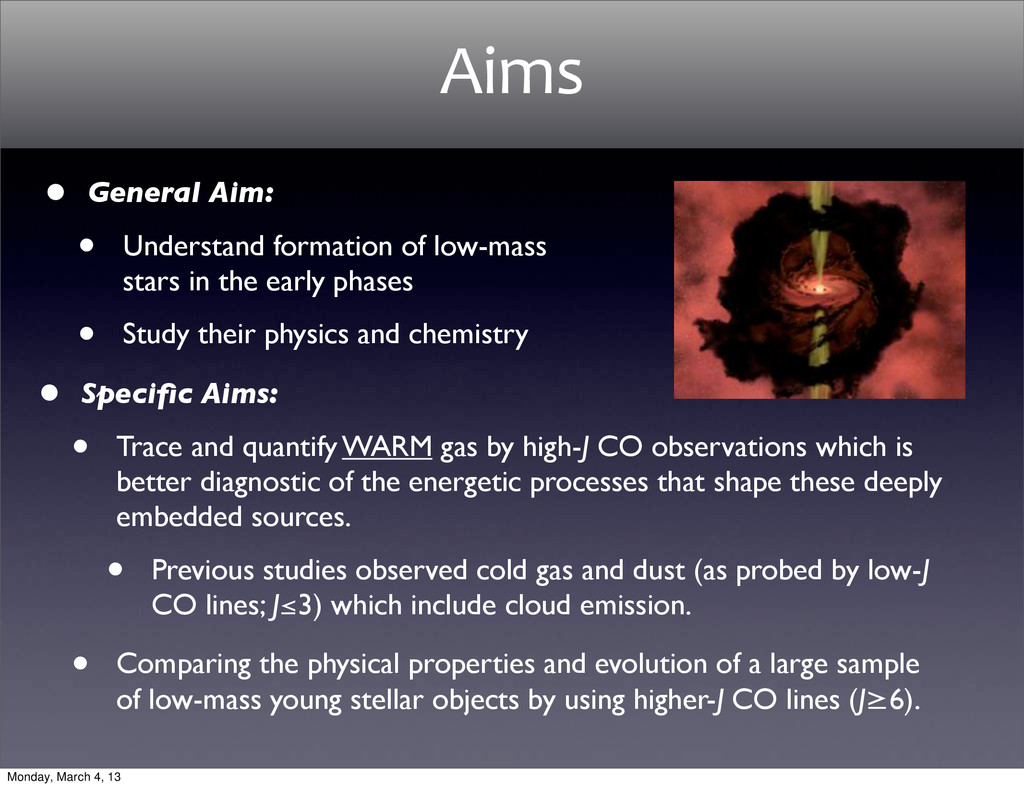
high-J CO observations which is better diagnostic of the energetic processes that shape these deeply embedded sources. • Previous studies observed cold gas and dust (as probed by low-J CO lines; J≤3) which include cloud emission. • Comparing the physical properties and evolution of a large sample of low-mass young stellar objects by using higher-J CO lines (J≥6). Aims • General Aim: • Understand formation of low-mass stars in the early phases • Study their physics and chemistry Monday, March 4, 13
does it originate? • How is this gas heated: shocks vs. UV heating, or something else? • CO excitation: • What is the role of outflows and cavity walls vs protostellar envelope? • How does the CO abundance evolve as function of radius over the entire envelope? • How different are Class 0 and I YSOs? Tracing evolution by CO emission? • What is the abundance of O2 in a Class 0 protostar? Open Questions? Monday, March 4, 13
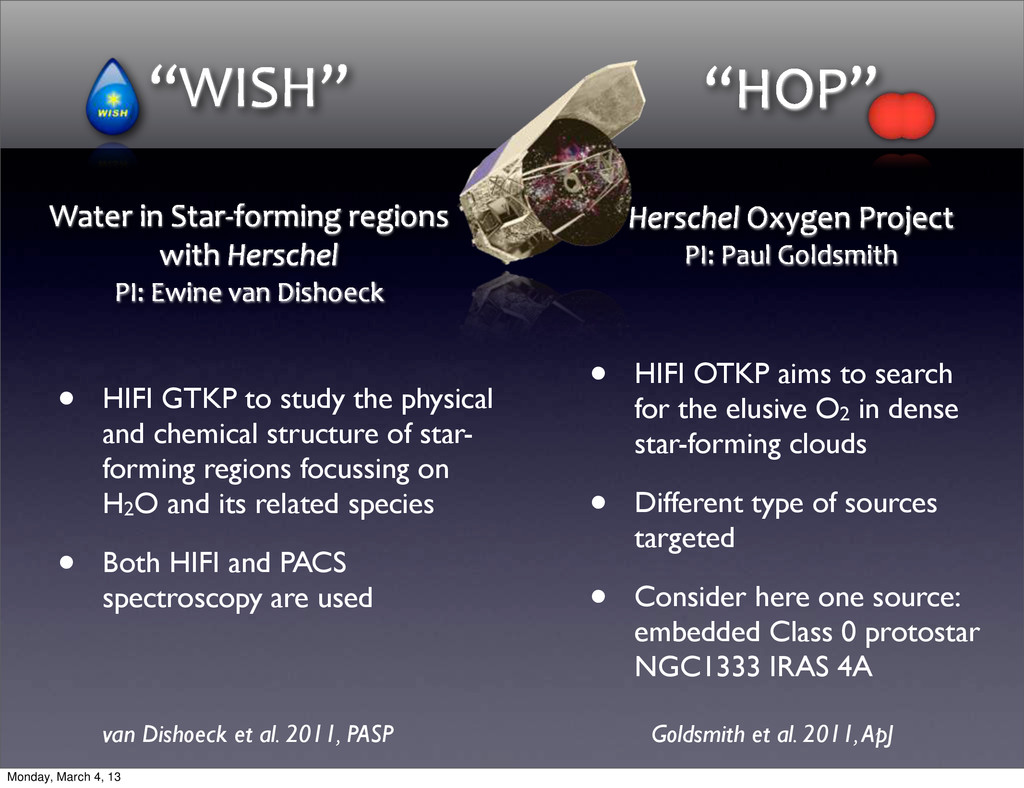
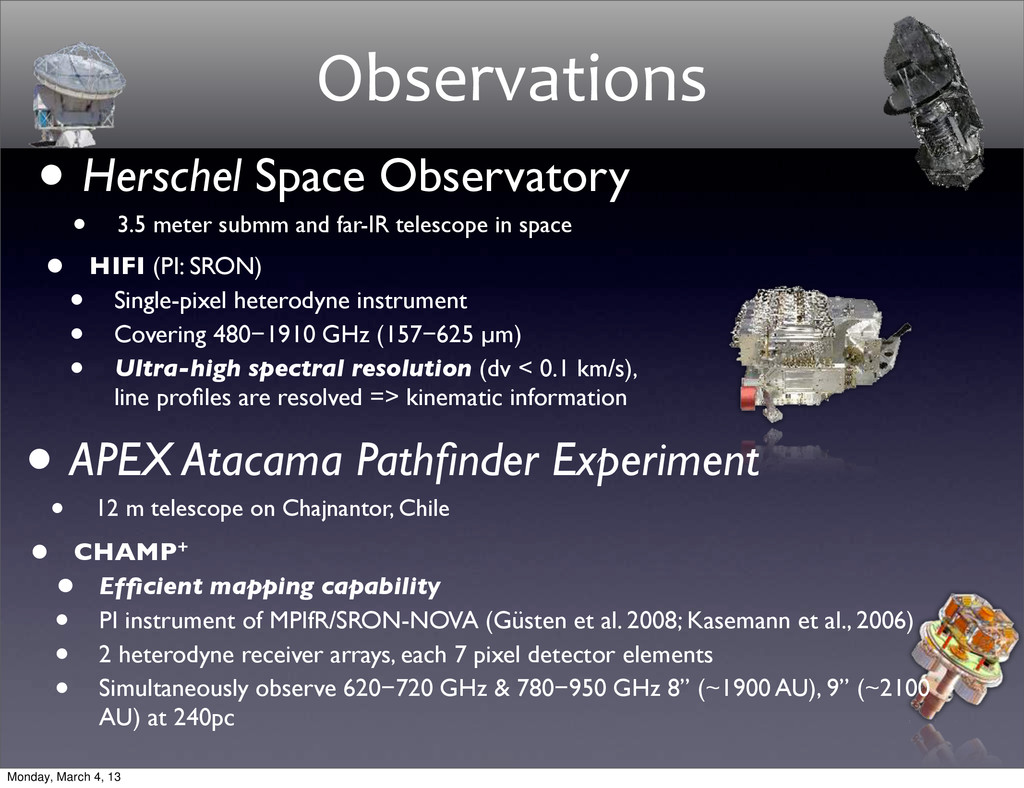
of star- forming regions focussing on H2O and its related species • Both HIFI and PACS spectroscopy are used “HOP” Herschel Oxygen Project PI: Paul Goldsmith “WISH” Water in Star-‐forming regions with Herschel PI: Ewine van Dishoeck • HIFI OTKP aims to search for the elusive O2 in dense star-forming clouds • Different type of sources targeted • Consider here one source: embedded Class 0 protostar NGC1333 IRAS 4A van Dishoeck et al. 2011, PASP Goldsmith et al. 2011, ApJ Monday, March 4, 13
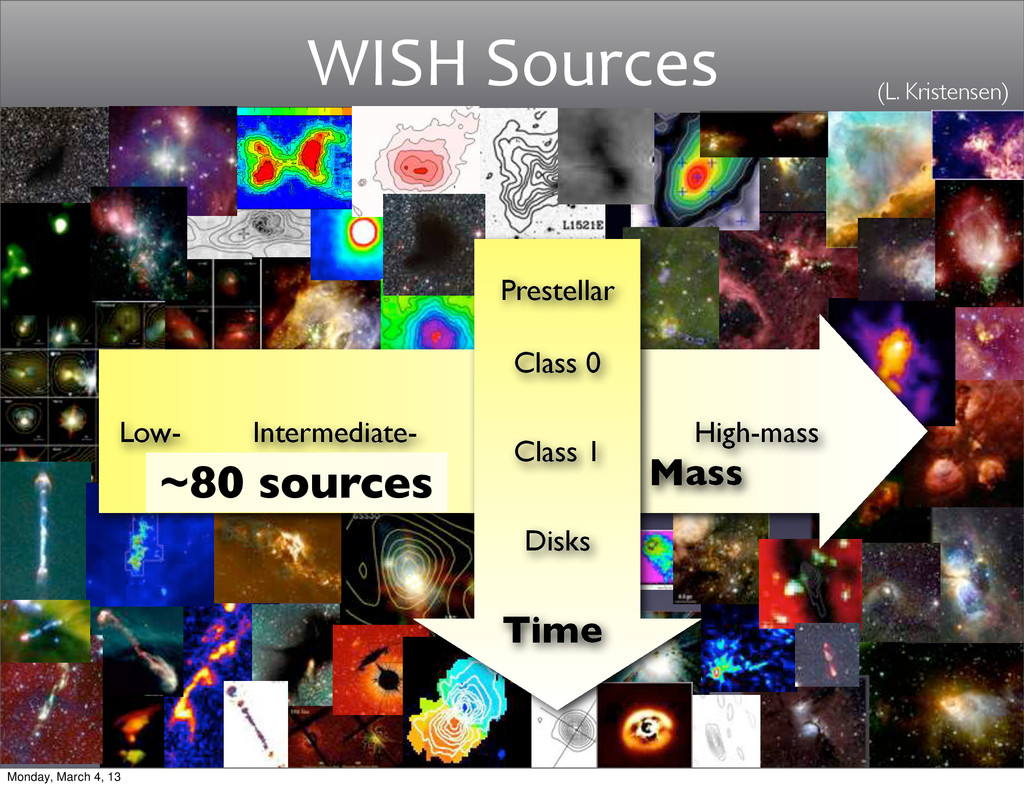
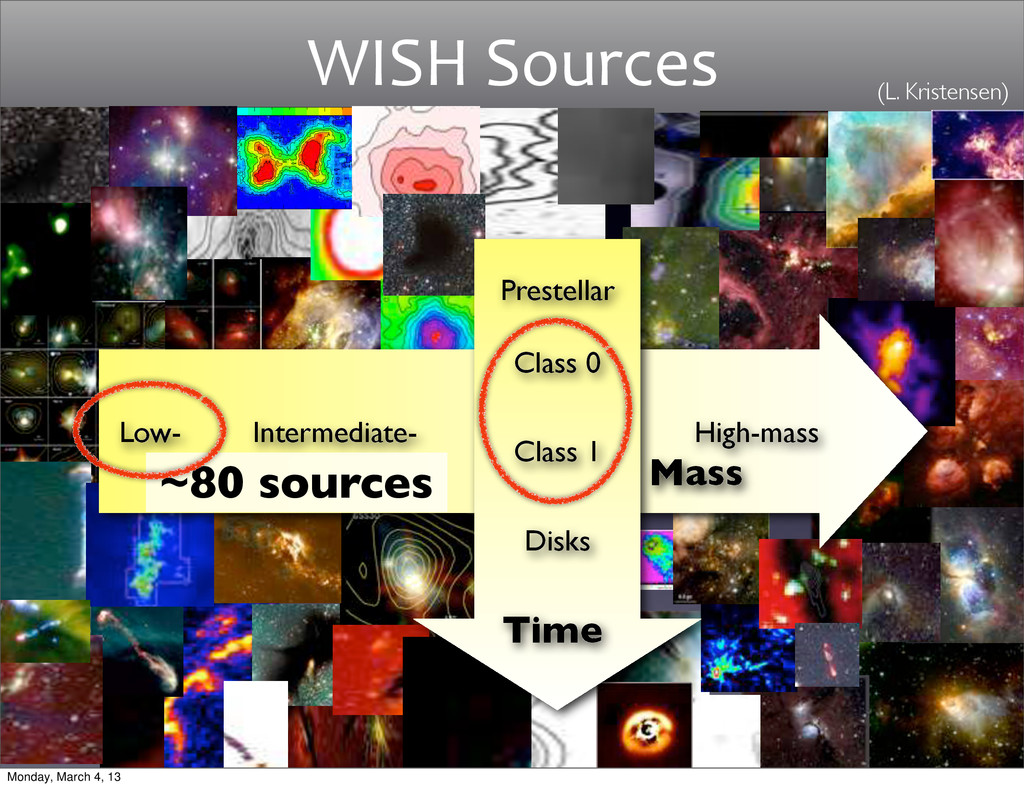
of L1527 and L483 7 Fig. 4. Top panel: CO 6-5 and CO 7-6 maps of L1527. Contour levels are 6σ, 12σ, 18σ etc. (σ(CO 6−5) = 1.5 K and σ(CO 7 − 6) = 4.1 K). Central position is marked with a X. Bottom panel: Spectral maps of L1527 in CO 6-5 (right) and CO 7-6 (left) transitions. Time Mass Prestellar Class 0 Class 1 Disks Intermediate- High-mass Low- ~80 sources ~80 sources (L. Kristensen) WISH Sources Monday, March 4, 13
of L1527 and L483 7 Fig. 4. Top panel: CO 6-5 and CO 7-6 maps of L1527. Contour levels are 6σ, 12σ, 18σ etc. (σ(CO 6−5) = 1.5 K and σ(CO 7 − 6) = 4.1 K). Central position is marked with a X. Bottom panel: Spectral maps of L1527 in CO 6-5 (right) and CO 7-6 (left) transitions. Time Mass Prestellar Class 0 Class 1 Disks Intermediate- High-mass Low- ~80 sources ~80 sources (L. Kristensen) WISH Sources Monday, March 4, 13
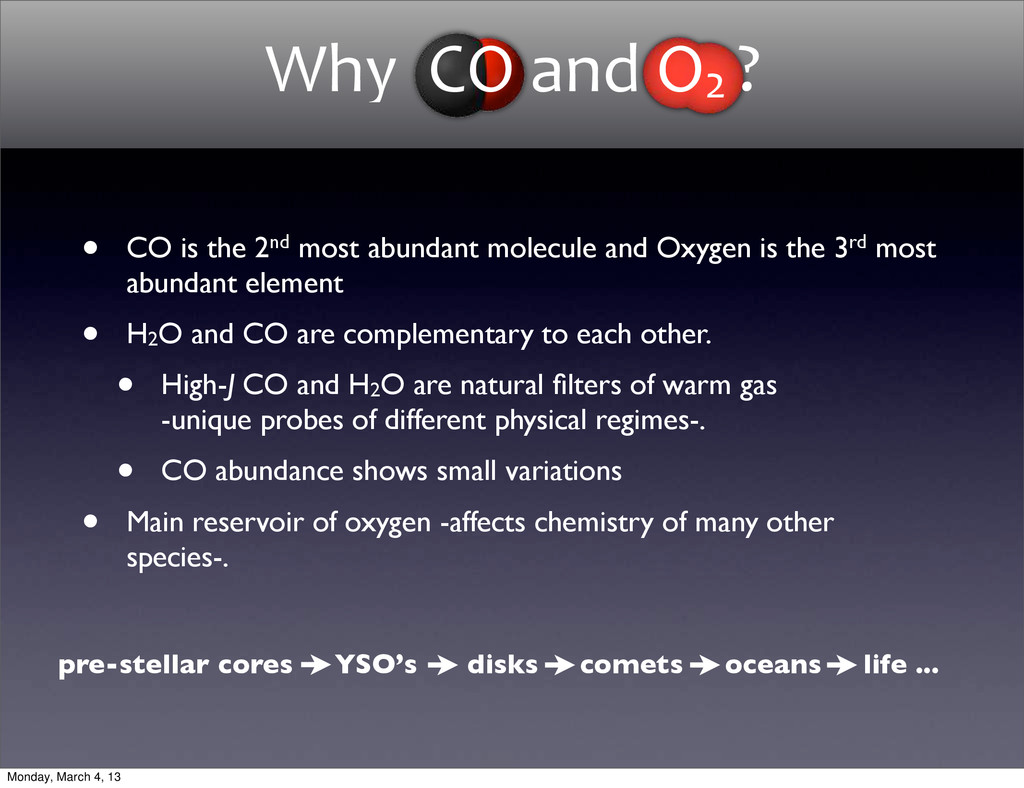
is the 2nd most abundant molecule and Oxygen is the 3rd most abundant element • H2O and CO are complementary to each other. • High-J CO and H2O are natural filters of warm gas -unique probes of different physical regimes-. • CO abundance shows small variations • Main reservoir of oxygen -affects chemistry of many other species-. Why CO and O2 ? Monday, March 4, 13
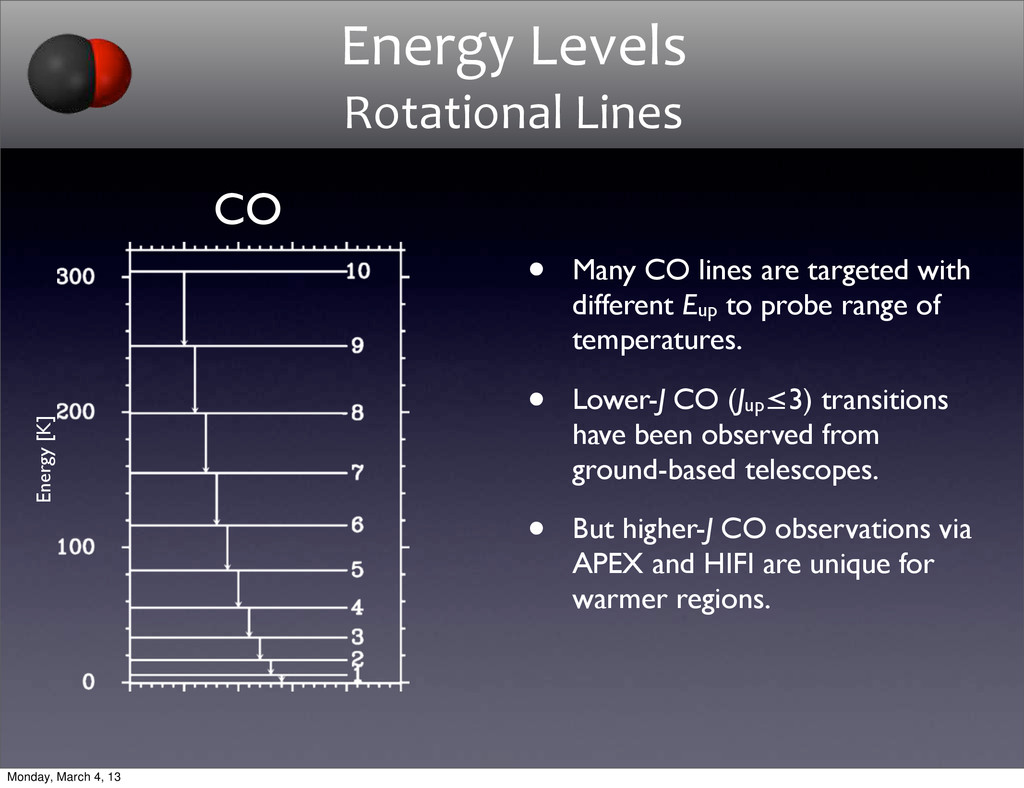
probe range of temperatures. • Lower-J CO (Jup ≤3) transitions have been observed from ground-based telescopes. • But higher-J CO observations via APEX and HIFI are unique for warmer regions. Energy Levels Rotational Lines CO Energy [K] Monday, March 4, 13
probe range of temperatures. • Lower-J CO (Jup ≤3) transitions have been observed from ground-based telescopes. • But higher-J CO observations via APEX and HIFI are unique for warmer regions. Energy Levels Rotational Lines CO Energy [K] Monday, March 4, 13
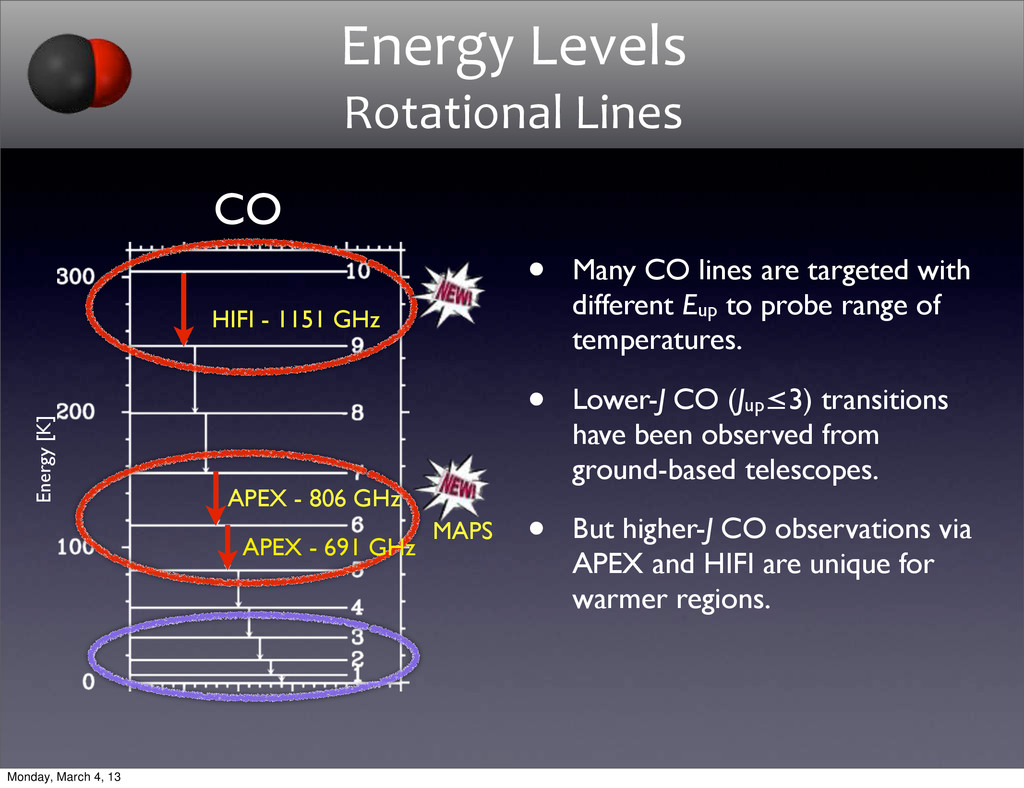
probe range of temperatures. • Lower-J CO (Jup ≤3) transitions have been observed from ground-based telescopes. • But higher-J CO observations via APEX and HIFI are unique for warmer regions. Energy Levels Rotational Lines CO Energy [K] HIFI - 1151 GHz APEX - 691 GHz APEX - 806 GHz MAPS Monday, March 4, 13
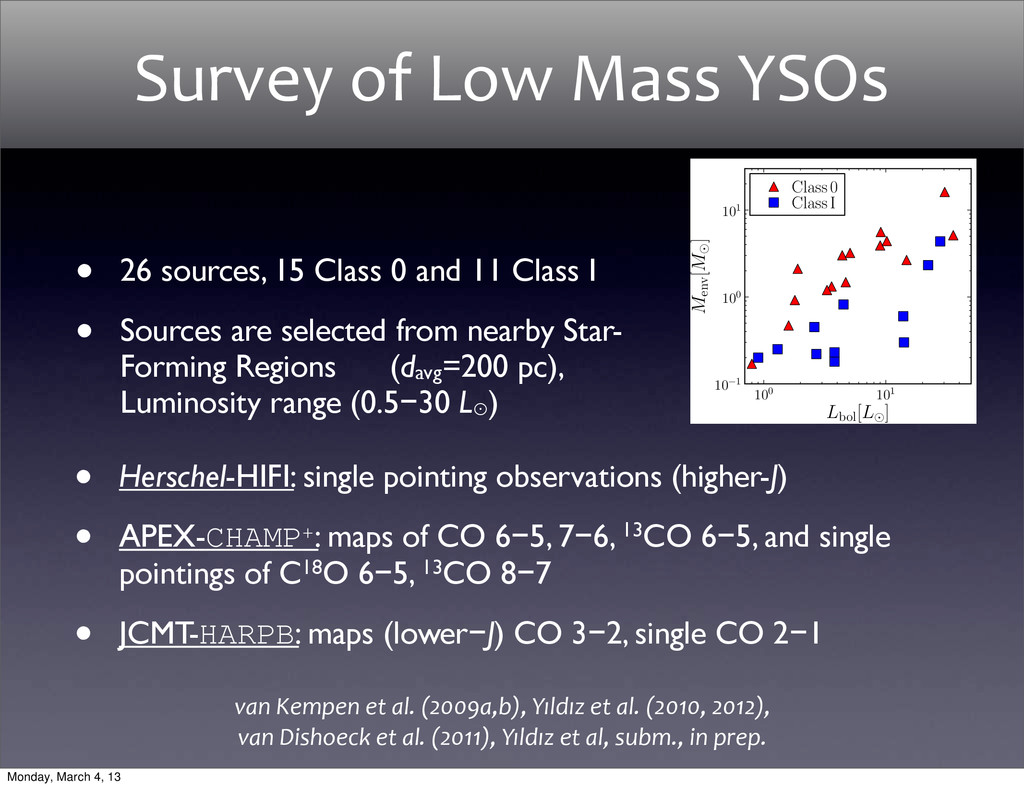
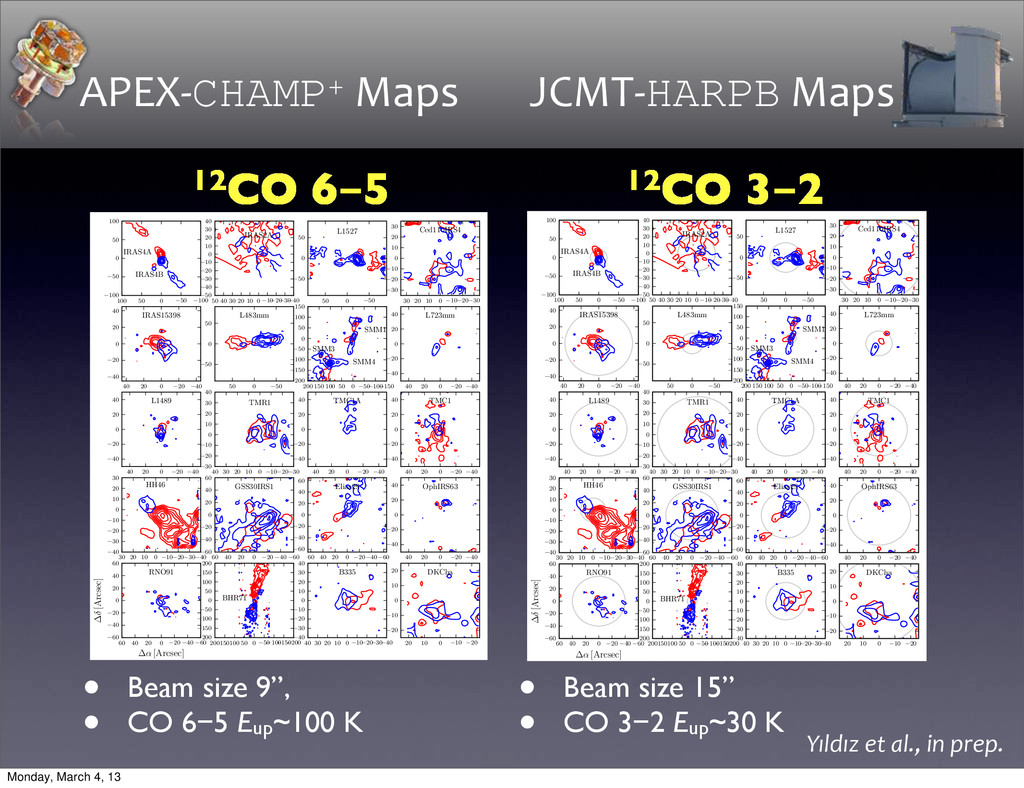
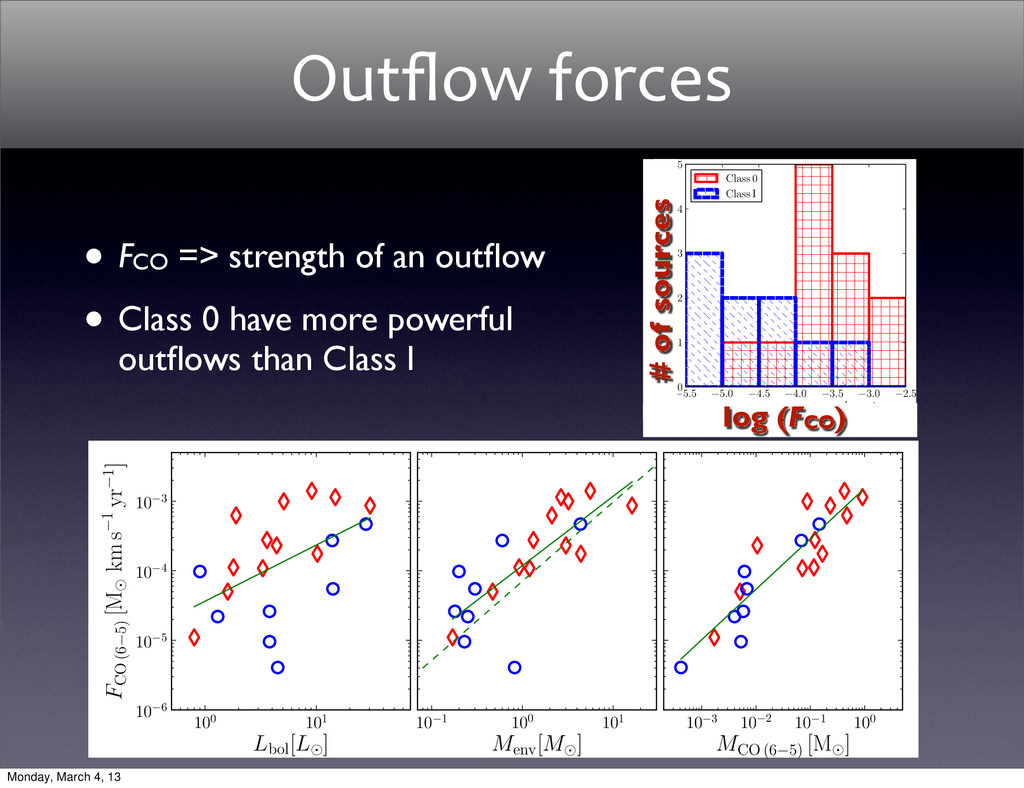
CO 6−5, 7−6, 13CO 6−5, and single pointings of C18O 6−5, 13CO 8−7 • JCMT-HARPB: maps (lower−J) CO 3−2, single CO 2−1 van Kempen et al. (2009a,b), Yıldız et al. (2010, 2012), van Dishoeck et al. (2011), Yıldız et al, subm., in prep. Survey of Low Mass YSOs 100 101 Lbol[L ] 10−1 100 101 Menv[M ] Class 0 Class I • 26 sources, 15 Class 0 and 11 Class I • Sources are selected from nearby Star- Forming Regions (davg=200 pc), Luminosity range (0.5−30 L⊙ ) Monday, March 4, 13
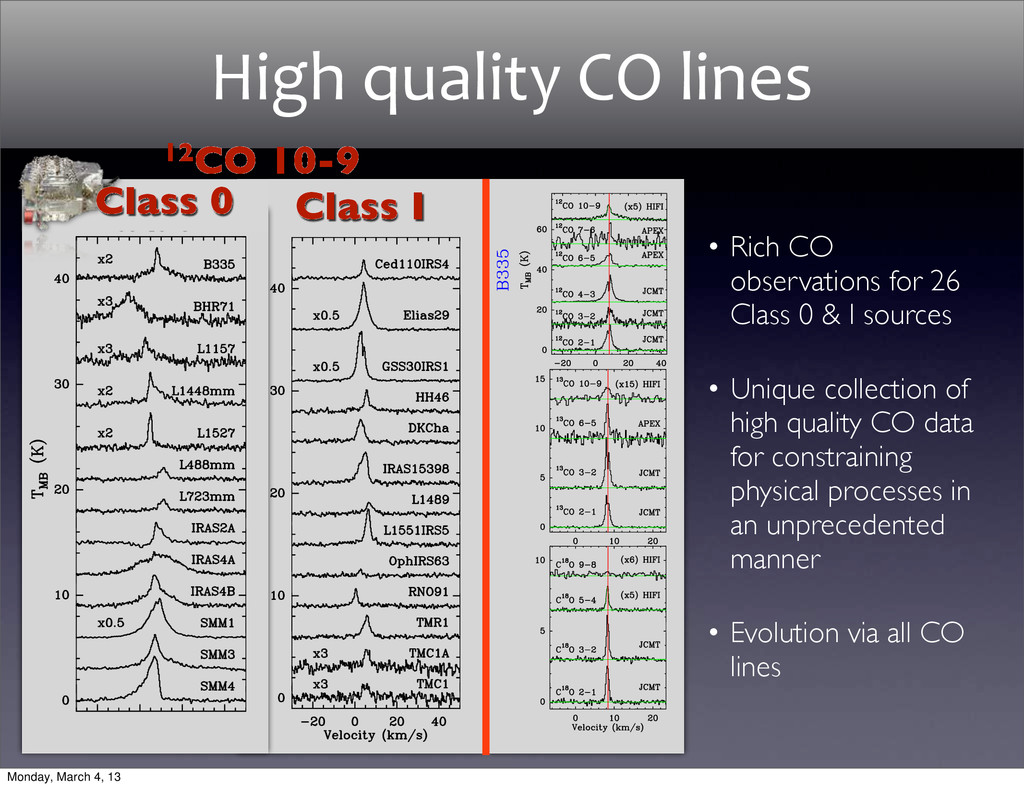
sources • Unique collection of high quality CO data for constraining physical processes in an unprecedented manner • Evolution via all CO lines High quality CO lines Class I 12CO 10-9 Class 0 Monday, March 4, 13
SMM4 SMM3 L723MM B335 L1157 L1489 L1551IRS5 TMR1 HH46 DKCha GSS30IRS1 Elias29 0 20 40 60 80 100 Narrow/Broad (%) Narrow Broad Decomposing 12CO 10−9 Class 0 Class I • Median fraction 42% • Contributions are comparable • Careful with interpreting spectrally unresolved data (SPIRE, PACS) • Relative fraction of integrated intensity of narrow and broad components for each source Yıldız et al., subm., San Jose Garcia et al. in press Monday, March 4, 13
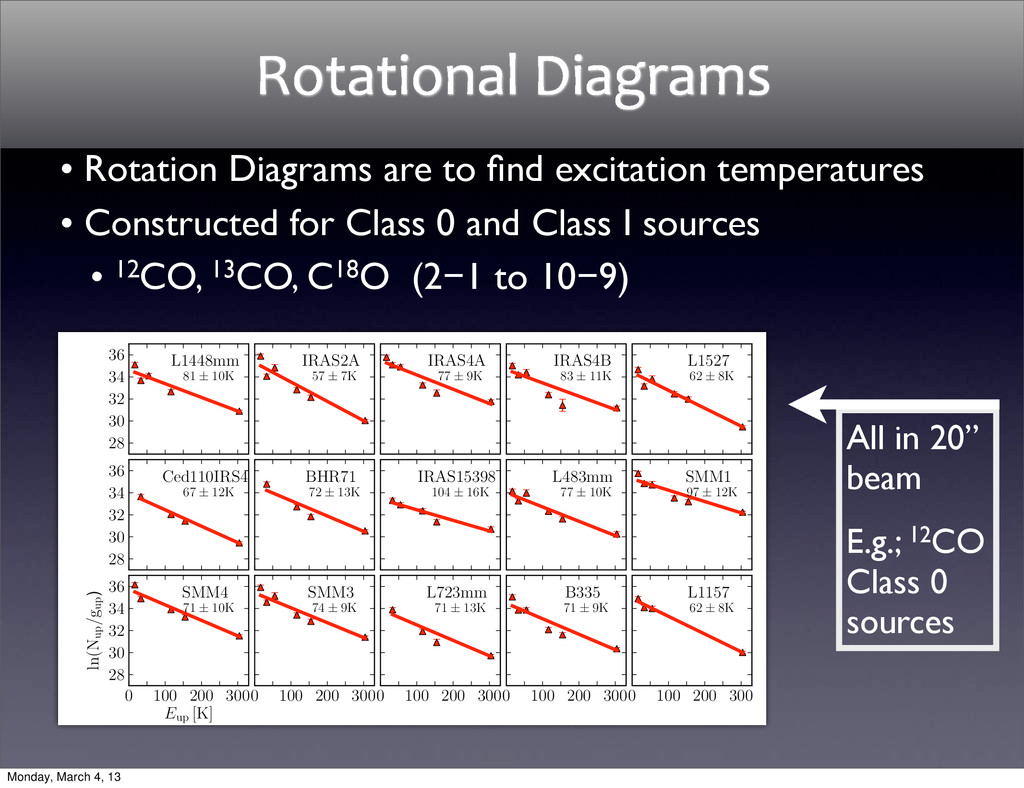
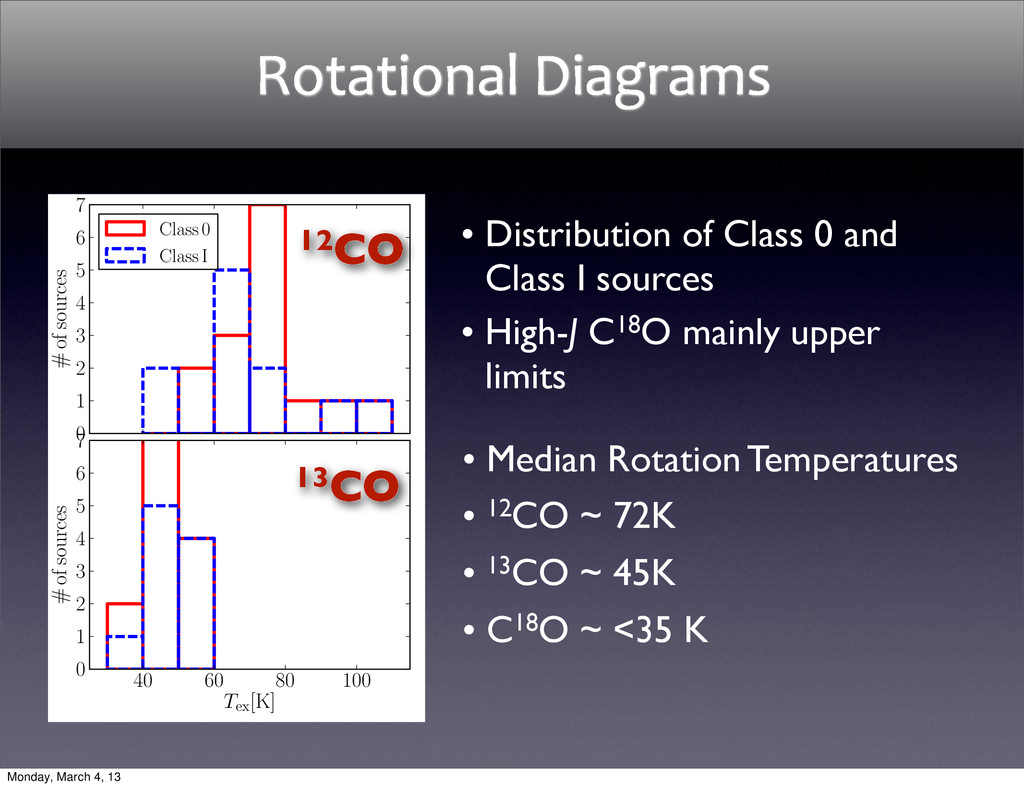
sources 12CO Class 0 Class I 40 60 80 100 Tex[K] 0 1 2 3 4 5 6 7 # of sources 13CO • Median Rotation Temperatures • 12CO ~ 72K • 13CO ~ 45K • C18O ~ <35 K • Distribution of Class 0 and Class I sources • High-J C18O mainly upper limits Model vs. Observations Rotational Diagrams 12CO 13CO Monday, March 4, 13
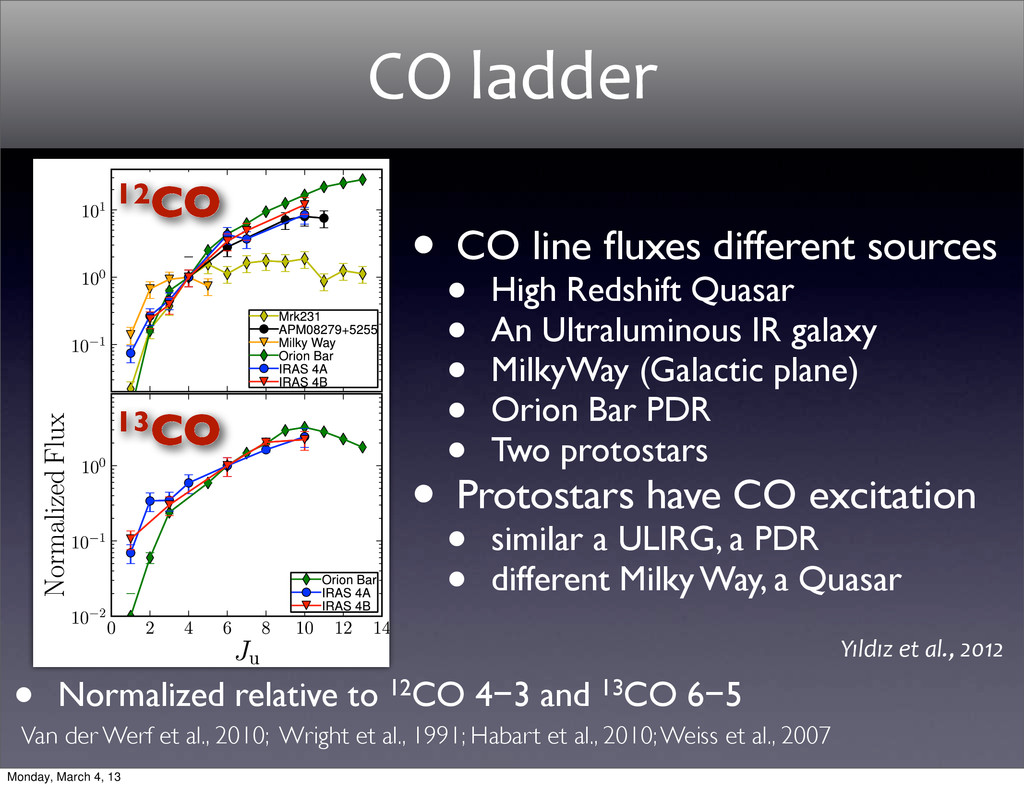
• An Ultraluminous IR galaxy • MilkyWay (Galactic plane) • Orion Bar PDR • Two protostars • Protostars have CO excitation • similar a ULIRG, a PDR • different Milky Way, a Quasar CO ladder • Normalized relative to 12CO 4−3 and 13CO 6−5 Van der Werf et al., 2010; Wright et al., 1991; Habart et al., 2010; Weiss et al., 2007 12CO 13CO Yıldız et al., 2012 Monday, March 4, 13
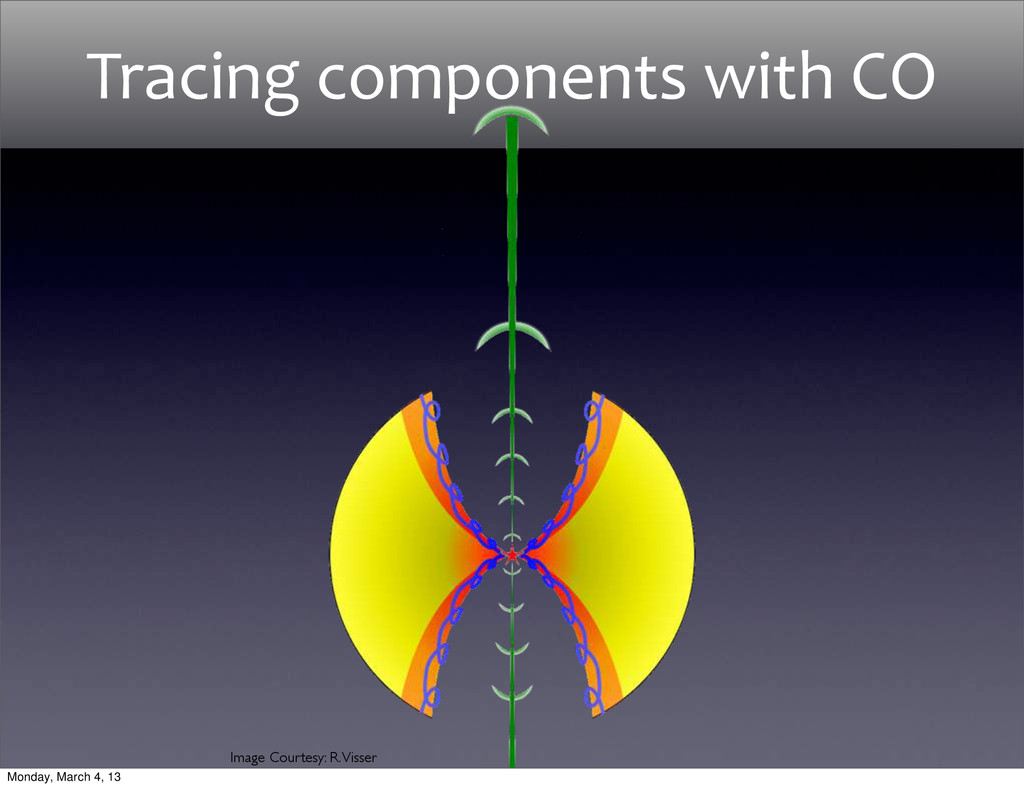
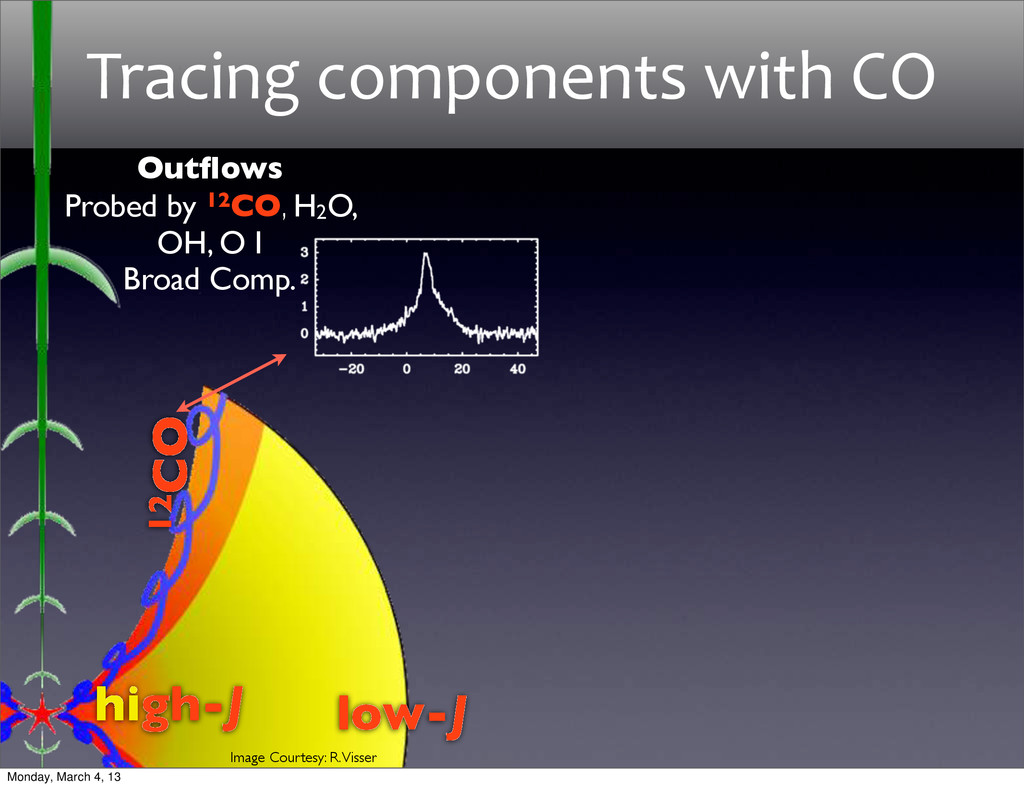
< Tgas < 1000K Outflows Probed by 12CO, H2O, OH, O I Broad Comp. 12CO 13 CO low-J high-J Image Courtesy: R. Visser Tracing components with CO Monday, March 4, 13
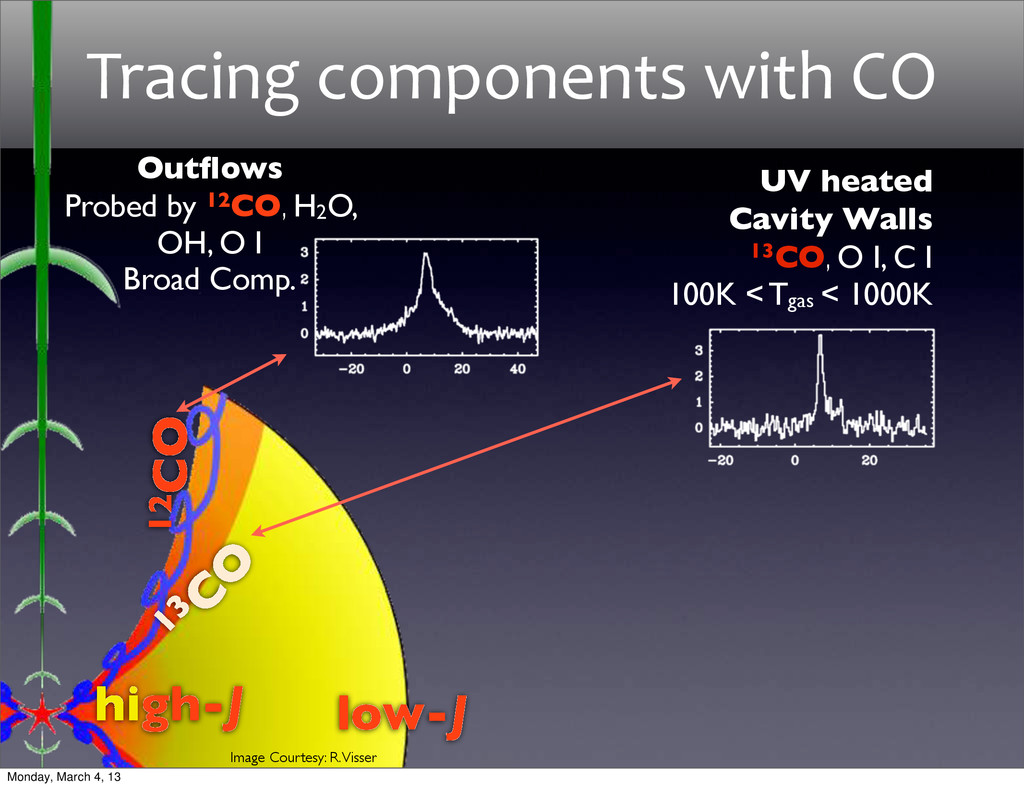
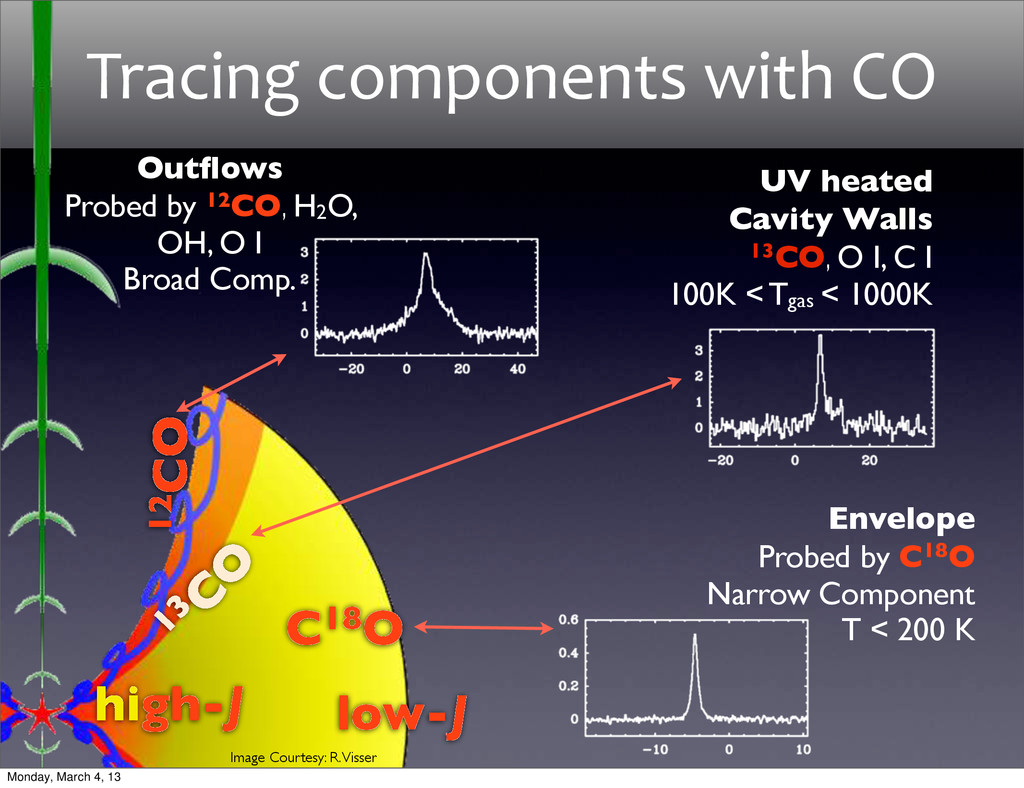
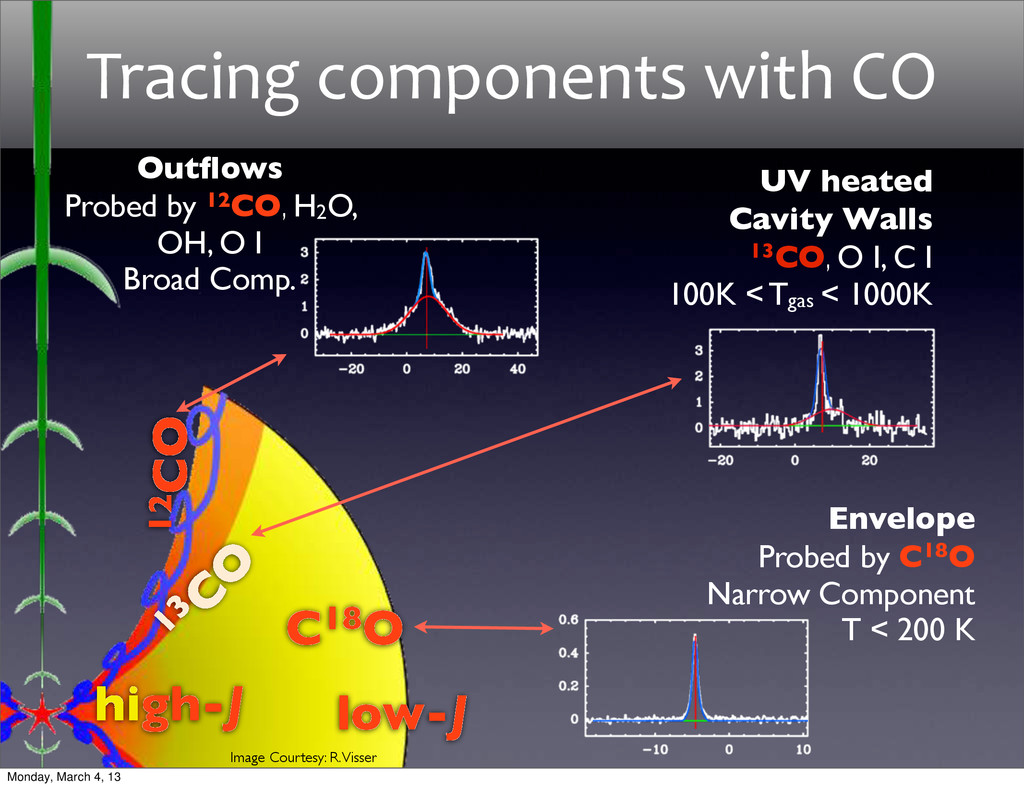
UV heated Cavity Walls 13CO, O I, C I 100K < Tgas < 1000K Outflows Probed by 12CO, H2O, OH, O I Broad Comp. 12CO 13 CO C18O low-J high-J Image Courtesy: R. Visser Tracing components with CO Monday, March 4, 13
UV heated Cavity Walls 13CO, O I, C I 100K < Tgas < 1000K Outflows Probed by 12CO, H2O, OH, O I Broad Comp. 12CO 13 CO C18O low-J high-J Image Courtesy: R. Visser Tracing components with CO Monday, March 4, 13
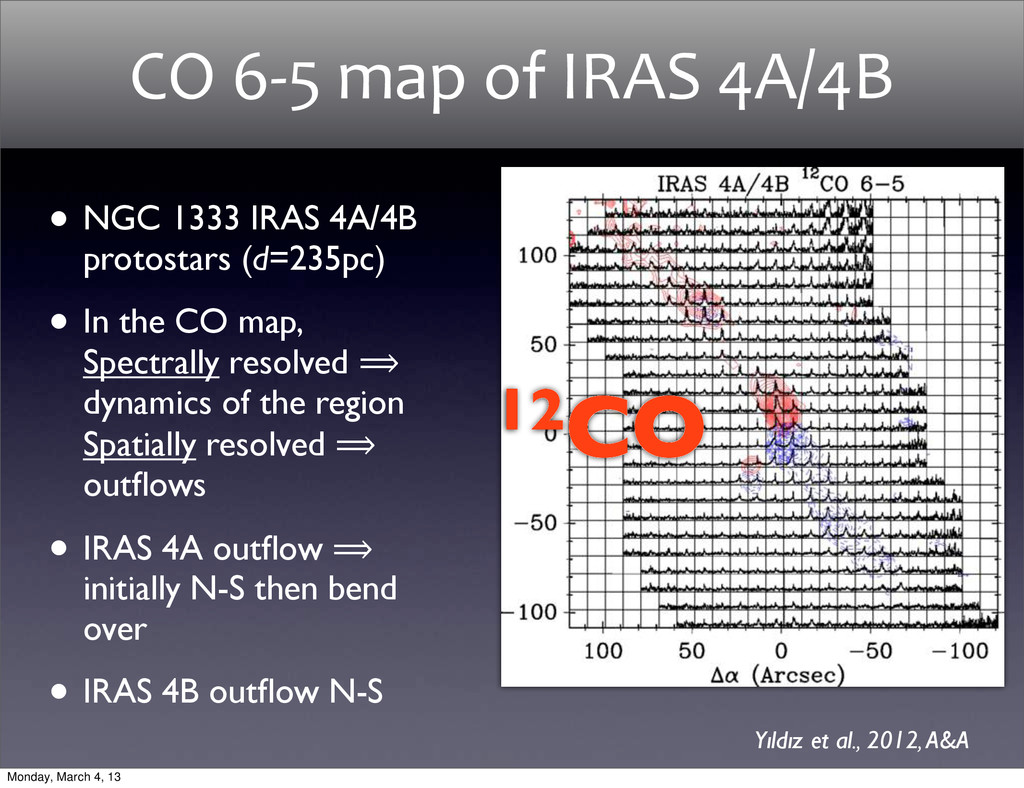
CO map, Spectrally resolved ⟹ dynamics of the region Spatially resolved ⟹ outflows • IRAS 4A outflow ⟹ initially N-S then bend over • IRAS 4B outflow N-S CO 6-‐5 map of IRAS 4A/4B Yıldız et al., 2012, A&A 12CO Monday, March 4, 13
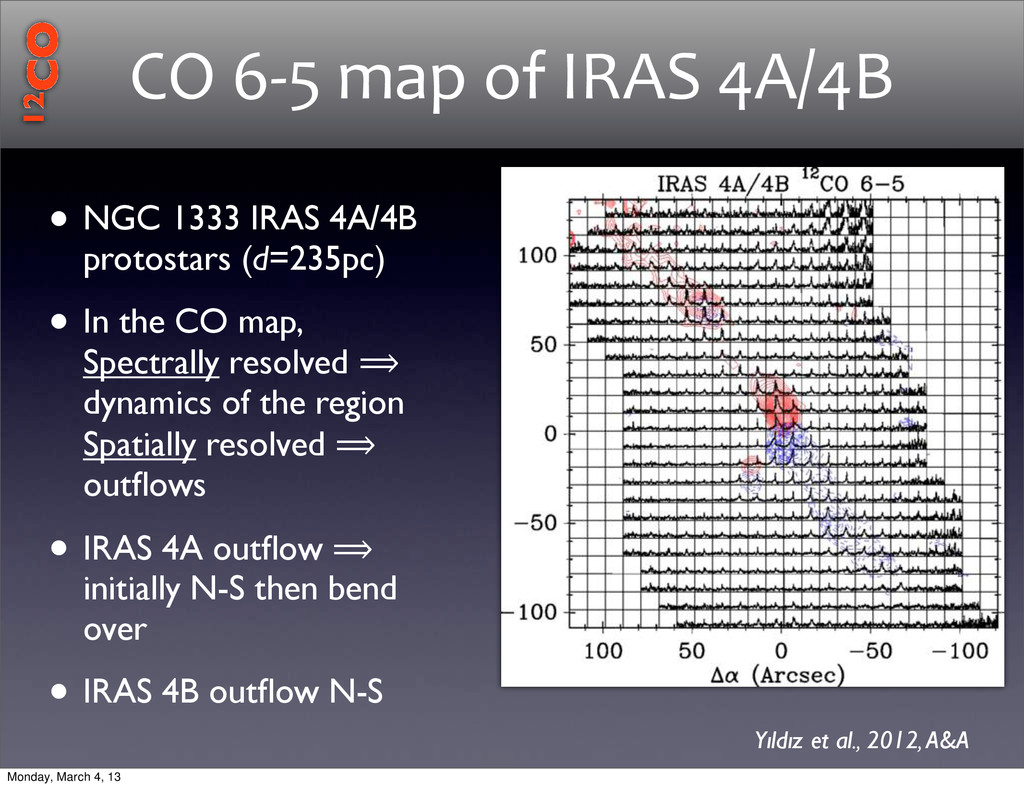
CO map, Spectrally resolved ⟹ dynamics of the region Spatially resolved ⟹ outflows • IRAS 4A outflow ⟹ initially N-S then bend over • IRAS 4B outflow N-S CO 6-‐5 map of IRAS 4A/4B Yıldız et al., 2012, A&A 12CO Monday, March 4, 13
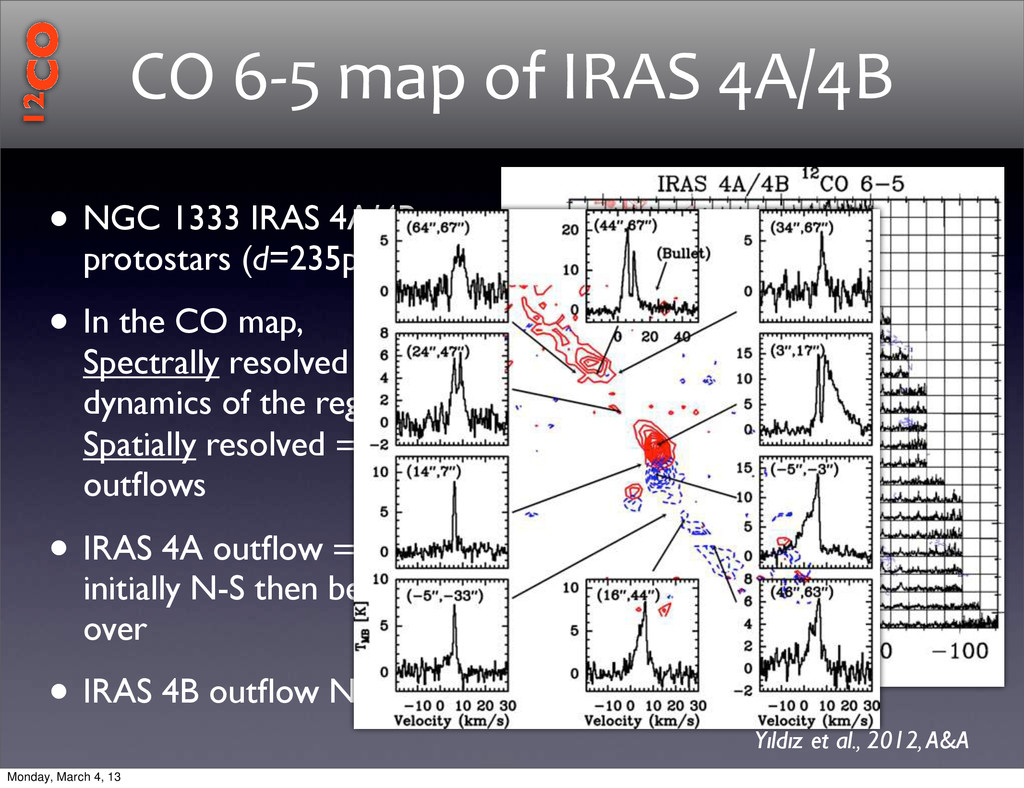
CO map, Spectrally resolved ⟹ dynamics of the region Spatially resolved ⟹ outflows • IRAS 4A outflow ⟹ initially N-S then bend over • IRAS 4B outflow N-S CO 6-‐5 map of IRAS 4A/4B Yıldız et al., 2012, A&A 12CO Monday, March 4, 13
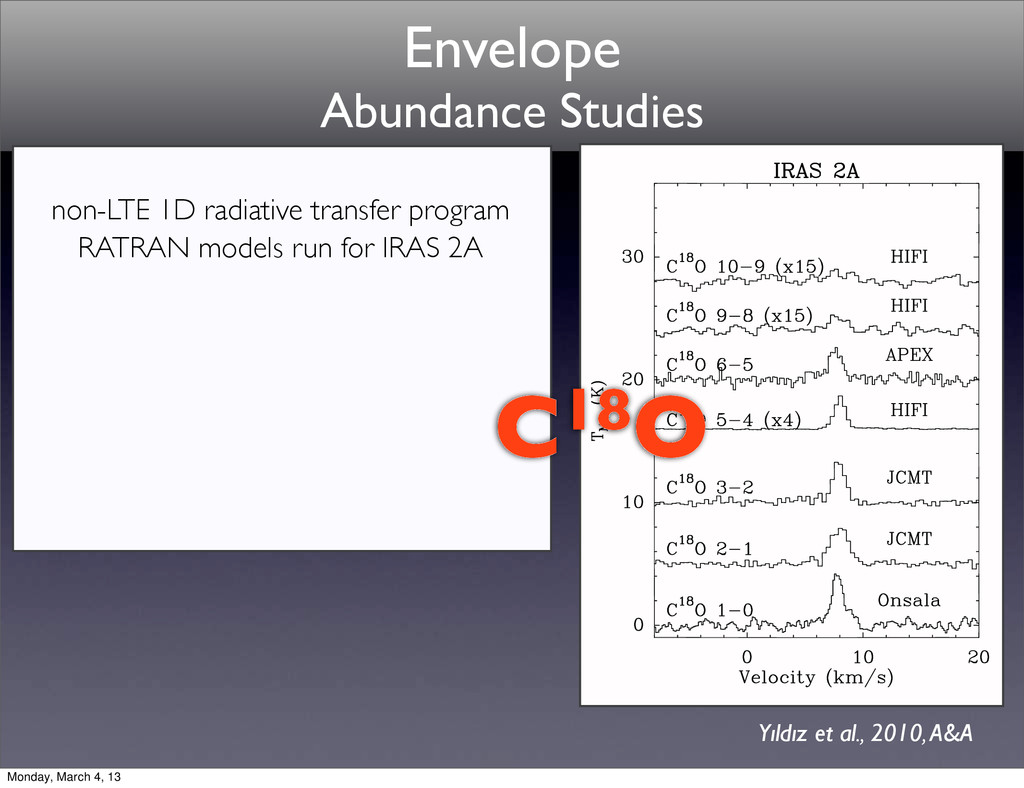
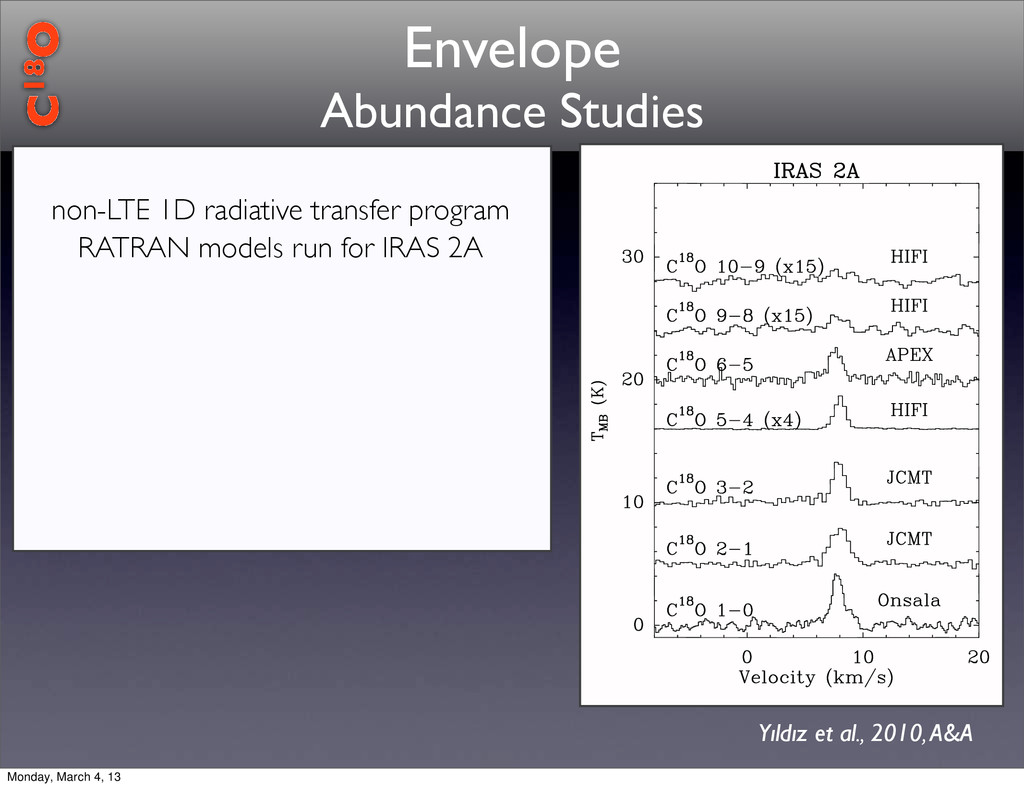
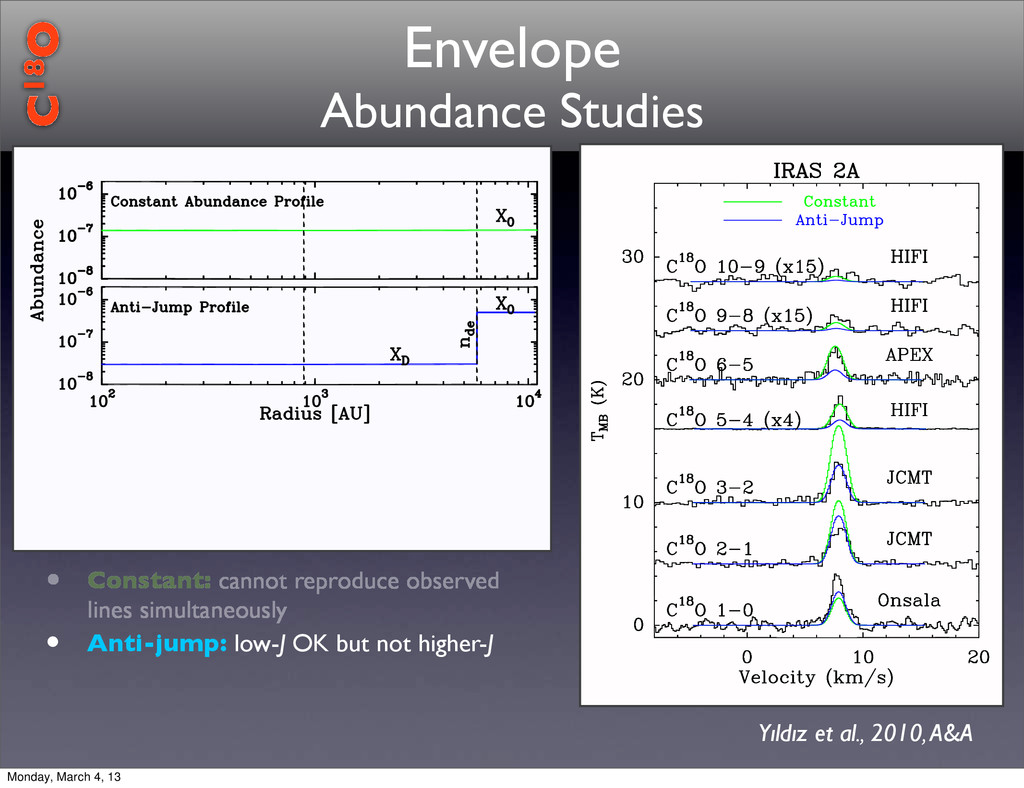
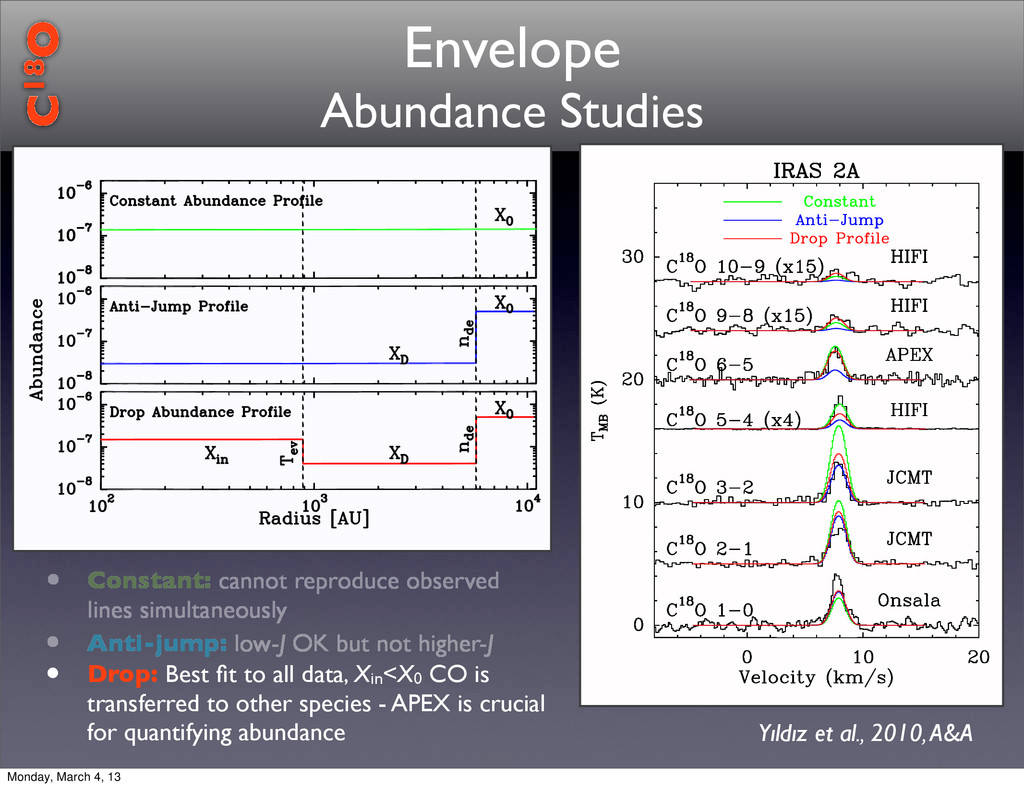
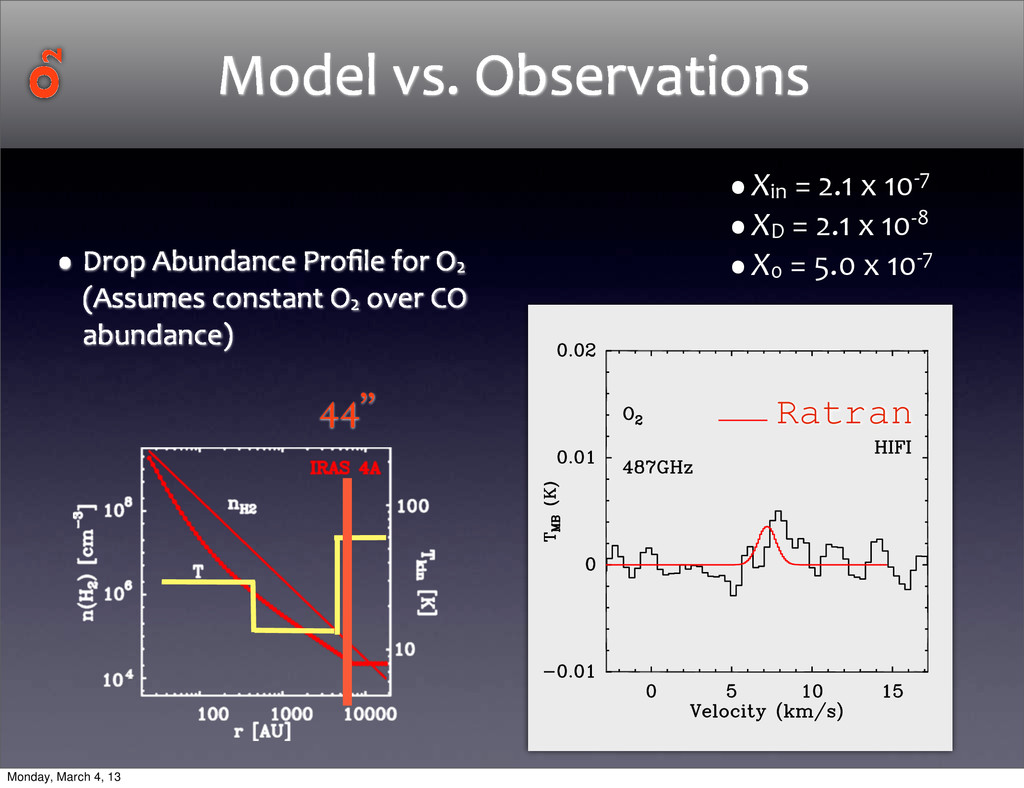
cannot reproduce observed lines simultaneously • Drop: Best fit to all data, Xin<X0 CO is transferred to other species - APEX is crucial for quantifying abundance • Anti-jump: low-J OK but not higher-J C18O Monday, March 4, 13
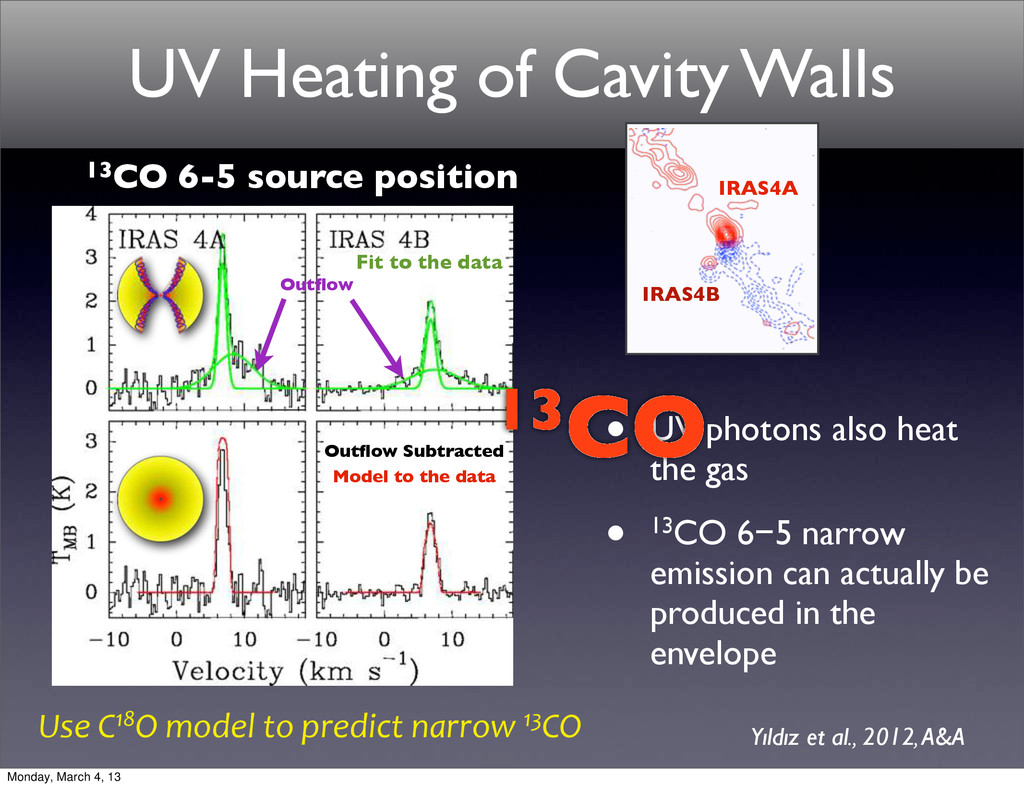
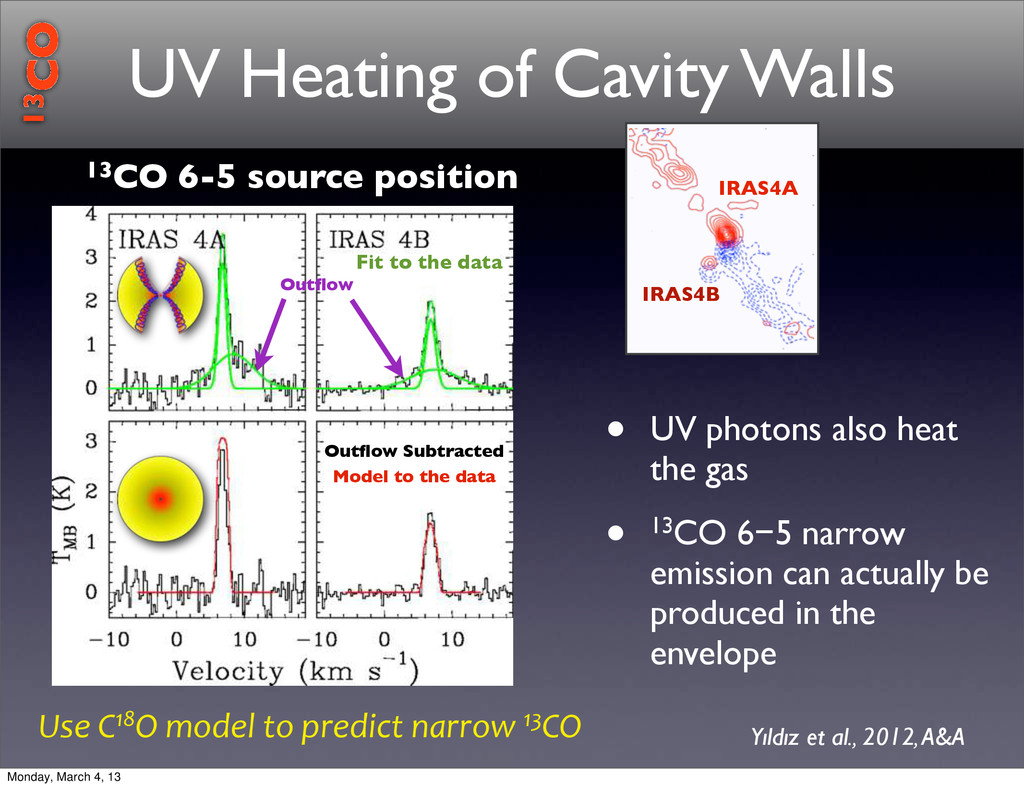
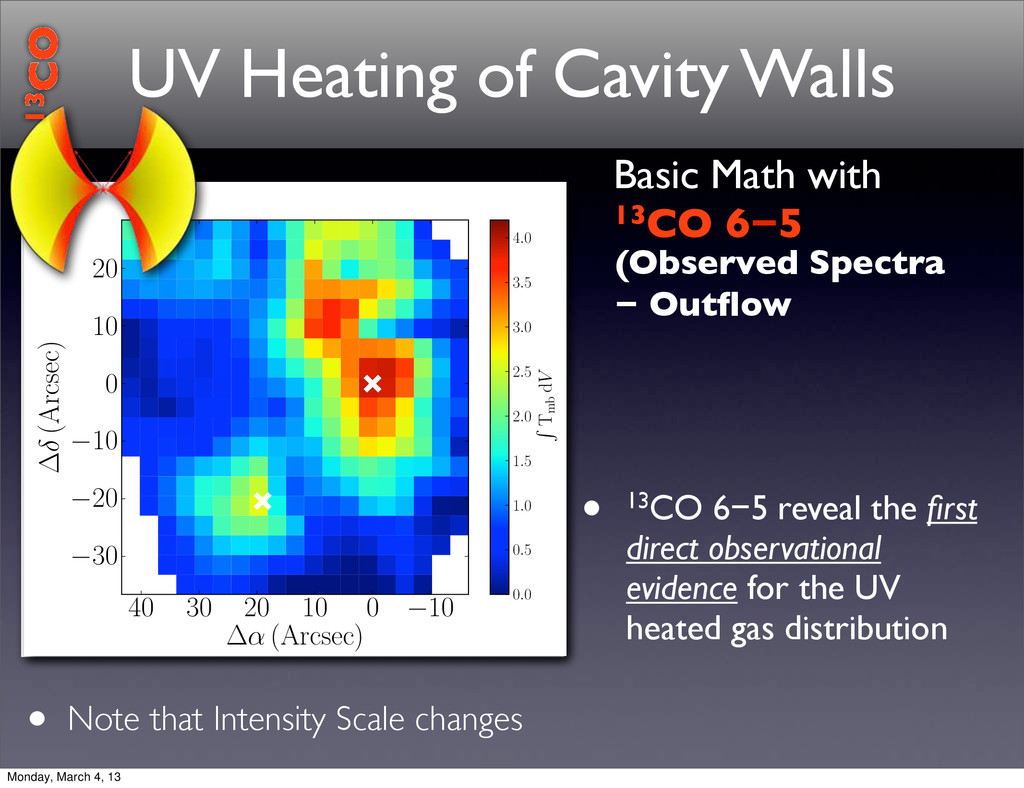
13CO 6-5 source position IRAS4A IRAS4B • UV photons also heat the gas • 13CO 6−5 narrow emission can actually be produced in the envelope Use C18O model to predict narrow 13CO Yıldız et al., 2012, A&A UV Heating of Cavity Walls 13CO Outflow Monday, March 4, 13
13CO 6-5 source position IRAS4A IRAS4B • UV photons also heat the gas • 13CO 6−5 narrow emission can actually be produced in the envelope Use C18O model to predict narrow 13CO Yıldız et al., 2012, A&A UV Heating of Cavity Walls 13CO Outflow Monday, March 4, 13
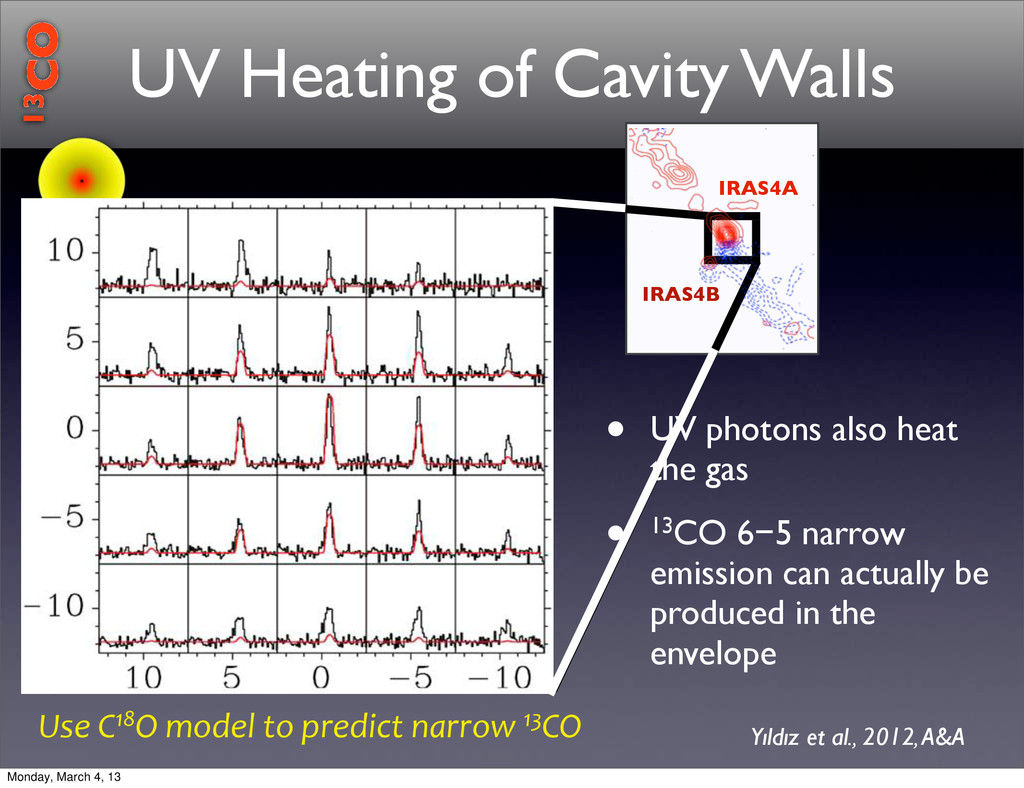
IRAS4A IRAS4B • UV photons also heat the gas • 13CO 6−5 narrow emission can actually be produced in the envelope Use C18O model to predict narrow 13CO Yıldız et al., 2012, A&A UV Heating of Cavity Walls 13CO Outflow Monday, March 4, 13
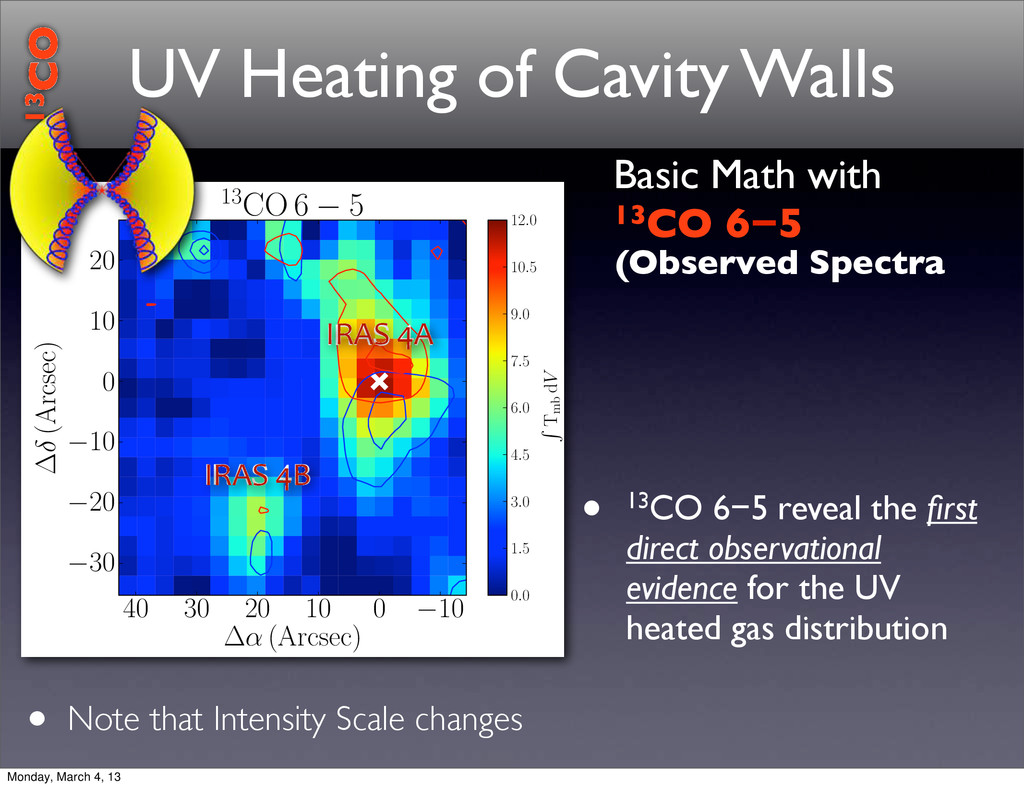
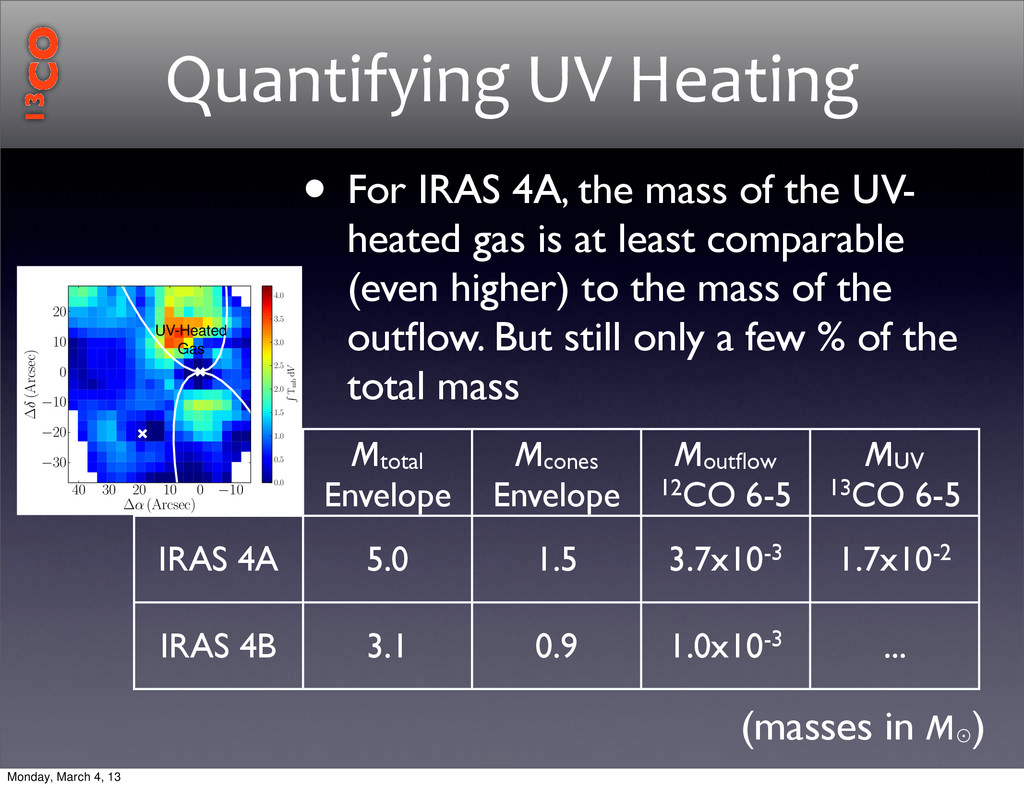
gas is at least comparable (even higher) to the mass of the outflow. But still only a few % of the total mass Mtotal Envelope Mcones Envelope Moutflow 12CO 6-5 MUV 13CO 6-5 IRAS 4A 5.0 1.5 3.7x10⁻³ 1.7x10⁻² IRAS 4B 3.1 0.9 1.0x10⁻³ ... −10 0 10 20 30 40 ∆α (Arcsec) −30 −20 −10 0 10 20 ∆δ (Arcsec) UV-Heated Gas 0.0 0.5 1.0 1.5 2.0 2.5 3.0 3.5 4.0 Tmb dV Quantifying UV Heating (masses in M⊙ ) 13CO Monday, March 4, 13
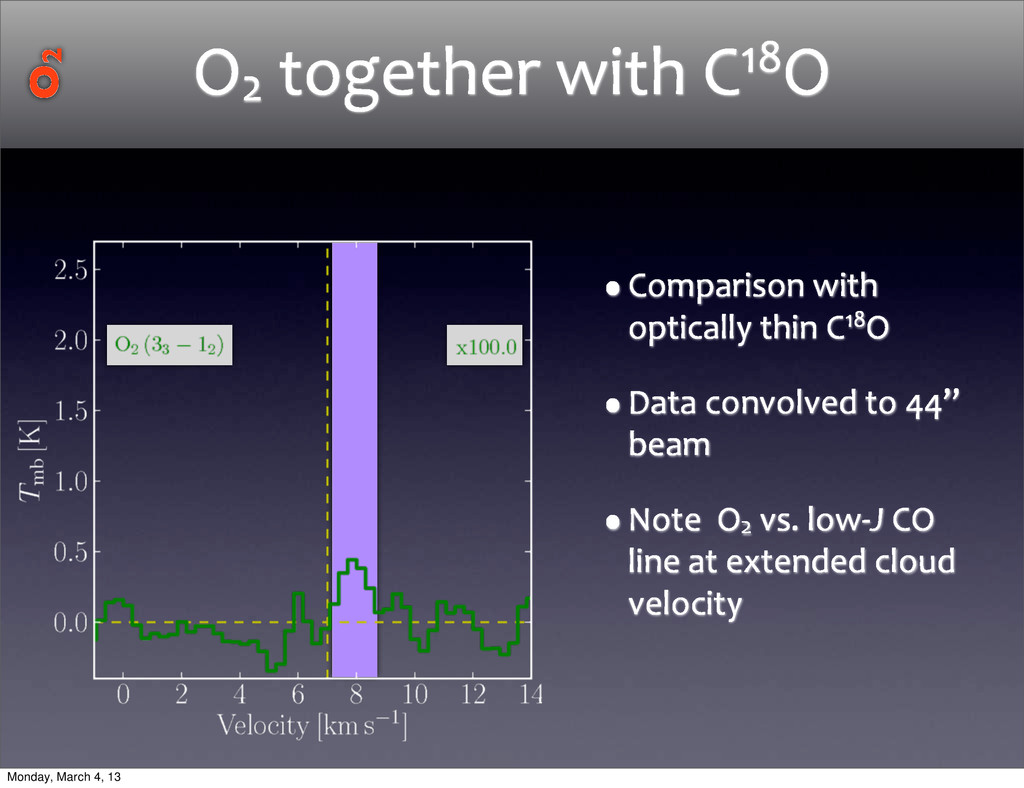
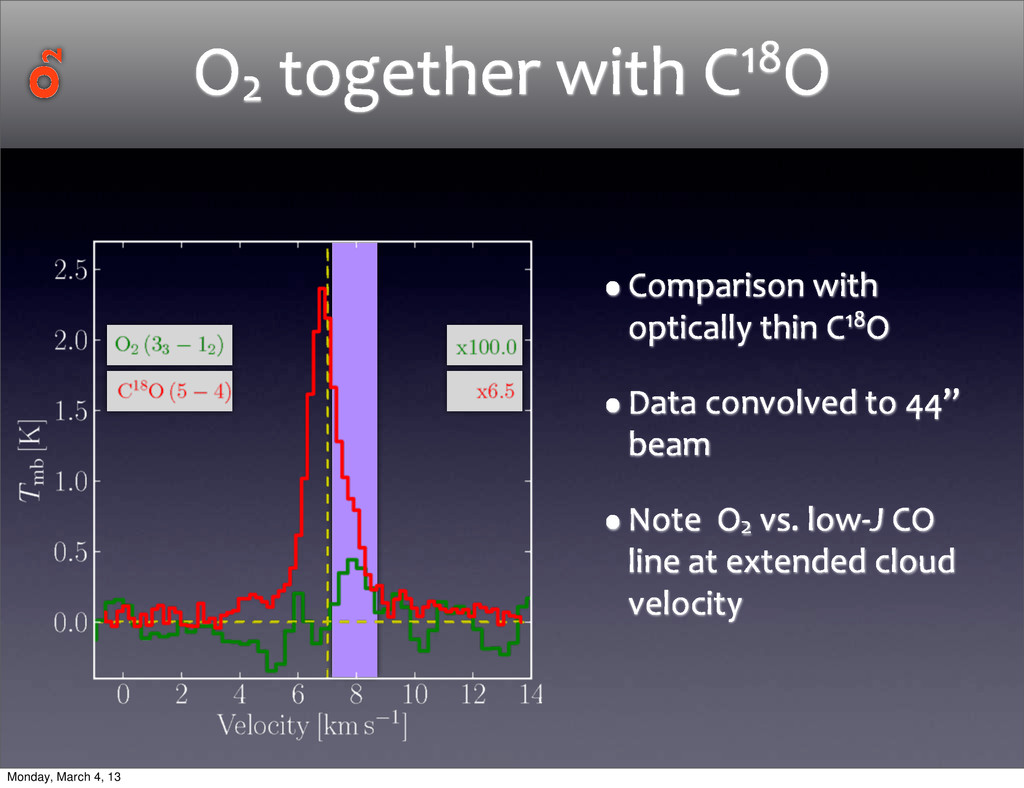
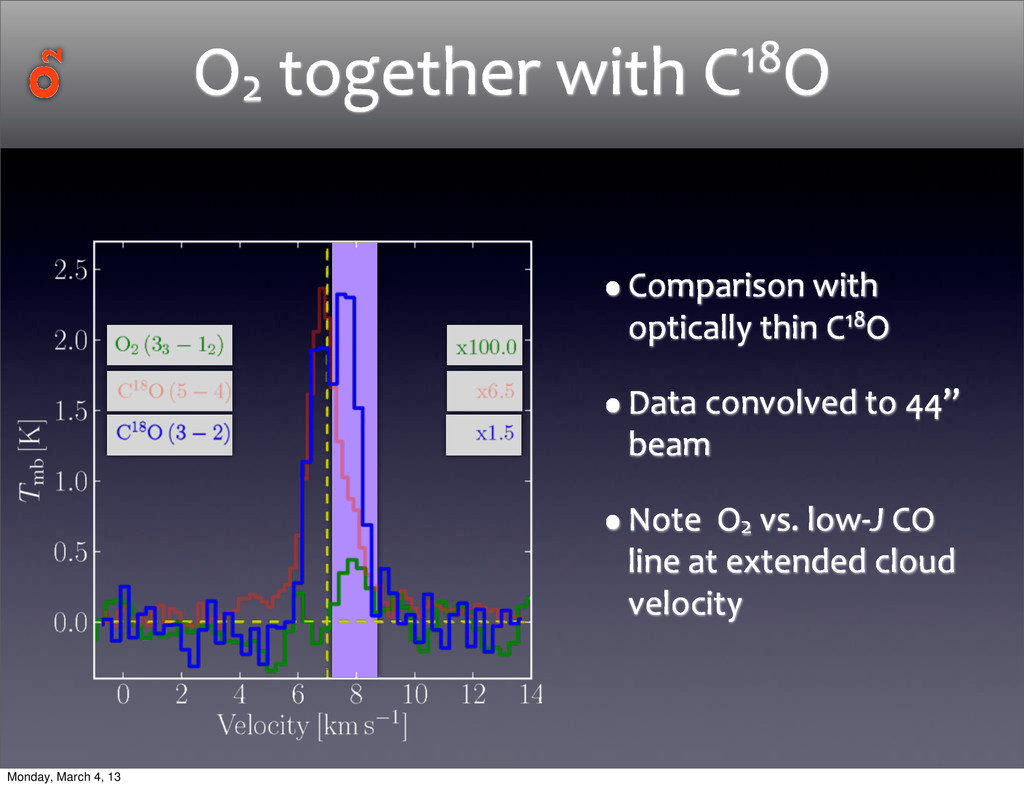
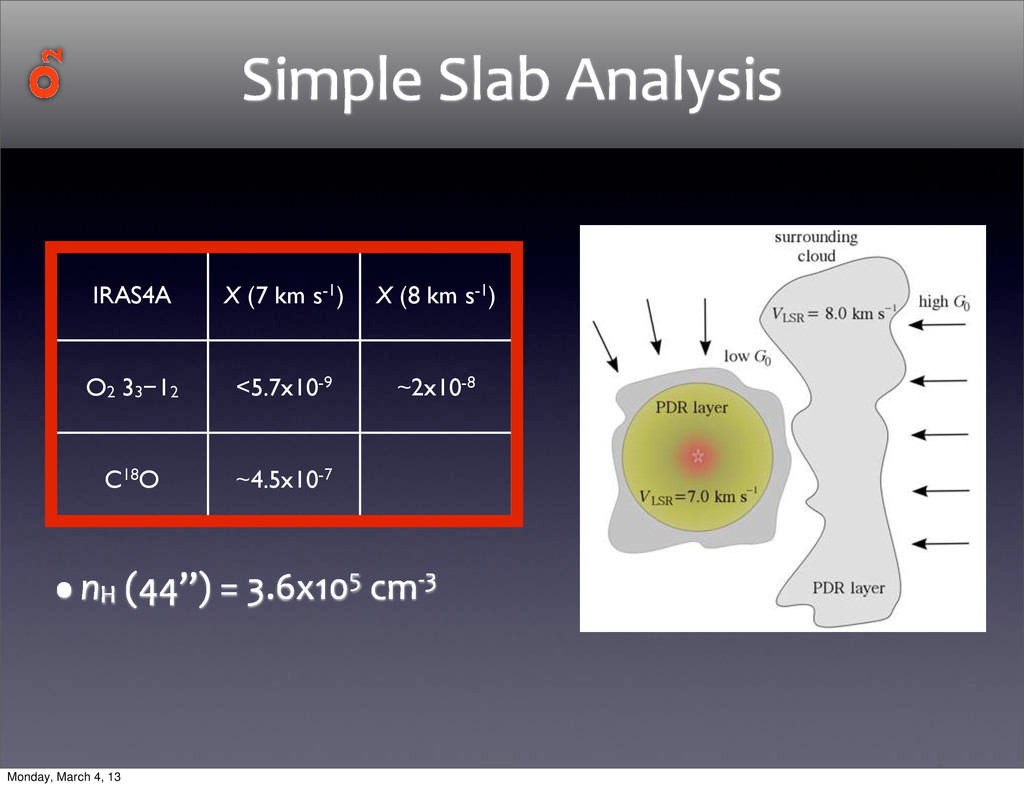
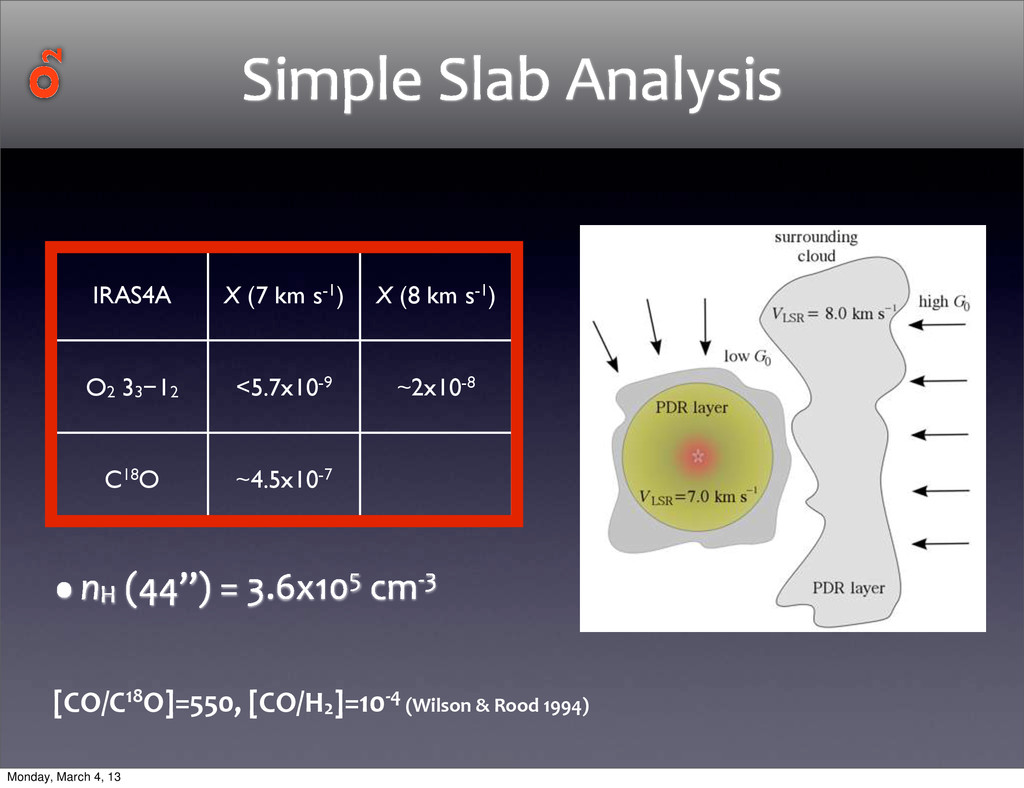
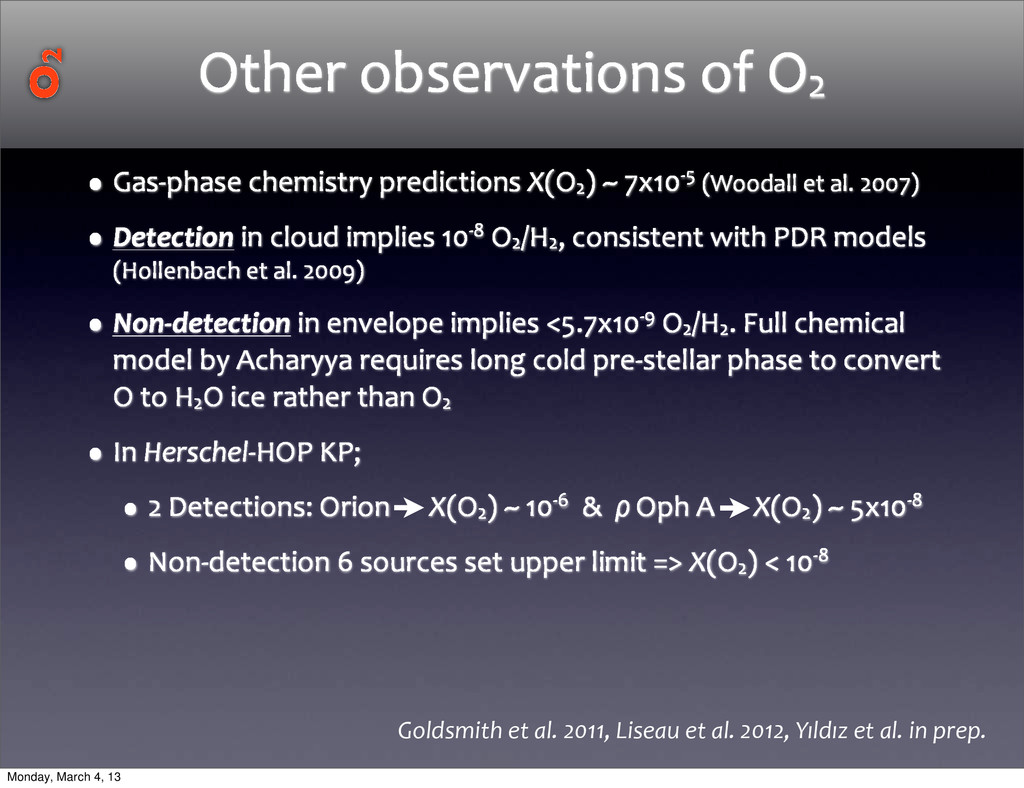
(Woodall et al. 2007) •Detection in cloud implies 10-‐8 O2/H2, consistent with PDR models (Hollenbach et al. 2009) •Non-‐detection in envelope implies <5.7x10-‐9 O2/H2. Full chemical model by Acharyya requires long cold pre-‐stellar phase to convert O to H2O ice rather than O2 •In Herschel-‐HOP KP; •2 Detections: Orion X(O2) ~ 10-‐6 & ρ Oph A X(O2) ~ 5x10-‐8 •Non-‐detection 6 sources set upper limit => X(O2) < 10-‐8 Goldsmith et al. 2011, Liseau et al. 2012, Yıldız et al. in prep. O2 Monday, March 4, 13
(Woodall et al. 2007) •Detection in cloud implies 10-‐8 O2/H2, consistent with PDR models (Hollenbach et al. 2009) •Non-‐detection in envelope implies <5.7x10-‐9 O2/H2. Full chemical model by Acharyya requires long cold pre-‐stellar phase to convert O to H2O ice rather than O2 •In Herschel-‐HOP KP; •2 Detections: Orion X(O2) ~ 10-‐6 & ρ Oph A X(O2) ~ 5x10-‐8 •Non-‐detection 6 sources set upper limit => X(O2) < 10-‐8 Goldsmith et al. 2011, Liseau et al. 2012, Yıldız et al. in prep. O2 IRAS 4A abundance is the lowest limit found to date => X(O2)<5.7x10-‐9 Monday, March 4, 13
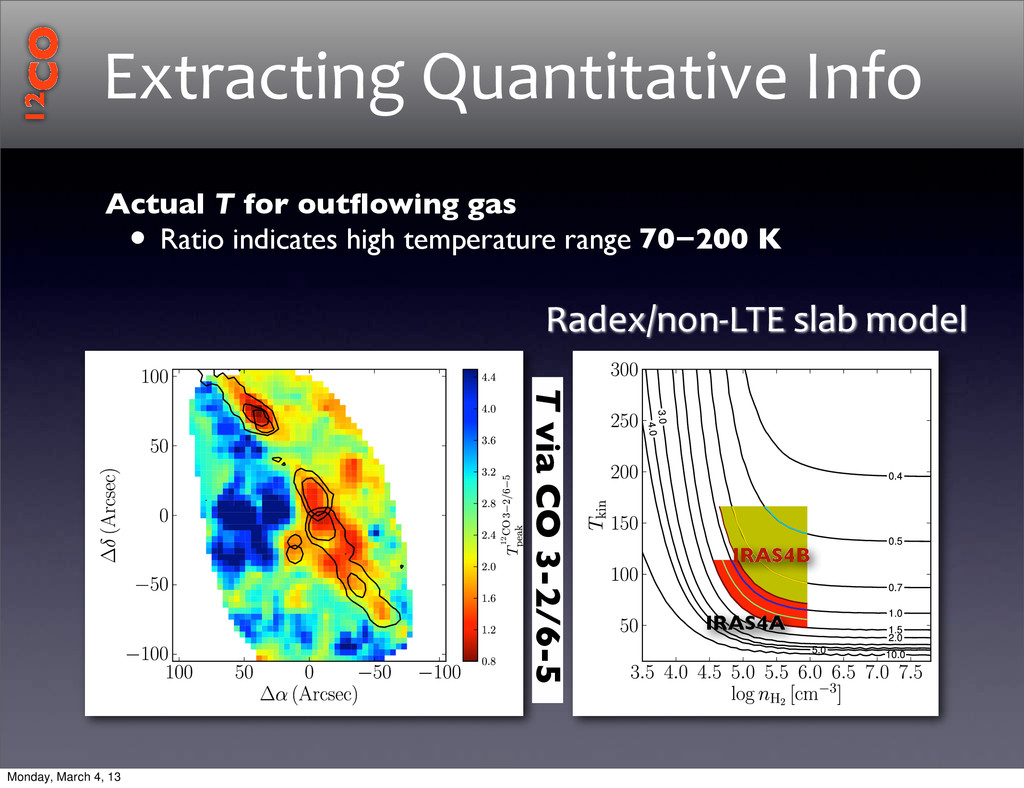
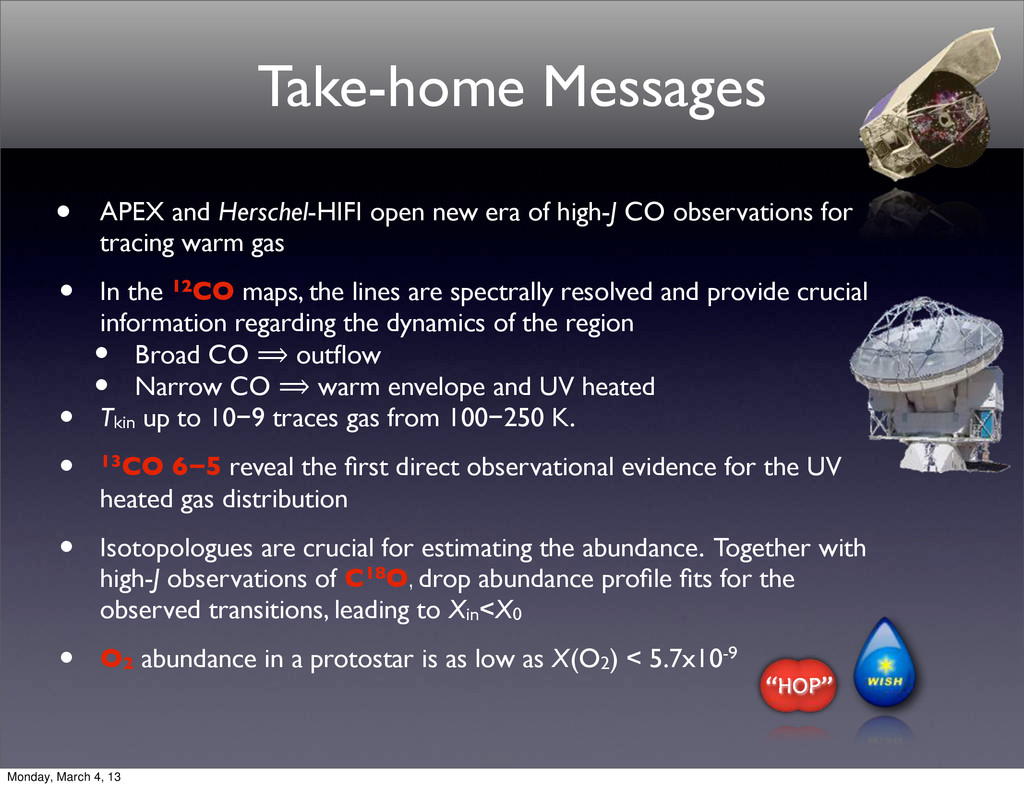
high-J CO observations for tracing warm gas • In the 12CO maps, the lines are spectrally resolved and provide crucial information regarding the dynamics of the region • Broad CO ⟹ outflow • Narrow CO ⟹ warm envelope and UV heated • Tkin up to 10−9 traces gas from 100−250 K. • 13CO 6−5 reveal the first direct observational evidence for the UV heated gas distribution • Isotopologues are crucial for estimating the abundance. Together with high-J observations of C18O, drop abundance profile fits for the observed transitions, leading to Xin<X0 • O2 abundance in a protostar is as low as X(O2) < 5.7x10⁻⁹ “HOP” Monday, March 4, 13
![40 50 60 70 80 90 100 110 120 Tex(12CO)[K]](https://files.speakerdeck.com/presentations/4f105356559b4241a5ef2e13663a0347/slide_19.jpg)