Umut Yildiz Ewine van Dishoeck, Lars E. Kristensen Tim van Kempen, Arnoud Belloche, Rolf Gusten WISH Team Meeting, Nov 23, 2#9, Leiden Sunday, April 10, 2011
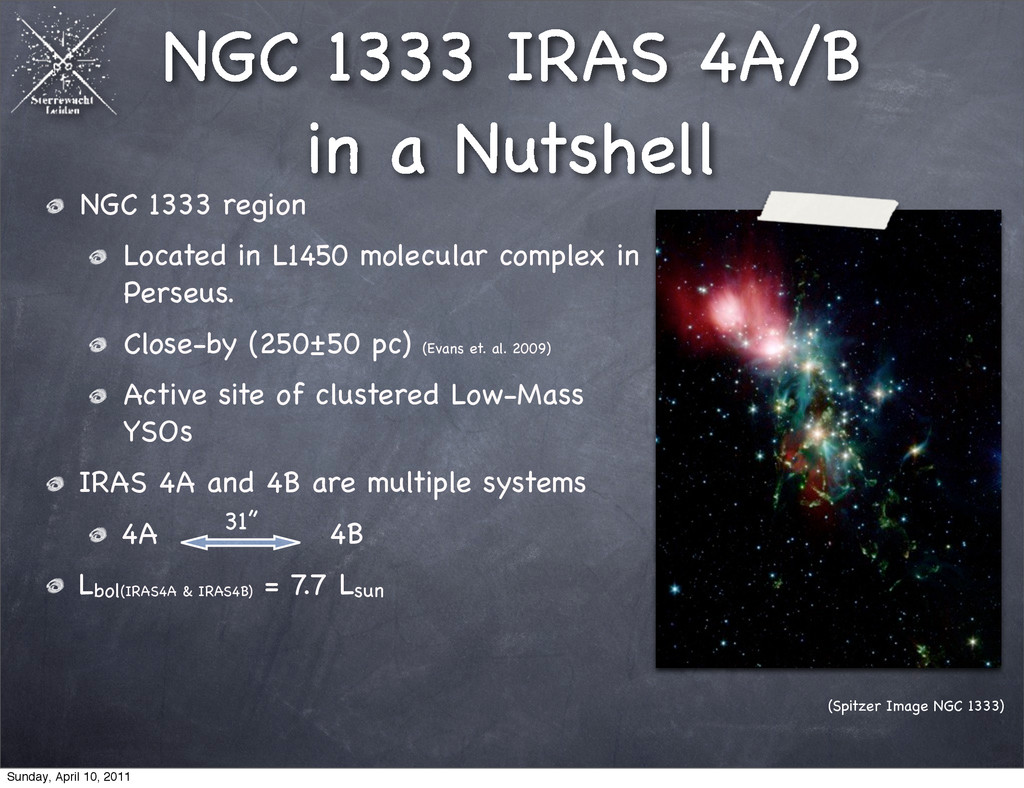
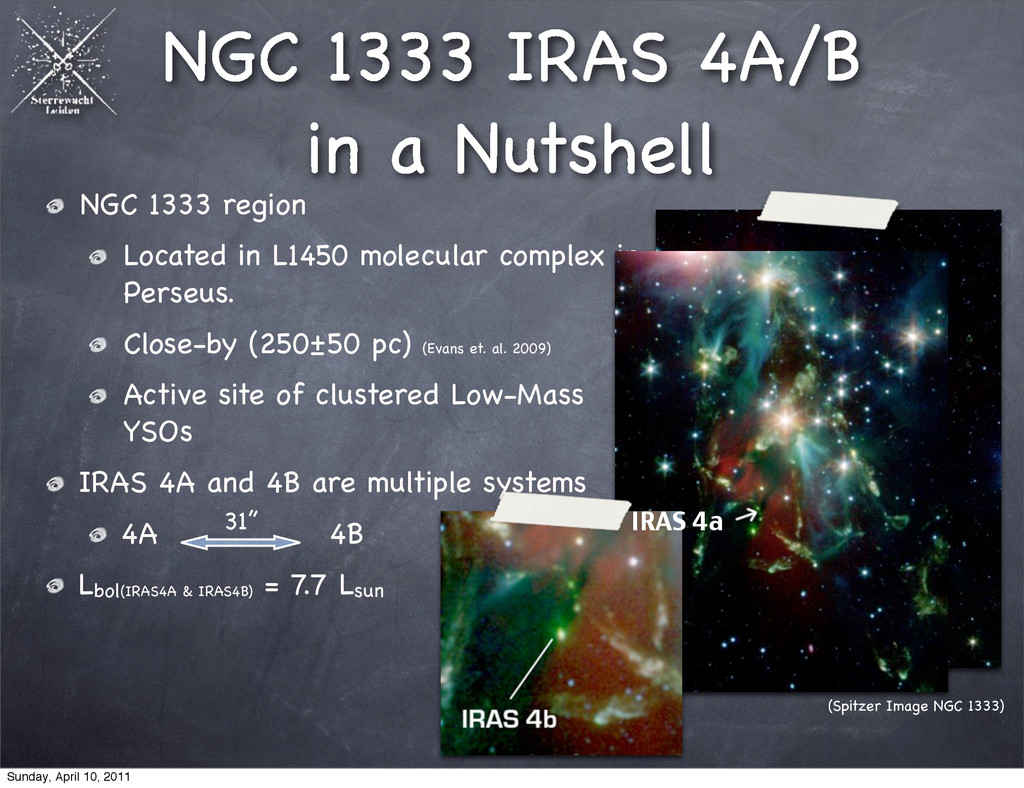
Located in L1450 molecular complex in Perseus. Close-by (250±50 pc) (Evans et. al. 2009) Active site of clustered Low-Mass YSOs IRAS 4A and 4B are multiple systems 4A 4B Lbol(IRAS4A & IRAS4B) = 7.7 Lsun 31” (Spitzer Image NGC 1333) Sunday, April 10, 2011
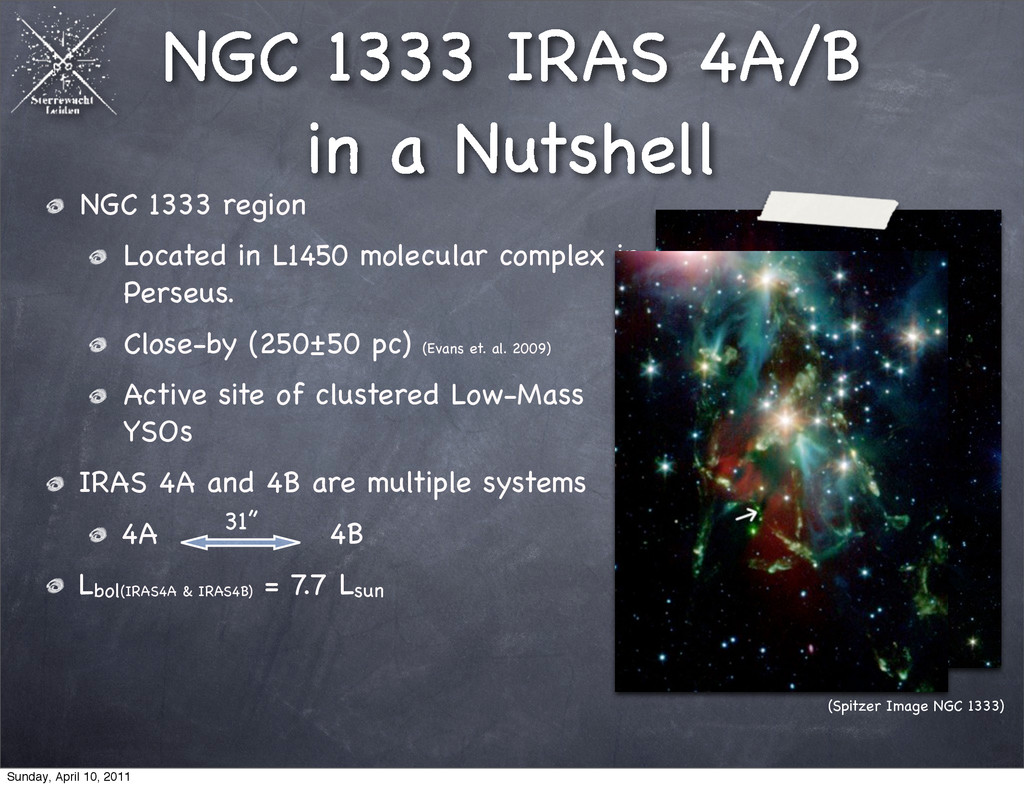
Located in L1450 molecular complex in Perseus. Close-by (250±50 pc) (Evans et. al. 2009) Active site of clustered Low-Mass YSOs IRAS 4A and 4B are multiple systems 4A 4B Lbol(IRAS4A & IRAS4B) = 7.7 Lsun 31” (Spitzer Image NGC 1333) Sunday, April 10, 2011
Located in L1450 molecular complex in Perseus. Close-by (250±50 pc) (Evans et. al. 2009) Active site of clustered Low-Mass YSOs IRAS 4A and 4B are multiple systems 4A 4B Lbol(IRAS4A & IRAS4B) = 7.7 Lsun 31” (Spitzer Image NGC 1333) Sunday, April 10, 2011
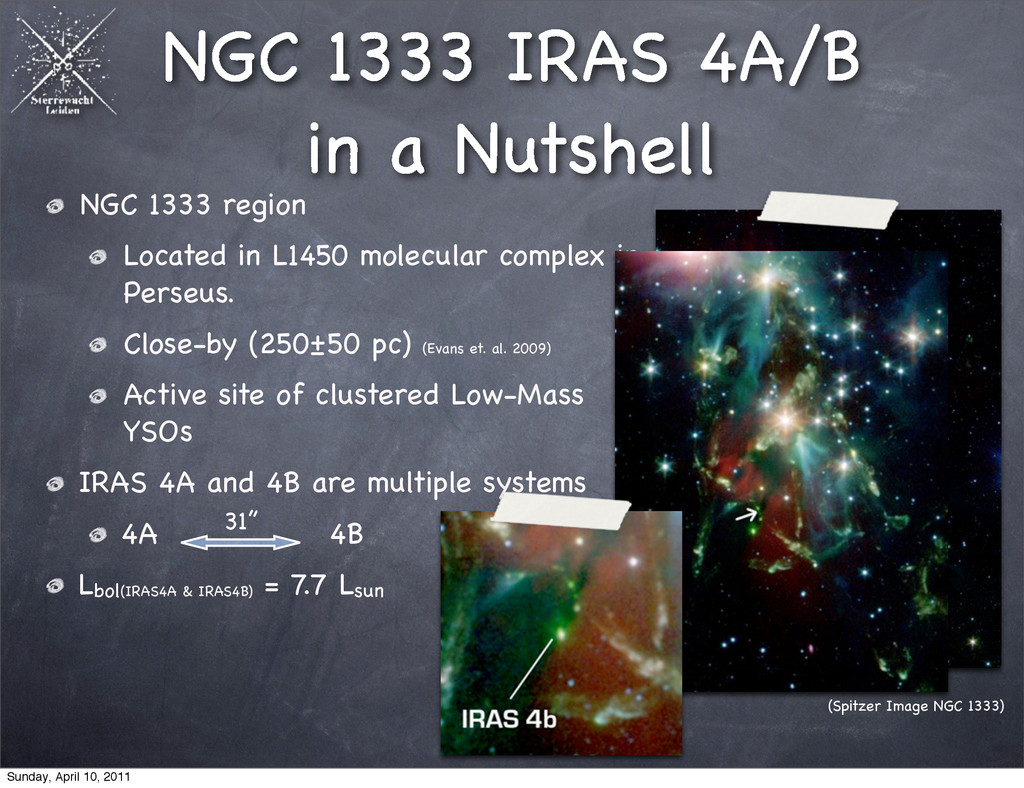
Located in L1450 molecular complex in Perseus. Close-by (250±50 pc) (Evans et. al. 2009) Active site of clustered Low-Mass YSOs IRAS 4A and 4B are multiple systems 4A 4B Lbol(IRAS4A & IRAS4B) = 7.7 Lsun 31” IRAS 4a (Spitzer Image NGC 1333) Sunday, April 10, 2011
and dust around protostars (so that low-J and lower energies). Trace warm gas by high-J CO observations To understand how CO is excited, is it due to shock or UV heating? Sunday, April 10, 2011
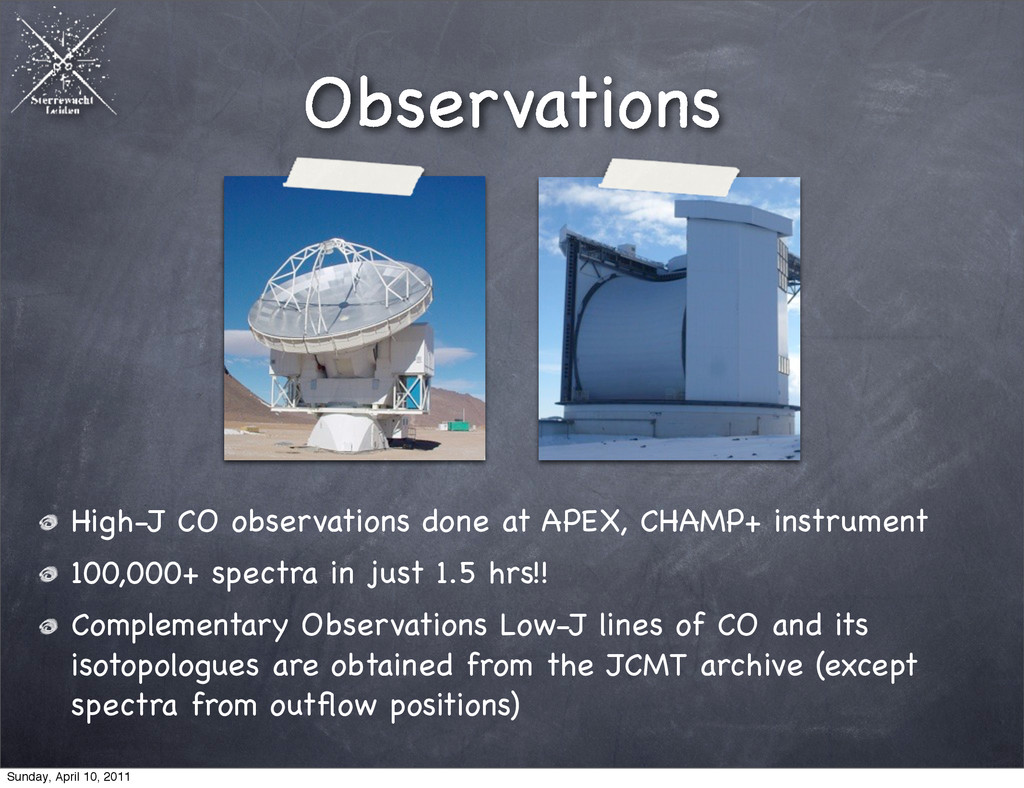
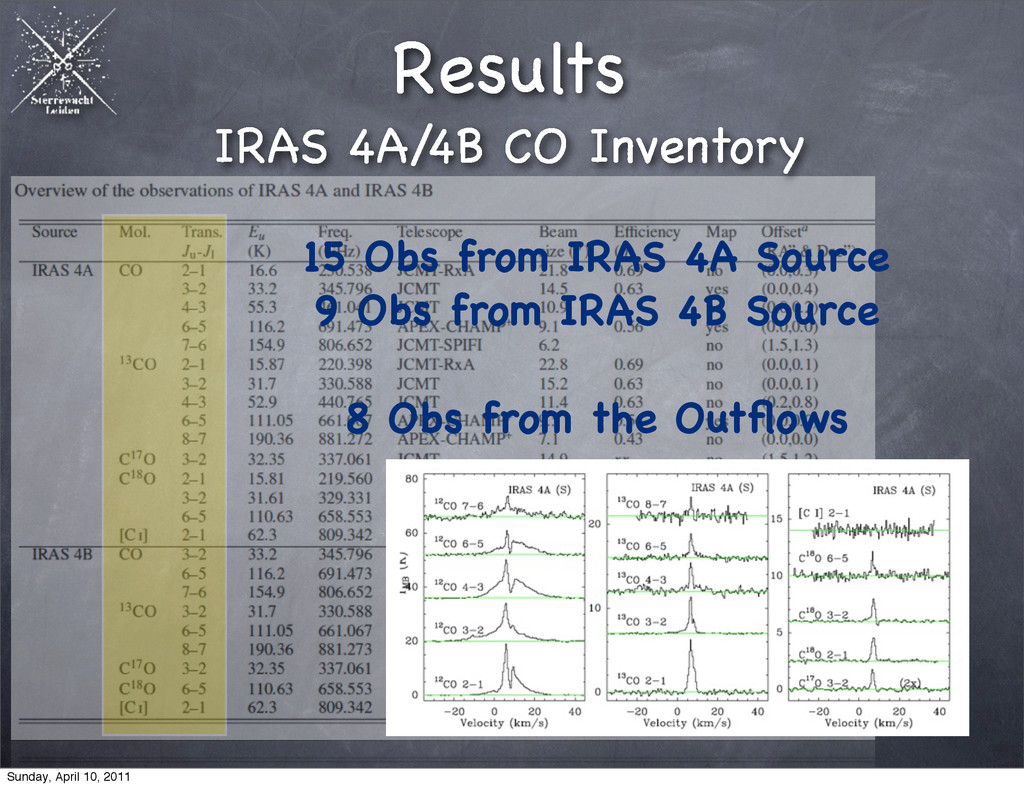
spectra in just 1.5 hrs!! Complementary Observations Low-J lines of CO and its isotopologues are obtained from the JCMT archive (except spectra from outflow positions) Sunday, April 10, 2011
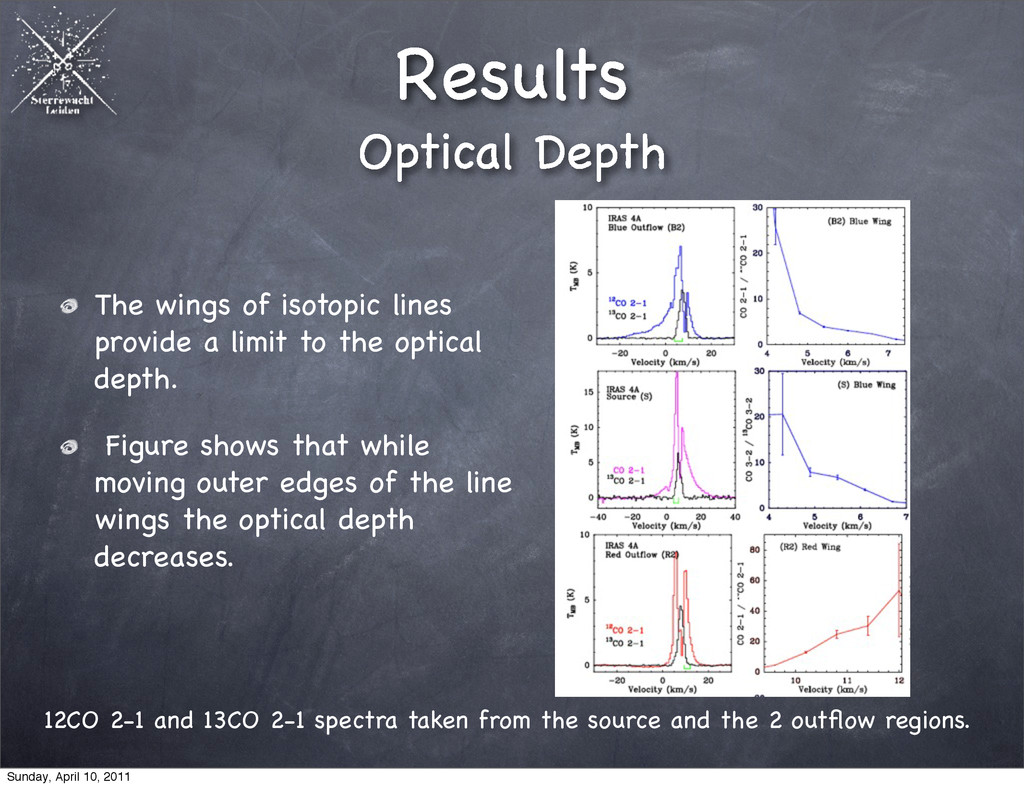
optical depth. Figure shows that while moving outer edges of the line wings the optical depth decreases. 12CO 2-1 and 13CO 2-1 spectra taken from the source and the 2 outflow regions. Results Optical Depth Sunday, April 10, 2011
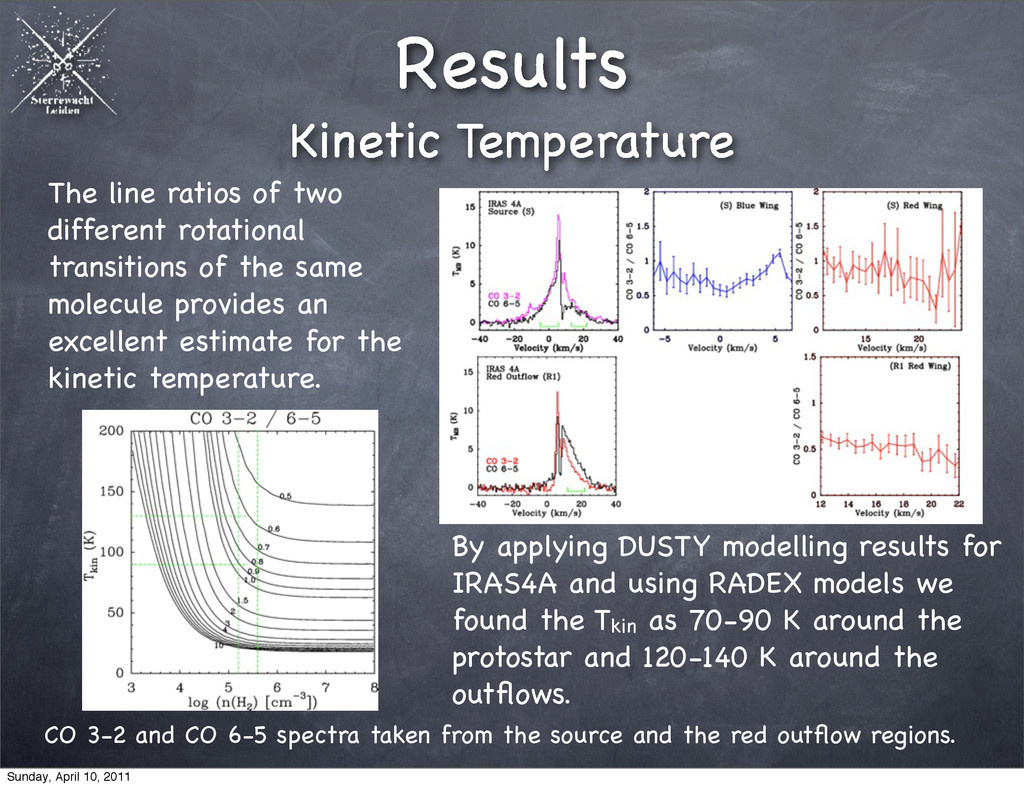
and the red outflow regions. By applying DUSTY modelling results for IRAS4A and using RADEX models we found the Tkin as 70-90 K around the protostar and 120-140 K around the outflows. Results Kinetic Temperature The line ratios of two different rotational transitions of the same molecule provides an excellent estimate for the kinetic temperature. Sunday, April 10, 2011
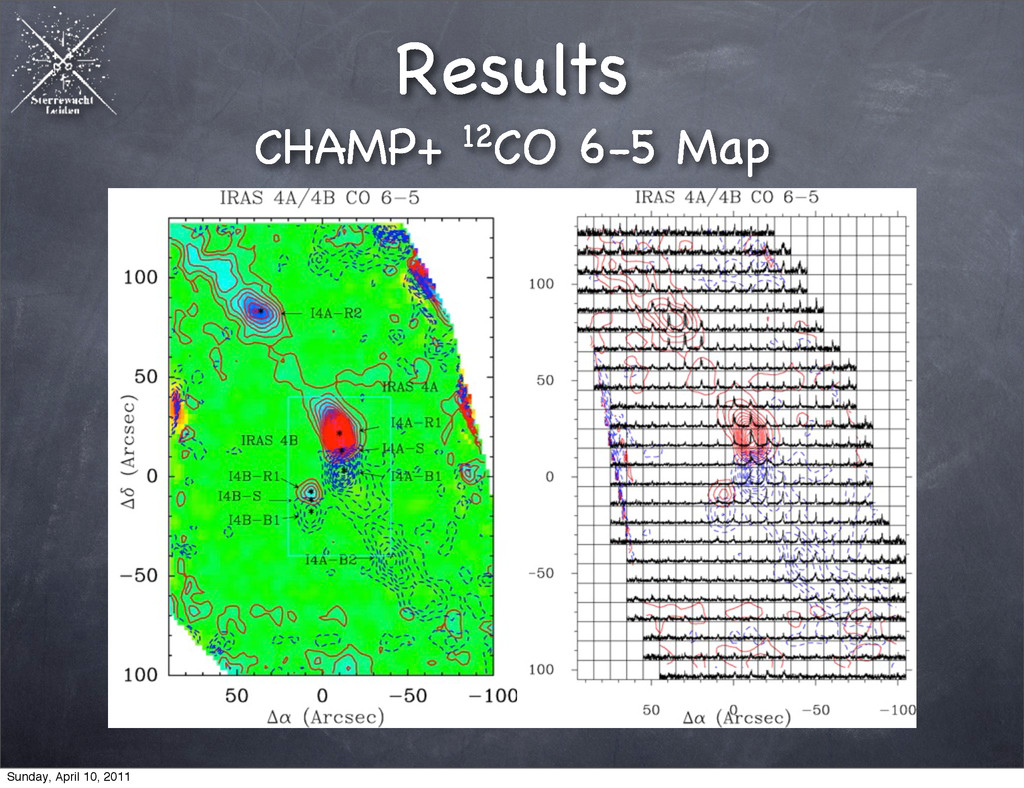
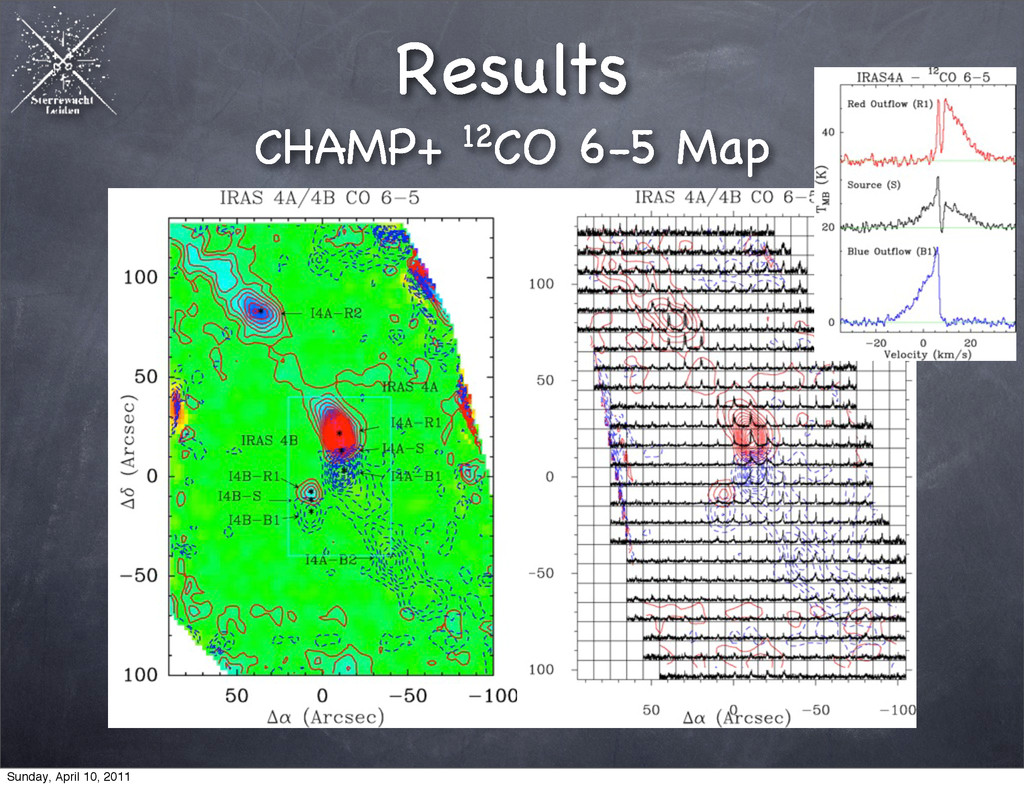
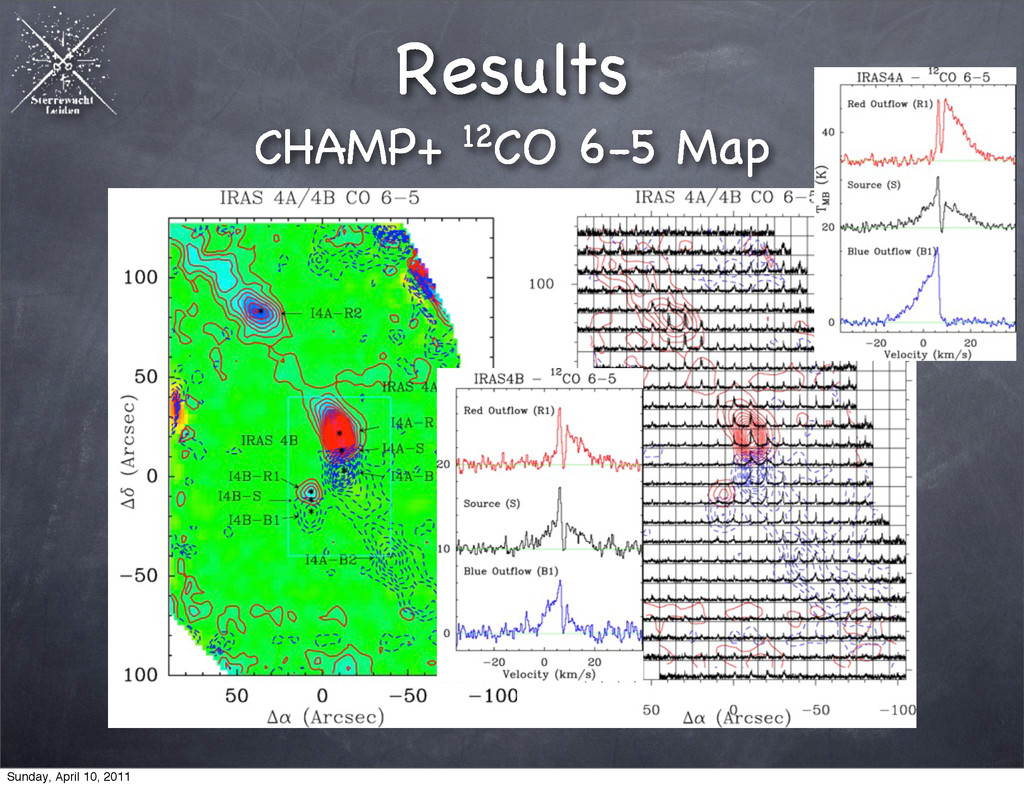
map of embedded protostars IRAS 4A and IRAS 4B. In the 12CO map, the lines are spectrally resolved and provide crucial information regarding the dynamics of the region. Our observations allow us to trace and reveal effects of shock and UV heating. Broad CO emission line profiles trace shock excited gas along the outflow axis. Surrounding the outflow and the protostar, the line profiles are narrow indicating UV heating. Sunday, April 10, 2011