Upgrade to Pro — share decks privately, control downloads, hide ads and more …

Maximizing Logstash Performance

Maximizing Logstash Performance

Presentation at OpenWest 2017, accompanied by live demonstrations at the command-line and in Kibana.

Aaron Mildenstein

July 14, 2017
Tweet

More Decks by Aaron Mildenstein

Other Decks in Programming

Transcript

  1. Optimizing Logstash
    Performance
    There's more than one way to parse a log...

    View Slide

  2. Define the problem
    • Logstash is perceived as slow

    • No insight into performance bottlenecks

    • No idea how to gain insight

    View Slide

  3. Logstash?
    Data In Data Out

    View Slide

  4. Have no fear!
    Let's shine a light in there

    View Slide

  5. Rule #1

    View Slide

  6. –Jordan Sissel, creator of Logstash...and grok.
    “If you have to use grok, you've already lost.”

    View Slide

  7. Toolset 1
    • generator input plugin

    • dots codec

    • pipe viewer (pv)

    View Slide

  8. Generator
    input {
    generator {
    lines => [
    'line1',
    'line2',
    ...
    'lineN',
    ]
    count => 123456
    }
    }

    View Slide

  9. dots codec
    output {
    stdout {
    codec => dots
    }
    }

    View Slide

  10. pv
    -r, --rate show data transfer rate counter
    -W, --wait display nothing until first byte transferred
    $ bin/logstash -f mytest.conf | pv -Wr > /dev/null
    [42.0KiB/s]

    View Slide

  11. –No one, Ever
    “I like waiting!”

    View Slide

  12. Toolset 2
    • Elasticsearch, Logstash, & Kibana (+ X-Pack)

    • Configure Logstash to send monitoring data

    • View in Kibana

    View Slide

  13. X-Pack
    $ bin/elasticsearch-plugin install x-pack
    $ bin/kibana-plugin install x-pack
    $ bin/logstash-plugin install x-pack

    View Slide

  14. Configure Kibana
    vi config/kibana.yml
    # If your Elasticsearch is protected 
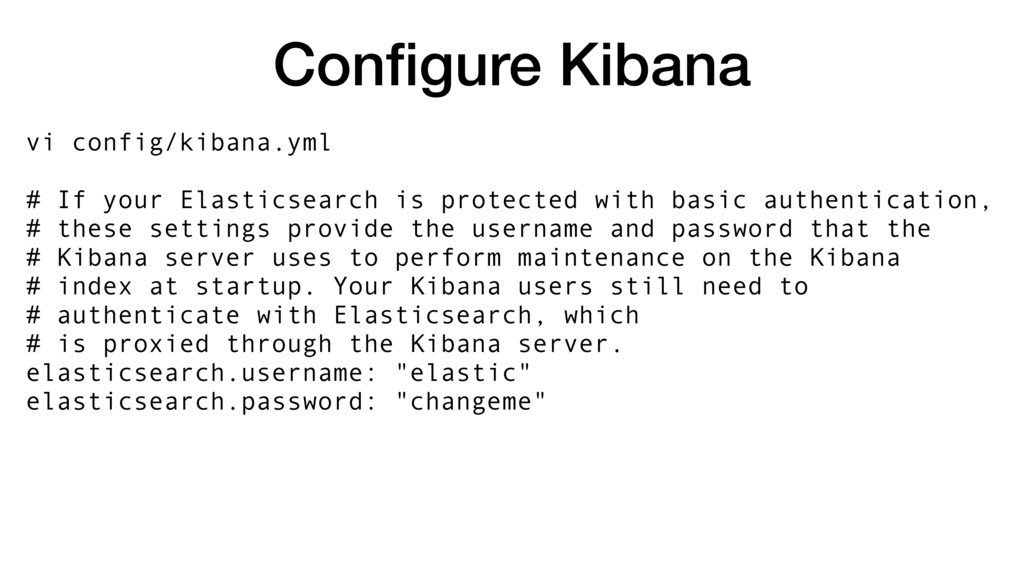
with basic authentication,
    # these settings provide the username and password that the
    # Kibana server uses to perform maintenance on the Kibana
    # index at startup. Your Kibana users still need to
    # authenticate with Elasticsearch, which
    # is proxied through the Kibana server.
    elasticsearch.username: "elastic"
    elasticsearch.password: "changeme"

    View Slide

  15. Configure Logstash
    vi config/logstash.yml
    # Periodically check if the configuration 
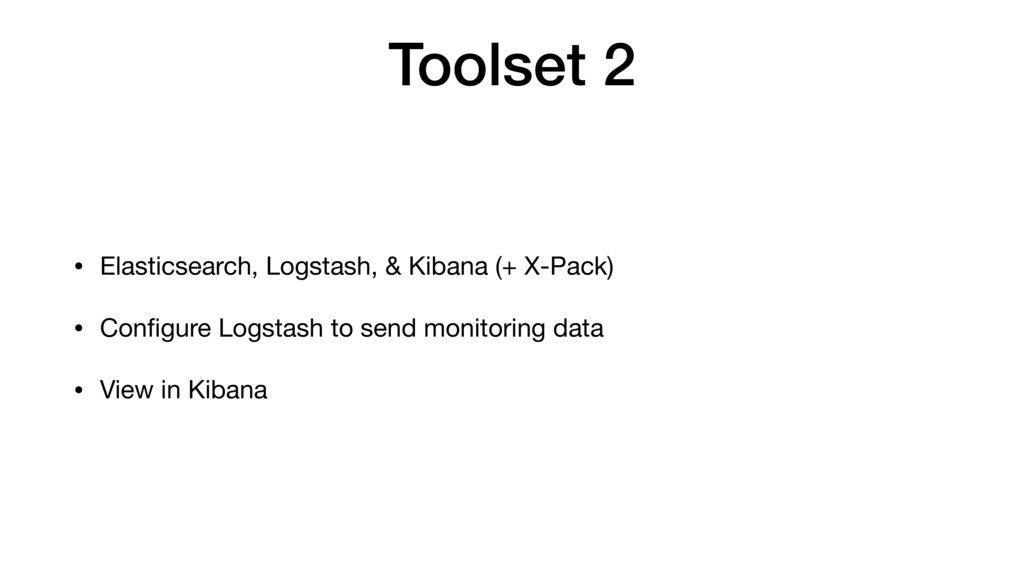
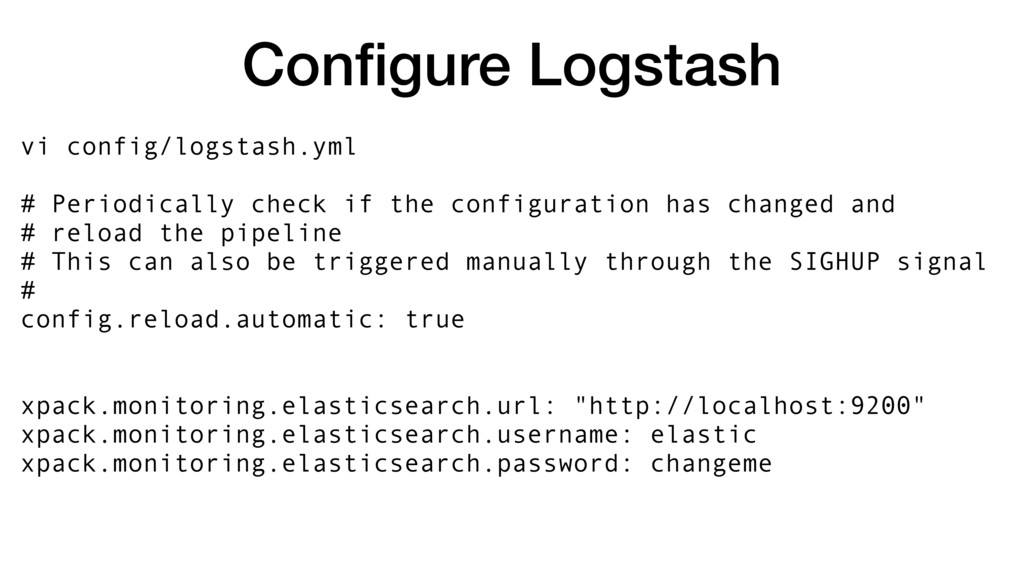
has changed and
    # reload the pipeline
    # This can also be triggered manually through the SIGHUP signal
    #
    config.reload.automatic: true
    xpack.monitoring.elasticsearch.url: "http://localhost:9200"
    xpack.monitoring.elasticsearch.username: elastic
    xpack.monitoring.elasticsearch.password: changeme

    View Slide

  16. Ready for Launch
    • Start Elasticsearch

    • Start Kibana

    • Navigate to Monitoring page

    View Slide

  17. Logstash is a Pipeline
    In case I neglected to mention it

    View Slide

  18. Pipeline Truths
    • At most, Logstash can only move data 
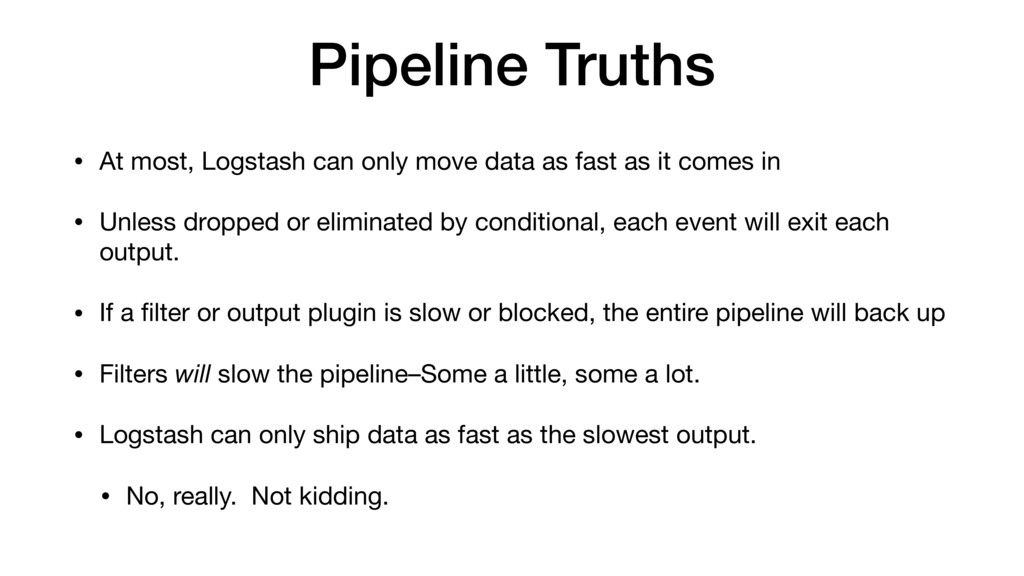
as fast as it comes in

    • Unless dropped or eliminated by conditional, each event will exit each
    output.

    • If a filter or output plugin is slow or blocked, the entire pipeline will back up

    • Filters will slow the pipeline–Some a little, some a lot.

    • Logstash can only ship data as fast as the slowest output.

    • No, really. Not kidding.

    View Slide

  19. Consider the following...
    output {
    plugin1 {...}
    plugin2 {...}
    plugin3 {...}
    }

    View Slide

  20. Improving performance
    • Use brokers

    • Parallel pipelines

    • Staged pipelines

    View Slide

  21. Parallel pipeline example
    input {...}
    filter {# NONE}
    output {
    redis {...}
    }
    redis
    input { redis {...} }
    filter { # all }
    output {
    plugin1 {...}
    }
    input { redis {...} }
    filter { # all }
    output {
    plugin1 {...}
    }
    input { redis {...} }
    filter { # all }
    output {
    plugin1 {...}
    }

    View Slide

  22. Staged pipeline example
    output {
    elasticsearch {...}
    redis {...}
    }
    ES
    redis
    input { redis {...} }
    output {
    slow_output {...}
    }

    View Slide

  23. Other potential bottlenecks
    • Persistent Queues

    • Conditionals

    • Especially if you're doing regular expressions in them

    View Slide

  24. Future methods
    • Multiple pipelines from 1 JVM

    • Definable 
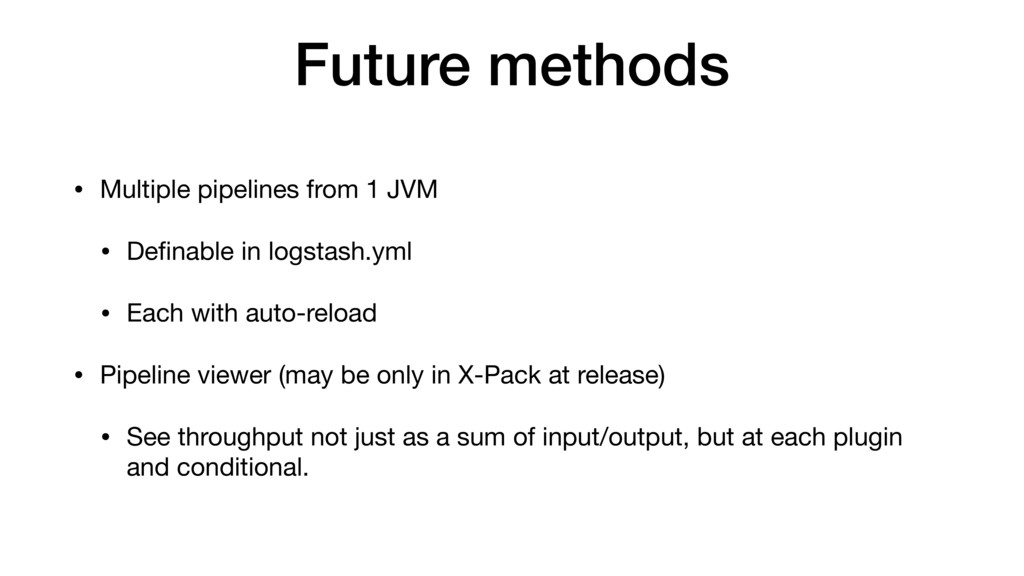
in logstash.yml

    • Each with auto-reload

    • Pipeline viewer (may be only in X-Pack at release)

    • See throughput not just as a sum of input/output, but at each plugin
    and conditional.

    View Slide

  25. Conclusion
    • If you can't measure it, you can't improve 
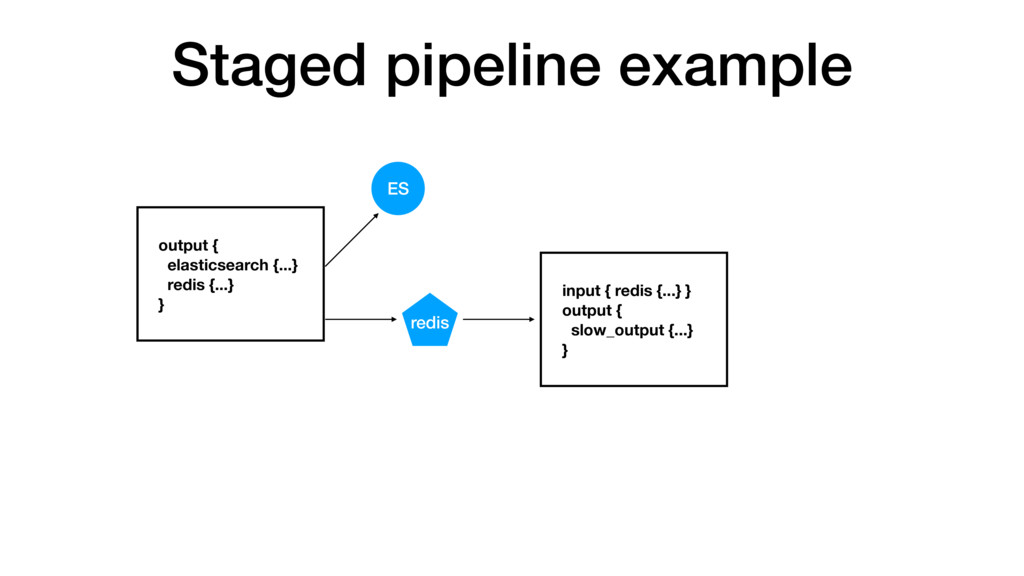
it, so monitor it. A lot.

    • Use grok and regular expressions...

    • ...as sparingly as possible

    • Don't put all of your pipeline eggs in one basket...

    • ...unless you've measured it and it meets your expectations

    • Parallelize and stage your pipeline with brokers FTW

    View Slide

  26. Resources
    • https://www.elastic.co/guide/en/logstash/current/performance-
    troubleshooting.html

    • https://www.elastic.co/guide/en/logstash/current/tuning-logstash.html

    View Slide