An approach to managing and tuning Elasticsearch and Logstash. Explains why the answers aren't cut and dried, and how to assess the specific needs of your cluster.
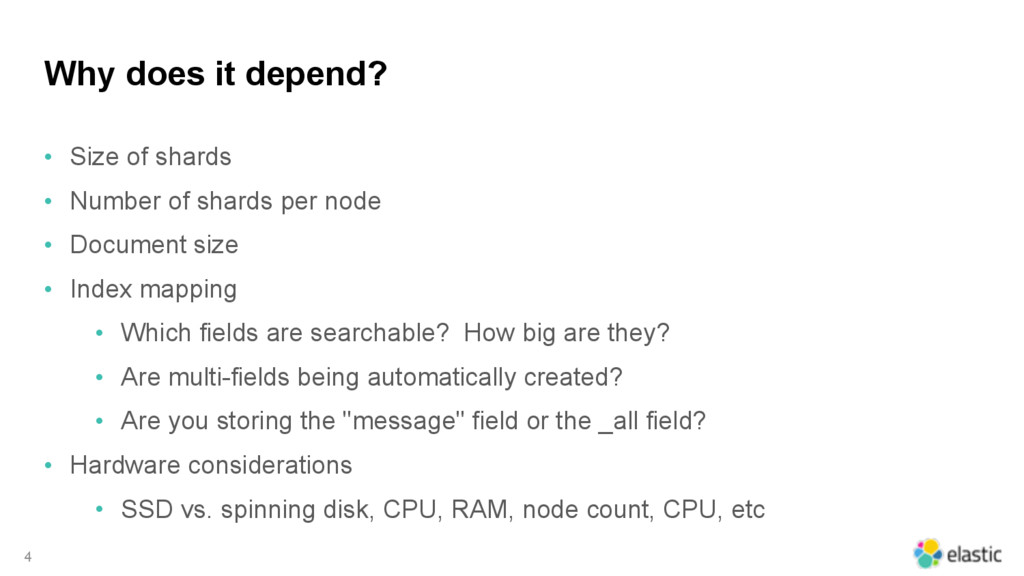
of shards per node • Document size • Index mapping • Which fields are searchable? How big are they? • Are multi-fields being automatically created? • Are you storing the "message" field or the _all field? • Hardware considerations • SSD vs. spinning disk, CPU, RAM, node count, CPU, etc 4
ES_HEAP_SIZE • Keep heap below 30.5G to avoid • 64bit, uncompressed object pointers • Potentially long GC times • Avoid G1GC • Ignore this at your own peril • Disallow swap if possible. • Use bootstrap.mlockall if need be. • Add bootstrap.mlockall: true to elasticsearch.yml 6
about the IOPs • Better able to handle traffic spikes • Use the noop scheduler when using SSD: • echo noop > /sys/block/{DEVICE}/queue/scheduler • If you can't have all SSD, aim for a hot/cold cluster architecture • Use SSDs for "hot" nodes • Use spinning disks for "cold" nodes 7
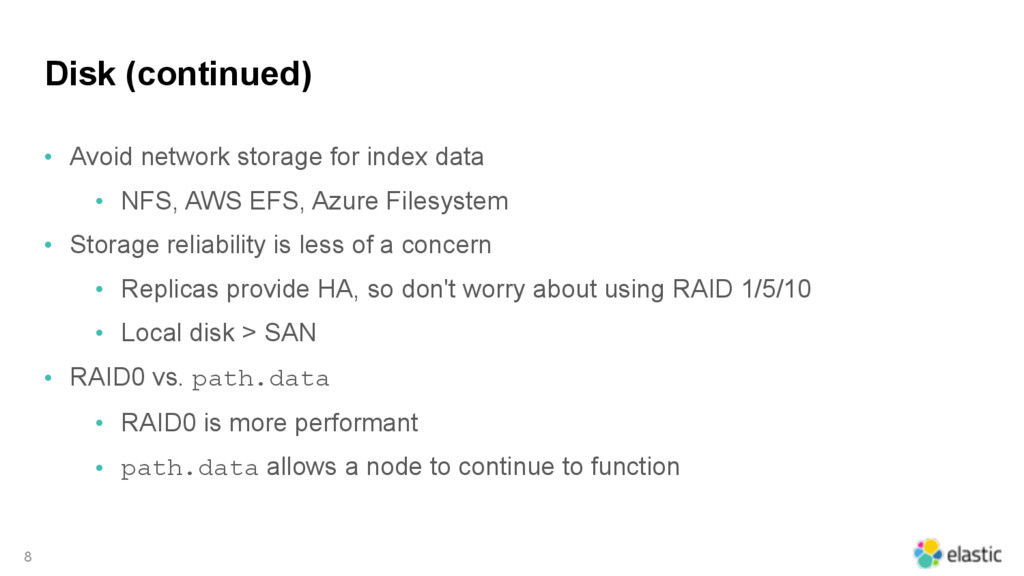
NFS, AWS EFS, Azure Filesystem • Storage reliability is less of a concern • Replicas provide HA, so don't worry about using RAID 1/5/10 • Local disk > SAN • RAID0 vs. path.data • RAID0 is more performant • path.data allows a node to continue to function 8
core, 64G + 4 1TB drives • Not this: 12 core, 256G + 12 1TB drives • Multiple nodes per physical machine is possible, but discouraged • A single instance can saturate a machine • If compelled, larger machines may be useful for "cold" storage nodes. 10
nodes via WAN • Try to have zero or very few hops between nodes • Ideally, separate transport and http traffic • Bind to different interfaces • Separate firewall rules for each kind • Use long lived HTTP connections • The official client libraries support this • If not possible, consider using a proxy or load-balancer with a server- side keep-alive 12
Index rate • Document count • Cluster/Node limitations • https://www.elastic.co/elasticon/conf/2016/sf/quantitative-cluster-sizing • More in depth than today 14
replicas • Throw data at it • Calculate storage before and after a _forcemerge operation • Lather, rinse, repeat with different mapping configurations • With _all enabled/disabled (iterate with both!) • Try as many different settings per field as makes sense • When omitting _all, ensure searching works the way you expect 15
0 replicas • Index real or at least realistic data • Query with real or at least realistic queries • Measure and plot index and search time • Determine the sweet spot • Diminishing returns 16
with 2 shards, 0 replicas (single node) • Repeat previous experiment • Did performance vary? How much? • Lather, rinse, repeat: • Increase shard count by 1 • Where is the sweet spot? 17
from the previous tests and: • Configure a small cluster • Add real or at least realistic data • Benchmark • Indexing • Querying • Both, at varying levels • Resource usage (disk, memory, document count) 18
are required to keep a shard "active" • Memory, CPU, I/O • Shards are not just data storage • Nodes cannot sustain an unlimited count of shards • Even if there's still disk space • That's like saying... 20
heap • Shared by all "active" indices on the node • Each "active" shard wants 250M of the buffer • Will be compressed/reduced if there is memory pressure • indices.memory.min_shard_index_buffer_size • Default is 4MB per shard • Will be compressed/reduced if there is memory pressure • "inactive" shards still consume this memory • Indexing stops if the buffer is exhausted 22
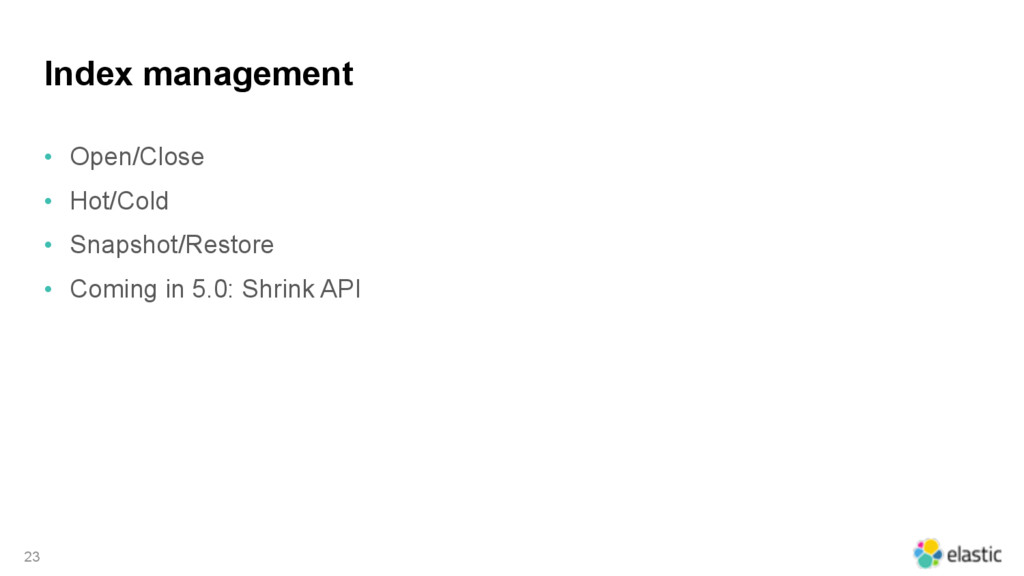
First, it creates a new target index with the same definition as the source index, but with a smaller number of primary shards. • Then it hard-links segments from the source index into the target index. (If the file system doesn’t support hard-linking, then all segments are copied into the new index, which is a much more time consuming process.) • Finally, it recovers the target index as though it were a closed index which had just been re-opened. 24
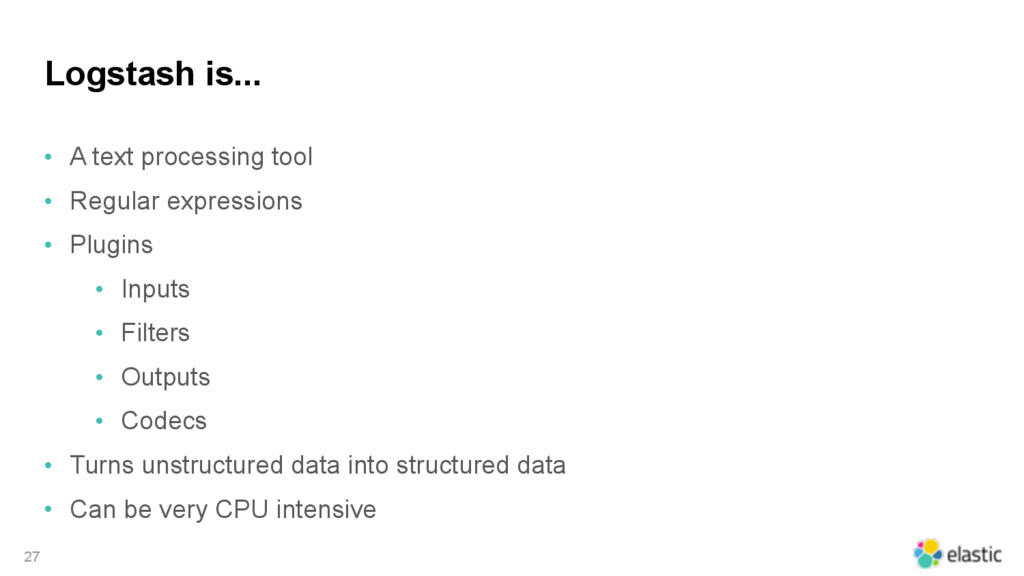
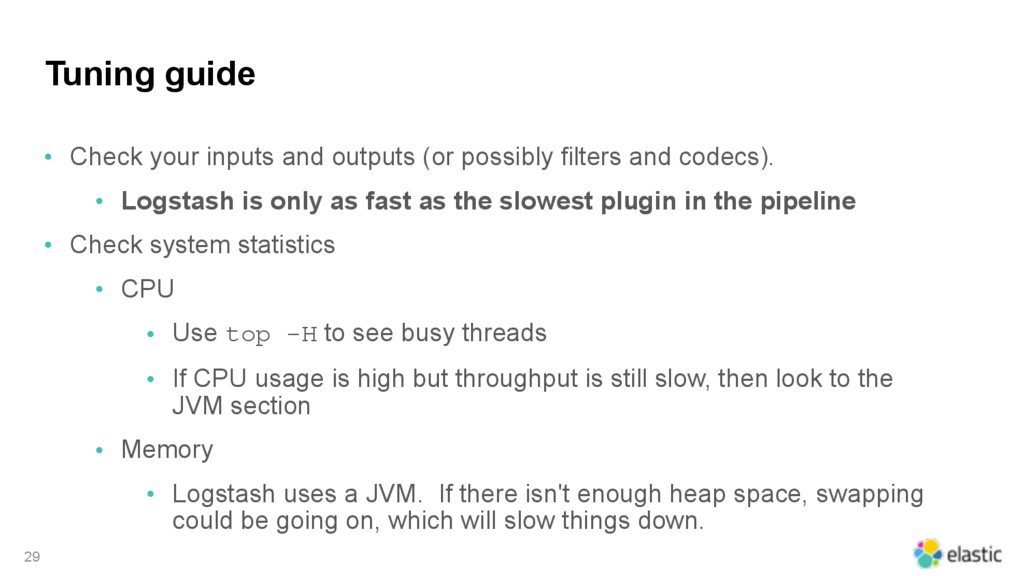
filters and codecs). • Logstash is only as fast as the slowest plugin in the pipeline • Check system statistics • CPU • Use top -H to see busy threads • If CPU usage is high but throughput is still slow, then look to the JVM section • Memory • Logstash uses a JVM. If there isn't enough heap space, swapping could be going on, which will slow things down. 29
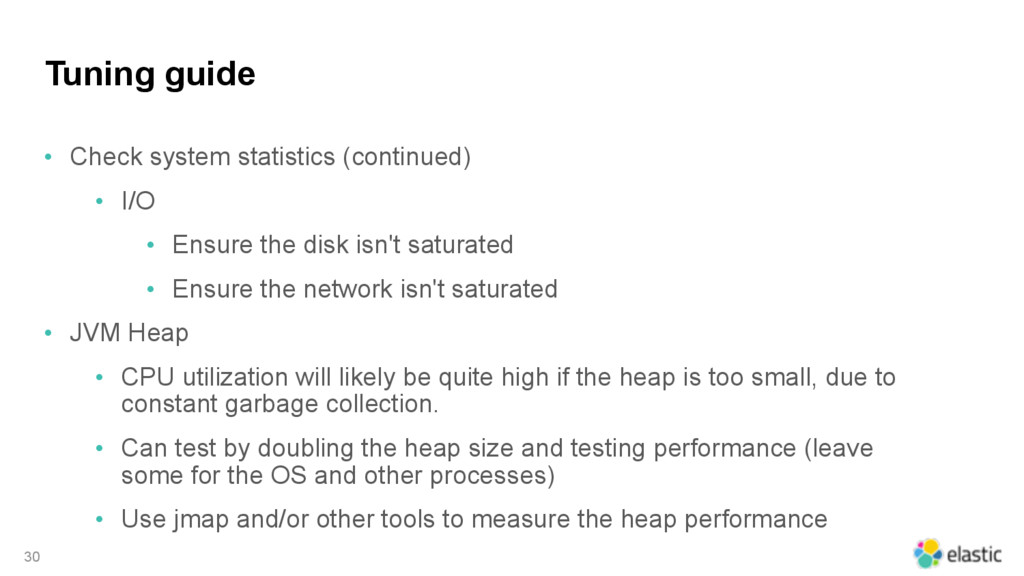
Ensure the disk isn't saturated • Ensure the network isn't saturated • JVM Heap • CPU utilization will likely be quite high if the heap is too small, due to constant garbage collection. • Can test by doubling the heap size and testing performance (leave some for the OS and other processes) • Use jmap and/or other tools to measure the heap performance 30
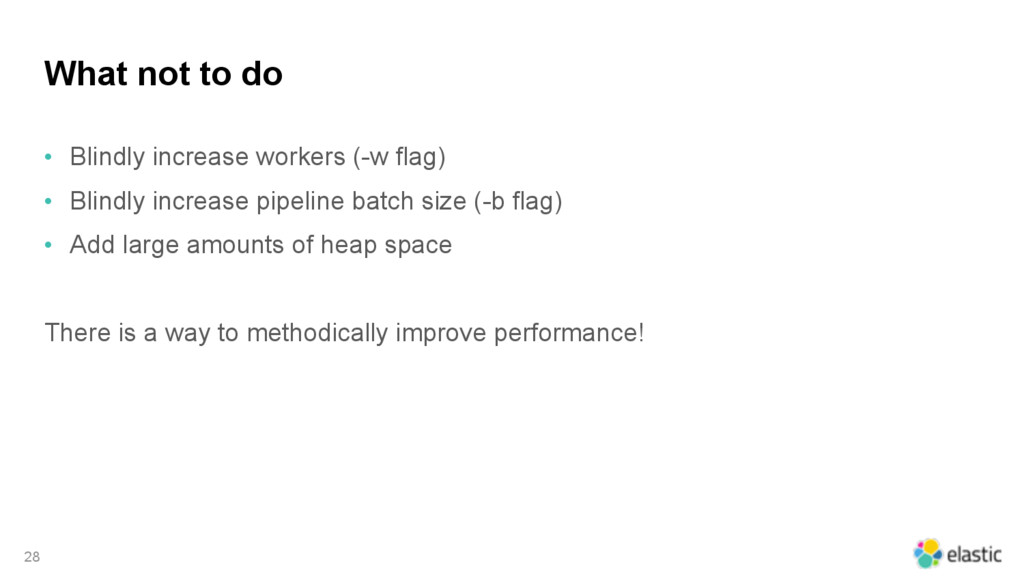
of pipeline workers using the -w flag. • It is safe to scale this up to a multiple of CPU cores if need be as the threads can become idle on I/O. • Increase the number of "output" workers in the configuration • workers => 2 • Do not make this value larger than the number of pipeline workers • Tune output batch size • Only available in some outputs. • flush_size in the Elasticsearch output 31