Upgrade to Pro — share decks privately, control downloads, hide ads and more …

Using Beats in the Elastic Stack - NLUUG

Using Beats in the Elastic Stack - NLUUG

If you haven't heard of Beats yet, you're in for a treat! In this 45 minute presentation you will learn about “Beats,” from Elastic, and how using them can enhance data collection and analytics in your Elastic Stack.

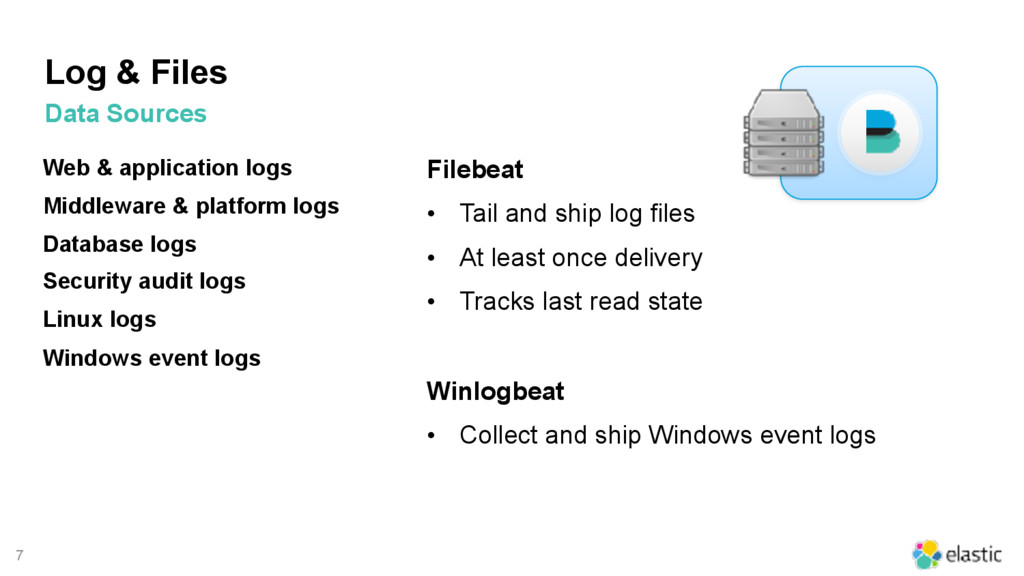
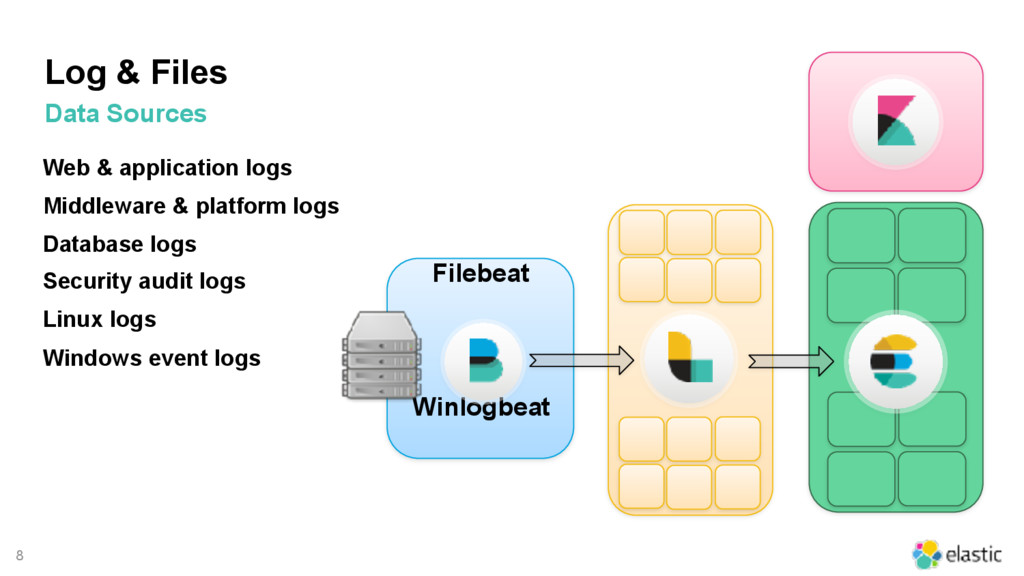
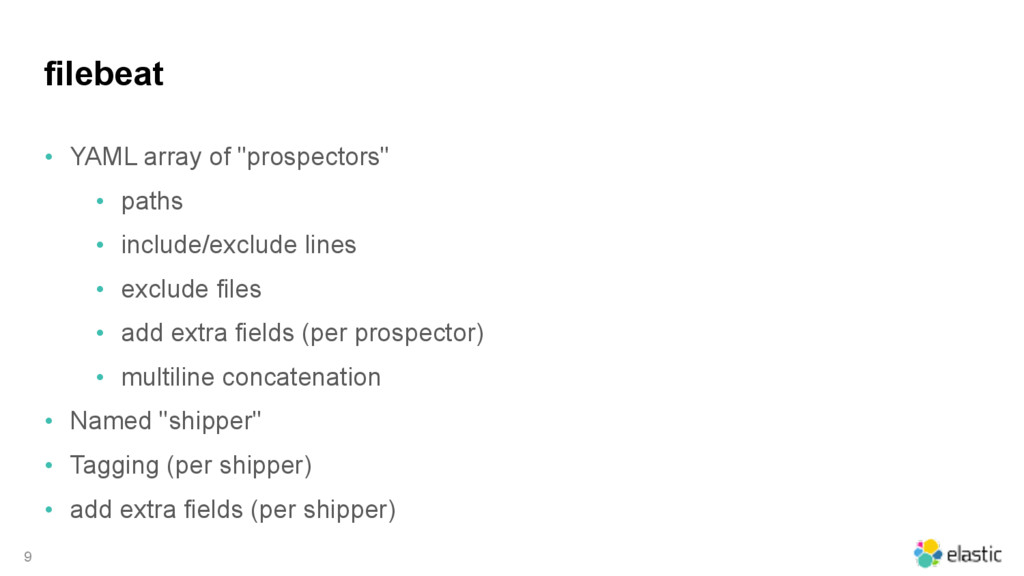
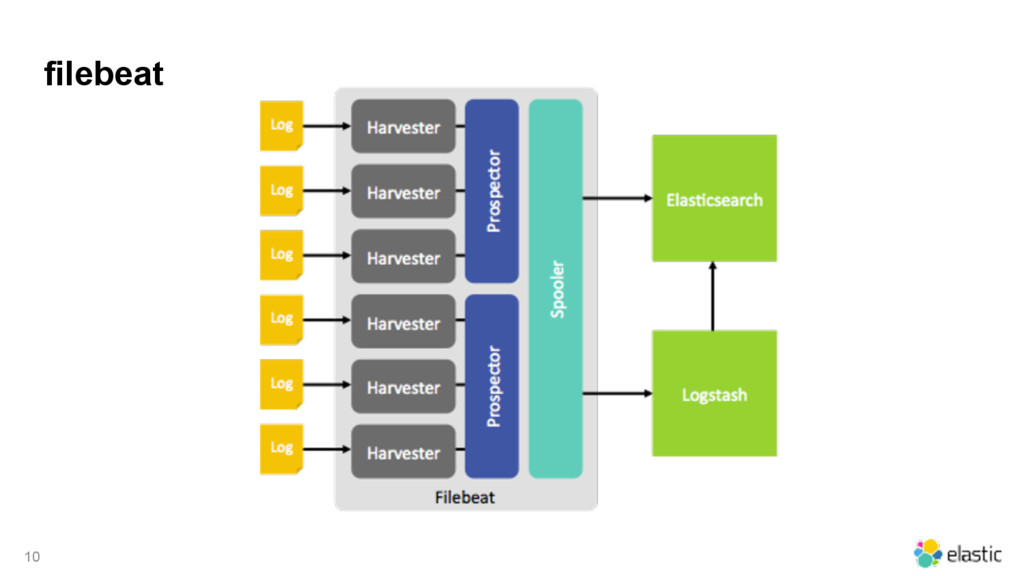
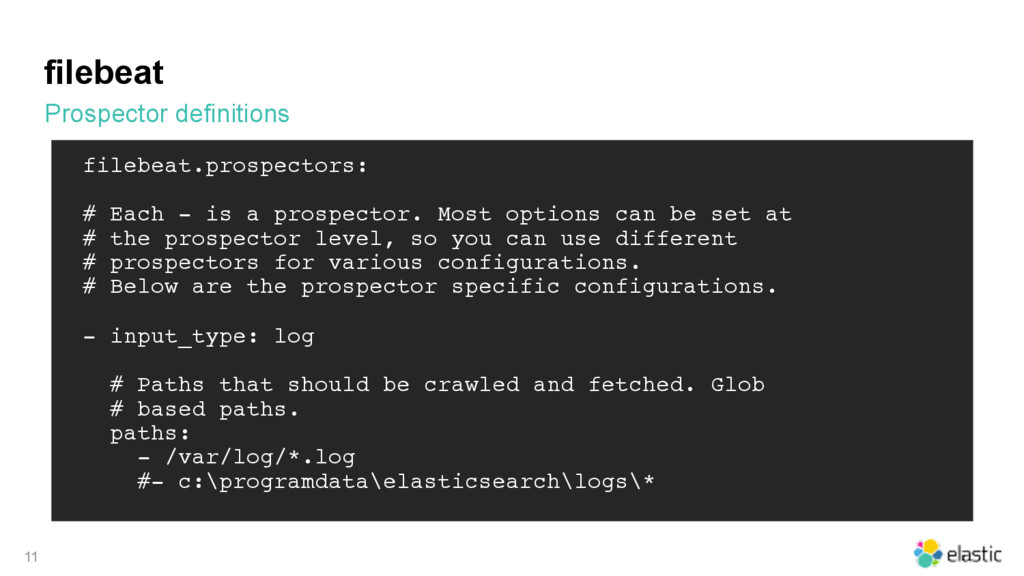
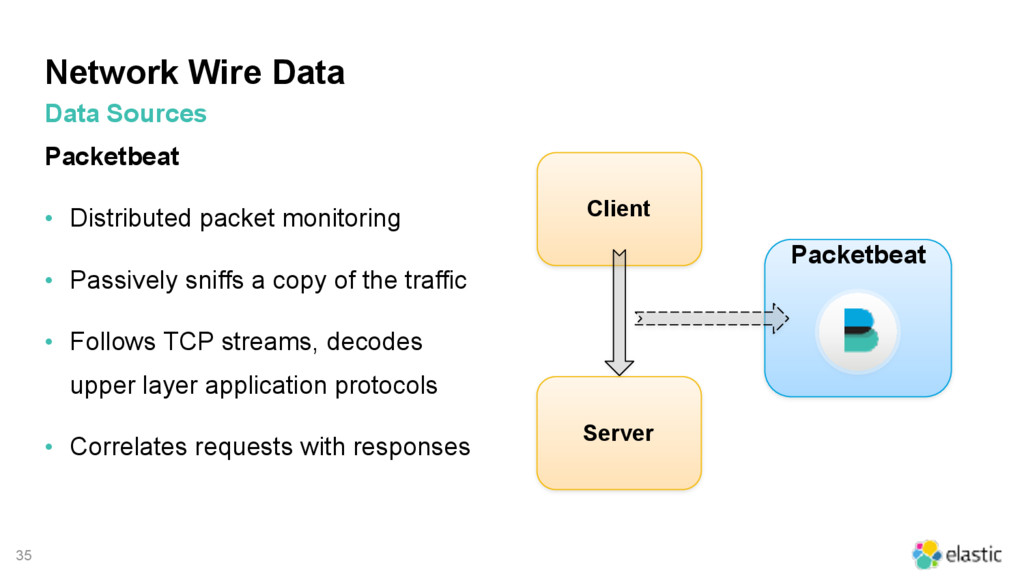
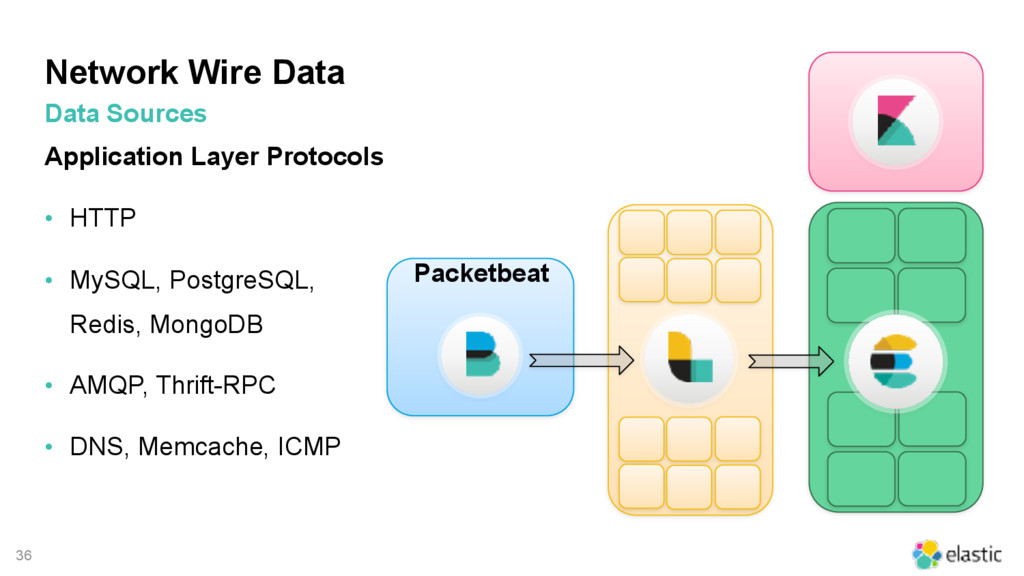
Learn about the officially supported Beats: Filebeat (lightweight file-tailing and shipping) Packetbeat (monitor packet traffic for MySQL, Postgres, Redis, Memcache, HTTP, and more) Winlogbeat (ship events from the Windows Event Log) Topbeat/Metricbeat (Ship performance metrics from monitored systems)
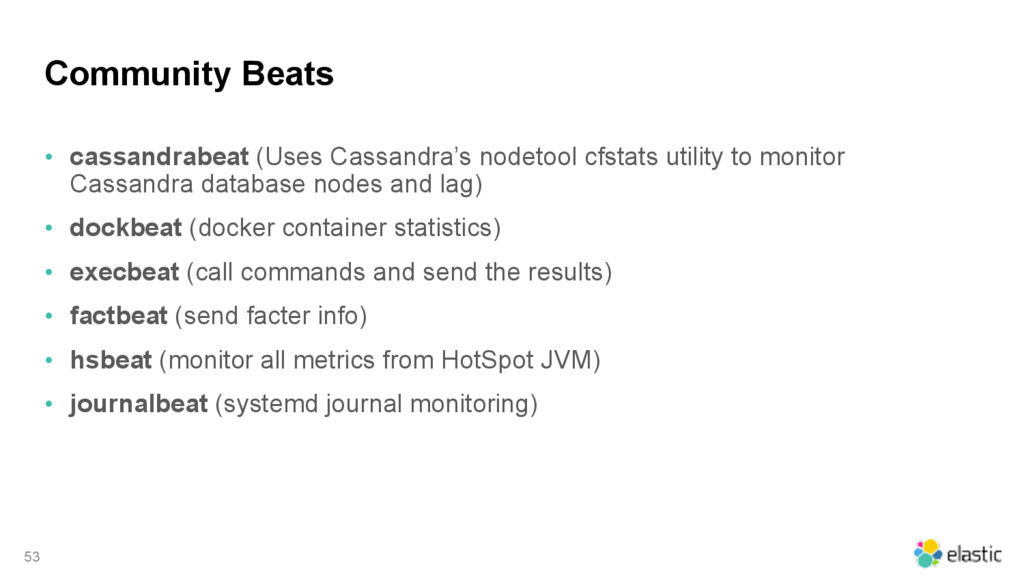
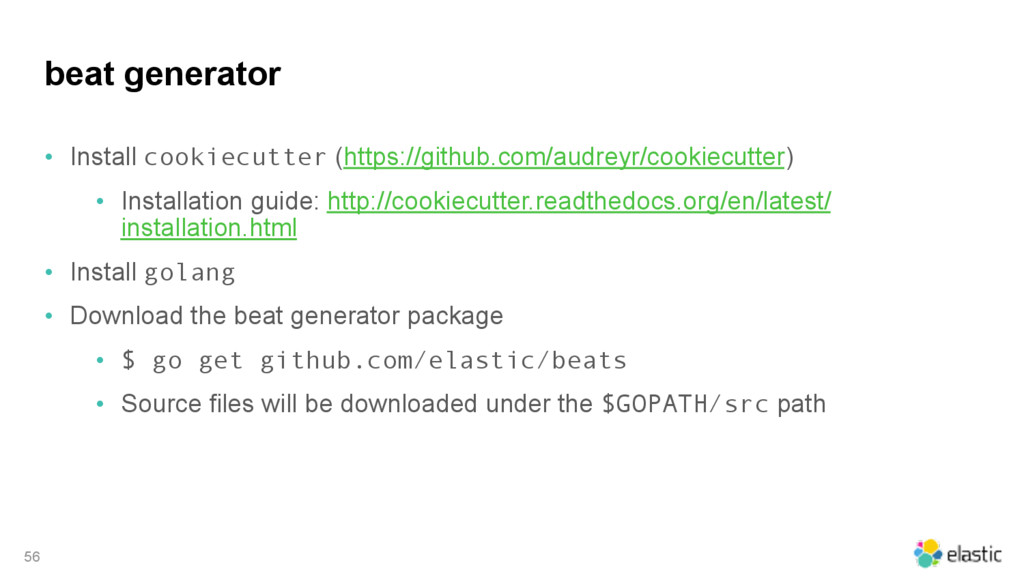
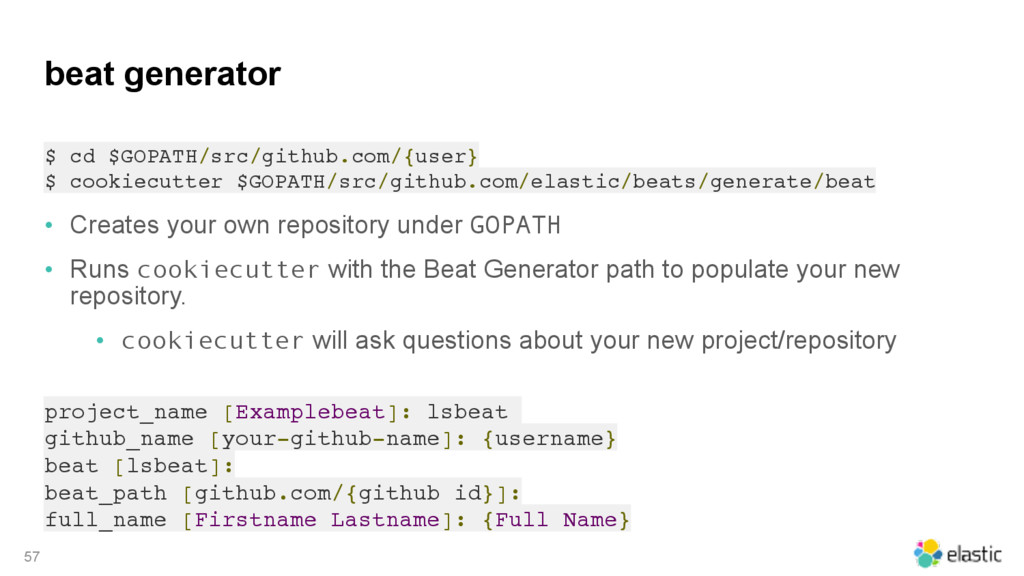
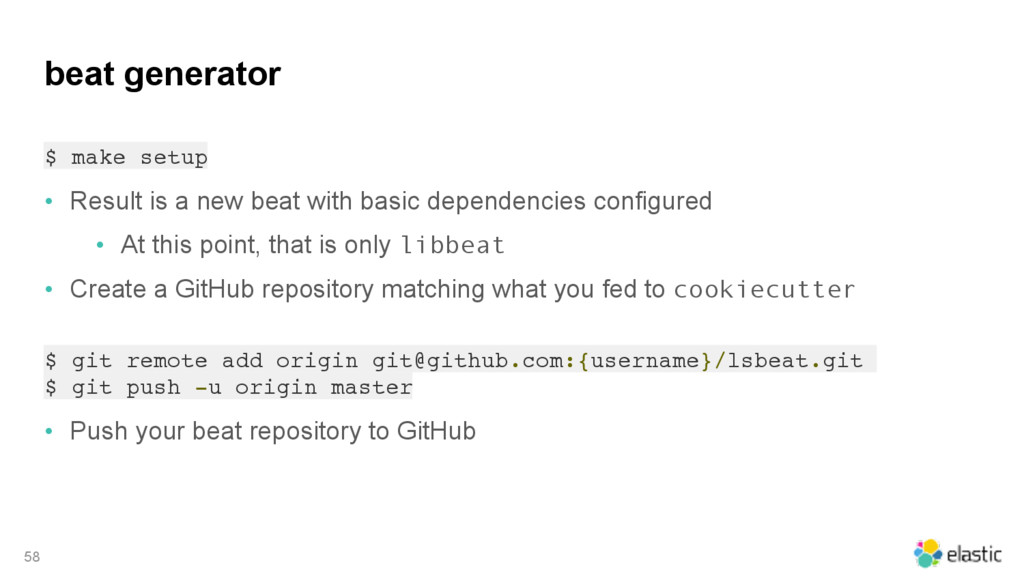
Additionally, there is a growing number of community provided “Beats” built on libbeat, the open source framework on which all Beats are built. Learn how easy it is to start making your own Beat!

Aaron Mildenstein

November 17, 2016
Tweet

More Decks by Aaron Mildenstein

Other Decks in Programming

Transcript

  1. ‹#›
    Using Beats in the
    Elastic Stack

    View Slide

  2. 2
    Agenda
    • What's a "Beat"?
    • Filebeat
    • Packetbeat
    • Metricbeat
    • Winlogbeat
    • Community Beats
    • Write your own!

    View Slide

  3. 3
    Elastic Cloud
    Security
    Monitoring
    Alerting
    Graph
    X-Pack
    Kibana
    User Interface
    Elasticsearch
    Store, Index, &
    Analyze
    Ingest
    Logstash Beats
    +
    Elastic: Product Portfolio
    Elastic
    Stack

    View Slide

  4. 4
    Beats
    Log Files Metrics
    Wire Data
    Datastore Web APIs
    Social Sensors
    Kafka
    Redis
    Messaging
    Queue
    Logstash
    ES-Hadoop
    Elasticsearch
    Kibana
    Nodes (X)
    Master Nodes (3)
    Ingest Nodes (X)
    Data Nodes – Hot (X)
    Data Notes – Warm (X)
    Instances (X)
    your{beat}
    X-Pack X-Pack
    Custom UI
    LDAP
    Authentication
    AD
    Notification
    SSO
    The Elastic Stack (& Friends)
    Hadoop Ecosystem

    View Slide

  5. Similarities between beats
    • YAML configuration files
    • Add fields to events
    • Output configuration blocks can be copied/pasted amongst other beats
    • Logstash
    • Elasticsearch
    • Redis
    • Kafka
    • File
    5

    View Slide

  6. 6
    filebeat & winlogbeat
    Logs & Files

    View Slide

  7. 7
    Log & Files
    Data Sources
    Web & application logs
    Middleware & platform logs
    Database logs
    Security audit logs
    Linux logs
    Windows event logs
    Filebeat
    • Tail and ship log files
    • At least once delivery
    • Tracks last read state
    Winlogbeat
    • Collect and ship Windows event logs

    View Slide

  8. 8
    Log & Files
    Data Sources
    Web & application logs
    Middleware & platform logs
    Database logs
    Security audit logs
    Linux logs
    Windows event logs
    Filebeat
    Winlogbeat

    View Slide

  9. filebeat
    • YAML array of "prospectors"
    • paths
    • include/exclude lines
    • exclude files
    • add extra fields (per prospector)
    • multiline concatenation
    • Named "shipper"
    • Tagging (per shipper)
    • add extra fields (per shipper)
    9

    View Slide

  10. filebeat
    10

    View Slide

  11. filebeat
    Prospector definitions
    11
    filebeat.prospectors:
    # Each - is a prospector. Most options can be set at
    # the prospector level, so you can use different
    # prospectors for various configurations.
    # Below are the prospector specific configurations.
    - input_type: log
    # Paths that should be crawled and fetched. Glob
    # based paths.
    paths:
    - /var/log/*.log
    #- c:\programdata\elasticsearch\logs\*

    View Slide

  12. filebeat
    Prospector definitions
    12
    # Exclude lines. A list of regular expressions to
    # match. It drops the lines that are
    # matching any regular expression from the list.
    #exclude_lines: ["^DBG"]
    # Include lines. A list of regular expressions to
    # match. It exports the lines that are
    # matching any regular expression from the list.
    #include_lines: ["^ERR", "^WARN"]

    View Slide

  13. filebeat
    Prospector definitions
    13
    # Exclude files. A list of regular expressions to
    # match. Filebeat drops the files that are matching
    # any regular expression from the list.
    # By default, no files are dropped.
    #exclude_files: [".gz$"]

    View Slide

  14. filebeat
    Prospector definitions
    14
    # Optional additional fields. These field can be
    # freely picked to add additional information to the
    # crawled log files for filtering
    #fields:
    # level: debug
    # review: 1

    View Slide

  15. filebeat
    Prospector definitions
    15
    # The regexp Pattern that has to be matched. The
    # example pattern matches all lines starting with [
    #multiline.pattern: ^\[
    # Defines if the pattern set under pattern should be
    # negated or not. Default is false.
    #multiline.negate: false
    # Match can be set to "after" or "before". It is
    # used to define if lines should be append to a
    # pattern that was (not) matched before or after or
    # as long as a pattern is not matched based on
    # negate. Note: After is the equivalent to previous
    # and before is the equivalent to to next in Logstash
    #multiline.match: after

    View Slide

  16. filebeat limitations
    • No parsing of lines.
    • Just a lightweight shipper
    • You'll need to use Logstash
    • Or Ingest Node (topic for another presentation)
    16

    View Slide

  17. 17
    metricbeat
    Metrics

    View Slide

  18. metricbeat - modules
    system
    18
    - module: system
    metricsets: ["cpu","load","core","diskio",
    "filesystem","fsstat","memory","network","process"]
    enabled: true
    period: 10s
    processes: ['.*']
    # if true, exports the CPU usage in ticks, together
    # with the percentage values
    #cpu_ticks: false
    # EXPERIMENTAL: cgroups can be enabled for the
    # process metricset.
    #cgroups: false

    View Slide

  19. metricbeat - modules
    apache
    19
    - module: apache
    metricsets: ["status"]
    enabled: true
    period: 10s
    hosts: ["http://127.0.0.1"]
    server_status_path: "server-status"
    #username: test
    #password: test123

    View Slide

  20. metricbeat - modules
    haproxy
    20
    - module: haproxy
    metricsets: [stat, info]
    enabled: true
    period: 10s
    hosts: ['tcp://127.0.0.1:14567']

    View Slide

  21. metricbeat - modules
    mongodb
    21
    - module: mongodb
    metricsets: ["status"]
    enabled: true
    period: 10s
    # The hosts must be passed as MongoDB URLs
    # in the format:
    # [mongodb://][user:[email protected]]host[:port]
    hosts: ["localhost:27017"]

    View Slide

  22. metricbeat - modules
    MySQL
    22
    - module: mysql
    metricsets: ["status"]
    enabled: true
    period: 10s
    # Host DSN should be defined
    # as "tcp(127.0.0.1:3306)/"
    # The username and password can either be set in the
    # DSN or for all hosts in username and password
    # config option
    hosts: ["[email protected](127.0.0.1:3306)/"]
    #username: root
    #password: test

    View Slide

  23. metricbeat - modules
    nginx
    23
    - module: nginx
    metricsets: ["stubstatus"]
    enabled: true
    period: 10s
    # Nginx hosts
    hosts: ["http://127.0.0.1"]
    # Path to server status. Default server-status
    server_status_path: "server-status"

    View Slide

  24. metricbeat - modules
    postgresql
    24
    - module: postgresql
    metricsets:
    # Stats about every PostgreSQL database
    - database
    # Stats about the background writer
    - bgwriter
    # Stats about every PostgreSQL process
    - activity
    enabled: true
    period: 10s
    # The host must be passed as PostgreSQL DSN.
    # postgres://user:[email protected]:5432?sslmode=disable
    hosts: ["postgres://[email protected]:5432"]

    View Slide

  25. metricbeat - modules
    redis
    25
    - module: redis
    metricsets: ["info", "keyspace"]
    hosts: ["127.0.0.1:6379"]
    timeout: 1s
    network: tcp
    maxconn: 10
    #filters:
    # - include_fields:
    # fields: ["stats"]
    # Redis AUTH password. Empty by default.
    #password: foobared

    View Slide

  26. metricbeat - modules
    zookeeper
    26
    - module: zookeeper
    metricsets: ["mntr"]
    enabled: true
    period: 10s
    hosts: ["localhost:2181"]

    View Slide

  27. Easy to install default dashboards for Kibana
    Saves you mountains of time creating visualizations & dashboards
    27
    $ cd /usr/share/metricbeat
    $ ./scripts/import_dashboards -es http://127.0.0.1

    View Slide

  28. 28

    View Slide

  29. 29

    View Slide

  30. 30

    View Slide

  31. 31

    View Slide

  32. 32

    View Slide

  33. 33
    packetbeat
    Network Wire
    Data

    View Slide

  34. 34
    Network Wire Data
    Protocol Types
    • Web
    • Database
    • Middleware
    • Infrastructure Services
    Use Cases
    • Security
    • Performance analysis
    • Network troubleshooting
    • Application troubleshooting
    Data Sources

    View Slide

  35. 35
    Network Wire Data
    Packetbeat
    • Distributed packet monitoring
    • Passively sniffs a copy of the traffic
    • Follows TCP streams, decodes
    upper layer application protocols
    • Correlates requests with responses
    Data Sources
    Client
    Packetbeat
    Server

    View Slide

  36. 36
    Network Wire Data
    Application Layer Protocols
    • HTTP
    • MySQL, PostgreSQL, 

    Redis, MongoDB
    • AMQP, Thrift-RPC
    • DNS, Memcache, ICMP
    Data Sources
    Packetbeat

    View Slide

  37. Packet capture: type
    • Currently Packetbeat has several options for traffic capturing:
    • pcap, which uses the libpcap library and works on most platforms, but
    it’s not the fastest option.
    • af_packet, which uses memory mapped sniffing. This option is faster
    than libpcap and doesn’t require a kernel module, but it’s Linux-
    specific.
    • pf_ring, which makes use of an ntop.org project. This setting
    provides the best sniffing speed, but it requires a kernel module, and
    it’s Linux-specific.
    37

    View Slide

  38. HTTP: ports
    • Capture one port:
    • ports: 80
    • Capture multiple ports:
    • ports: [80, 8080, 8000, 5000, 8002]
    38

    View Slide

  39. HTTP: send_headers / send_all_headers
    • Capture all headers:
    • send_all_headers: true
    • Capture only named headers:
    • send_headers: [ "host", "user-agent", "content-
    type", "referer" ]
    39

    View Slide

  40. HTTP: hide_keywords
    • The names of the keyword parameters are case insensitive.
    • The values will be replaced with the 'xxxxx' string. This is useful for
    avoiding storing user passwords or other sensitive information.
    • Only query parameters and top level form parameters are replaced.
    • hide_keywords: ['pass', 'password', 'passwd']
    40

    View Slide

  41. Beats
    • Ingest (server-side) with Elasticsearch target
    41
    interfaces:
    device: eth0
    type: af_packet
    http:
    ports: [80]
    send_all_headers: true
    output:
    elasticsearch:
    hosts: ["elasticsearch.example.com:9200"]

    View Slide

  42. Beats
    • Ingest (server-side) with Logstash target
    42
    interfaces:
    device: eth0
    type: af_packet
    http:
    ports: [80]
    send_all_headers: true
    output:
    logstash:
    hosts: ["logstash.example.com:5044"]
    tls:
    certificate_authorities: ["/path/to/certificate.crt"]

    View Slide

  43. Why send to Logstash?
    • Enrich your data!
    • geoip
    • useragent
    • dns
    • grok
    • kv
    43

    View Slide

  44. Logstash
    • Ingest Beats (Pre-formatted JSON)
    44
    input {
    beats {
    port => 5044
    ssl => true
    ssl_certificate => "/path/to/certificate.crt"
    ssl_key => "/path/to/private.key"
    codec => "json"
    }
    }

    View Slide

  45. Logstash
    • Filters
    45
    filter {
    # Enrich HTTP Packetbeats
    if [type] == "http" and "packetbeat" in [tags] {
    geoip { source => "client_ip" }
    useragent {
    source => "[http][request_headers][user-agent]"
    target => "useragent"
    }
    }
    }

    View Slide

  46. Extended JSON output from Beats + Logstash
    46
    "@timestamp": "2016-01-20T21:40:53.300Z",
    "beat": {
    "hostname": "ip-172-31-46-141",
    "name": "ip-172-31-46-141"
    },
    "bytes_in": 189,
    "bytes_out": 6910,
    "client_ip": "68.180.229.41",
    "client_port": 57739,
    "client_proc": "",
    "client_server": "",
    "count": 1,
    "direction": "in",
    "http": {
    "code": 200,
    "content_length": 6516,
    "phrase": "OK",
    "request_headers": {
    "accept": "*/*",
    "accept-encoding": "gzip",
    "host": "example.com"

    View Slide

  47. Extended JSON output from Beats + Logstash
    47
    "user-agent": "Mozilla/5.0 (compatible; Yahoo! Slurp; http://help.yahoo.com
    help/us/ysearch/slurp)"
    },
    "response_headers": {
    "connection": "keep-alive",
    "content-type": "application/rss+xml; charset=UTF-8",
    "date": "Wed, 20 Jan 2016 21:40:53 GMT",
    "etag": "\"8c0b25ce7ade4b79d5ccf1ebb656fa51\"",
    "last-modified": "Wed, 24 Jul 2013 20:31:04 GMT",
    "link": "; rel=\"https://api.w.org/\"",
    "server": "nginx/1.4.6 (Ubuntu)",
    "transfer-encoding": "chunked",
    "x-powered-by": "PHP/5.5.9-1ubuntu4.14"
    }
    },
    "ip": "172.31.46.141",
    "method": "GET",
    "params": "",
    "path": "/tag/redacted/feed/",
    "port": 80,
    "proc": "",

    View Slide

  48. Extended JSON output from Beats + Logstash
    48
    "query": "GET /tag/redacted/feed/",
    "responsetime": 278,
    "server": "",
    "status": "OK",
    "type": "http",
    "@version": "1",
    "host": "ip-172-31-46-941",
    "tags": [
    "packetbeat"
    ],
    "geoip": {
    "ip": "68.180.229.41",
    "country_code2": "US",
    "country_code3": "USA",
    "country_name": "United States",
    "continent_code": "NA",
    "region_name": "CA",
    "city_name": "Sunnyvale",
    "postal_code": "94089",
    "latitude": 37.42490000000001,
    "longitude": -122.00739999999999,

    View Slide

  49. Extended JSON output from Beats + Logstash
    49
    "dma_code": 807,
    "area_code": 408,
    "timezone": "America/Los_Angeles",
    "real_region_name": "California",
    "location": [
    -122.00739999999999,
    37.42490000000001
    ]
    },
    "useragent": {
    "name": "Yahoo! Slurp",
    "os": "Other",
    "os_name": "Other",
    "device": "Spider"
    }

    View Slide

  50. 50

    View Slide

  51. Logstash + beats (pre-formatted JSON)
    • Pro
    • CPU cost dramatically reduced (Logstash side)
    • Simple configuration to capture everything.
    • Logstash not necessary!
    • Useful to enrich data: geoip, useragent, headers, etc.
    • Con
    • Cannot directly monitor SSL traffic
    • CPU cost (server side) scales with traffic volume. Might be higher for
    heavy traffic.
    • Uncaptured packet data is unrecoverable.
    51

    View Slide

  52. 52
    Community Beats

    View Slide

  53. Community Beats
    • cassandrabeat (Uses Cassandra’s nodetool cfstats utility to monitor
    Cassandra database nodes and lag)
    • dockbeat (docker container statistics)
    • execbeat (call commands and send the results)
    • factbeat (send facter info)
    • hsbeat (monitor all metrics from HotSpot JVM)
    • journalbeat (systemd journal monitoring)
    53

    View Slide

  54. 54
    You know you want to...
    Roll your own
    Beat

    View Slide

  55. Beats Framework
    55
    Filebeat
    Topbeat
    Packetbeat
    {Community}Beats
    Libbeat
    Beats Framework
    Elasticsearch
    Kibana
    Logstash
    Optional
    Libbeat: Foundation
    for all Beats
    Written in go
    (https://golang.org/)

    View Slide

  56. beat generator
    • Install cookiecutter (https://github.com/audreyr/cookiecutter)
    • Installation guide: http://cookiecutter.readthedocs.org/en/latest/
    installation.html
    • Install golang
    • Download the beat generator package
    • $ go get github.com/elastic/beats
    • Source files will be downloaded under the $GOPATH/src path
    56

    View Slide

  57. beat generator
    $ cd $GOPATH/src/github.com/{user}
    $ cookiecutter $GOPATH/src/github.com/elastic/beats/generate/beat
    • Creates your own repository under GOPATH
    • Runs cookiecutter with the Beat Generator path to populate your new
    repository.
    • cookiecutter will ask questions about your new project/repository
    project_name [Examplebeat]: lsbeat
    github_name [your-github-name]: {username}
    beat [lsbeat]:
    beat_path [github.com/{github id}]:
    full_name [Firstname Lastname]: {Full Name}
    57

    View Slide

  58. beat generator
    $ make setup
    • Result is a new beat with basic dependencies configured
    • At this point, that is only libbeat
    • Create a GitHub repository matching what you fed to cookiecutter
    $ git remote add origin [email protected]:{username}/lsbeat.git
    $ git push -u origin master
    • Push your beat repository to GitHub
    58

    View Slide

  59. beats plan
    59
    Data

    View Slide

  60. 60
    Questions?

    View Slide

  61. 61
    Web : www.elastic.co
    Products : https://www.elastic.co/products
    Forums : https://discuss.elastic.co/
    Community : https://www.elastic.co/community/meetups
    Twitter : @elastic
    Thank You

    View Slide