$30 off During Our Annual Pro Sale. View Details »

The Practice and Evolution of HTTP Access Monitoring

The Practice and Evolution of HTTP Access Monitoring

A history of HTTP access monitoring.

An overview of the tools used in the past, and tools available today, which dramatically improve the visibility and value of your traffic data.

Aaron Mildenstein

July 13, 2016
Tweet

More Decks by Aaron Mildenstein

Other Decks in Programming

Transcript

  1. ‹#›
    Aaron Mildenstein
    Logstash Developer
    The practice & evolution of
    HTTP access monitoring

    View Slide

  2. 2
    In the
    beginning…

    View Slide

  3. Apache HTTP Server
    • Logs!
    • LogFormat "%h %l %u %t \"%r\" %>s %b" common

    CustomLog logs/access_log common
    • 127.0.0.1 - frank [10/Oct/2000:13:55:36 -0700]
    "GET /apache_pb.gif HTTP/1.0" 200 2326
    • Tools
    • cat
    • tail
    • grep
    3

    View Slide

  4. cat
    This cat doesn't purr…
    4

    View Slide

  5. tail
    Let's put a tail on that cat…
    5

    View Slide

  6. tail
    • What's the difference between:
    • tail -f
    • tail -F
    • What does the -n flag do?
    • What does the -v flag do?
    • What does the --pid flag do?
    6
    Let's put a tail on that cat…

    View Slide

  7. grep
    • Flags, flags, flags!
    • No seriously
    • I'm 
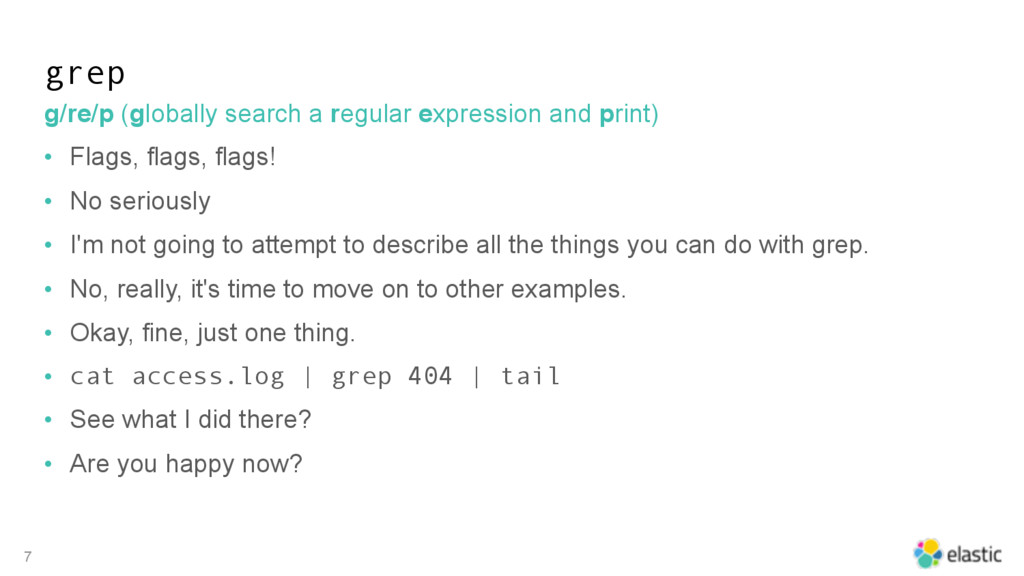
not going to attempt to describe all the things you can do with grep.
    • No, really, it's time to move on to other examples.
    • Okay, fine, just one thing.
    • cat access.log | grep 404 | tail
    • See what I did there?
    • Are you happy now?
    7
    g/re/p (globally search a regular expression and print)

    View Slide

  8. Sadly, no...
    8
    But will it scale?

    View Slide

  9. Anyone else ever try to do this?
    I used to do it all the time :-(
    9

    View Slide

  10. Apologies to Billy Idol…
    10
    What if I want to
    see more?

    View Slide

  11. Elastic Stack (the early edition)
    • Ingest
    • Logstash
    • Store, Search, and Analyze
    • Elasticsearch
    • Visualize
    • Kibana
    11

    View Slide

  12. Logstash
    • Ingest
    12
    input {
    file {
    path => "/path/to/access_log"
    }
    }
    message => "127.0.0.1 - frank [10/Oct/2000:13:55:36 -0700]
    "GET /apache_pb.gif HTTP/1.0" 200 2326"

    View Slide

  13. Logstash
    • Ingest, then Tokenize
    13
    filter {
    grok {
    match => { "message" => "%{COMMONAPACHELOG}" }
    }
    }

    View Slide

  14. Logstash
    • grok
    14
    clientip => "127.0.0.1"
    ident => "-"
    auth => "frank"
    timestamp => "10/Oct/2000:13:55:36 -0700"
    verb => "GET"
    request => "/apache_pb.gif"
    httpversion => 1.0
    response => 200
    bytes => 2326

    View Slide

  15. Logstash + grok
    • Pro
    • Simple!
    • No changes 
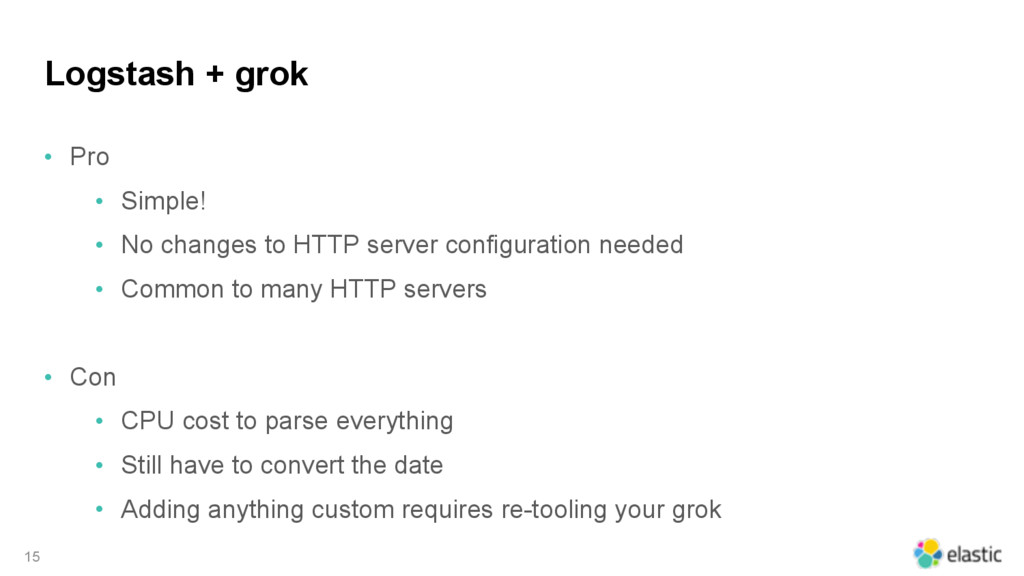
to HTTP server configuration needed
    • Common to many HTTP servers
    • Con
    • CPU cost to parse everything
    • Still have to convert the date
    • Adding anything custom requires re-tooling your grok
    15

    View Slide

  16. Apologies to Matt Groening
    16
    "Computers can
    do that?!"

    View Slide

  17. Apache HTTP Server
    • Logs, part 2!
    • CustomLog logs/json_access_log ls_apache_json
    17
    LogFormat "{\"@timestamp\": \"%{%Y-%m-%dT%H:%M:%S%z}t\",
    \"@version\": \"1\", \"vips\":[\"vip.example.com\"], \
    \"clientip\": \"%a\", \"duration\": %D, \
    \"status\": %>s, \"request\": \"%U%q\", \
    \"urlpath\": \"%U\", \"urlquery\": \"%q\", \
    \"bytes\": %B, \"verb\": \"%m\", \
    \"referer\": \"%{Referer}i\", \
    \"useragent\": \"%{User-agent}i\"}" ls_apache_json

    View Slide

  18. Logstash
    • Pre-formatted JSON Ingest
    18
    input {
    file {
    path => "/path/to/json_access_log"
    codec => "json"
    }
    }

    View Slide

  19. Logstash
    • without grok
    19
    clientip => "127.0.0.1"
    @timestamp => "2000-10-10T20:55:36.000Z"
    verb => "GET"
    request => "/apache_pb.gif"
    httpversion => 1.0
    response => 200
    bytes => 2326
    duration => 123
    referer => "…"
    useragent => "…"

    View Slide

  20. Logstash + pre-formatted JSON
    • Pro
    • CPU cost dramatically 
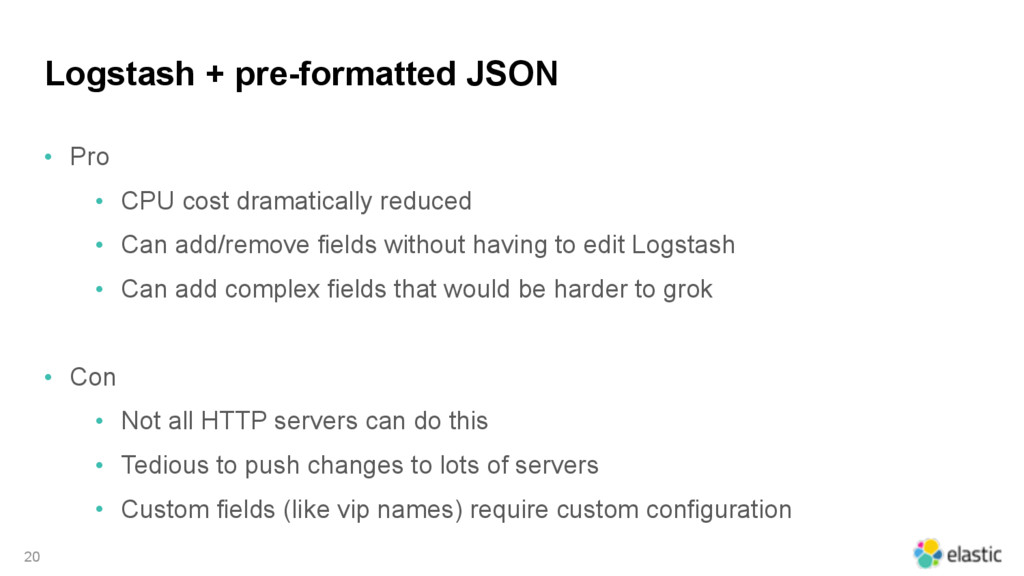
reduced
    • Can add/remove fields without having to edit Logstash
    • Can add complex fields that would be harder to grok
    • Con
    • Not all HTTP servers can do this
    • Tedious to push changes to lots of servers
    • Custom fields (like vip names) require custom configuration
    20

    View Slide

  21. Apologies to Sonny & Cher…
    21
    The beat goes
    on…

    View Slide

  22. Elastic Stack (the current edition)
    • Ingest
    • Beats
    • Logstash
    • Store, Search, and Analyze
    • Elasticsearch
    • Visualize
    • Kibana
    22

    View Slide

  23. Packet capture: type
    • Currently Packetbeat has several options for 
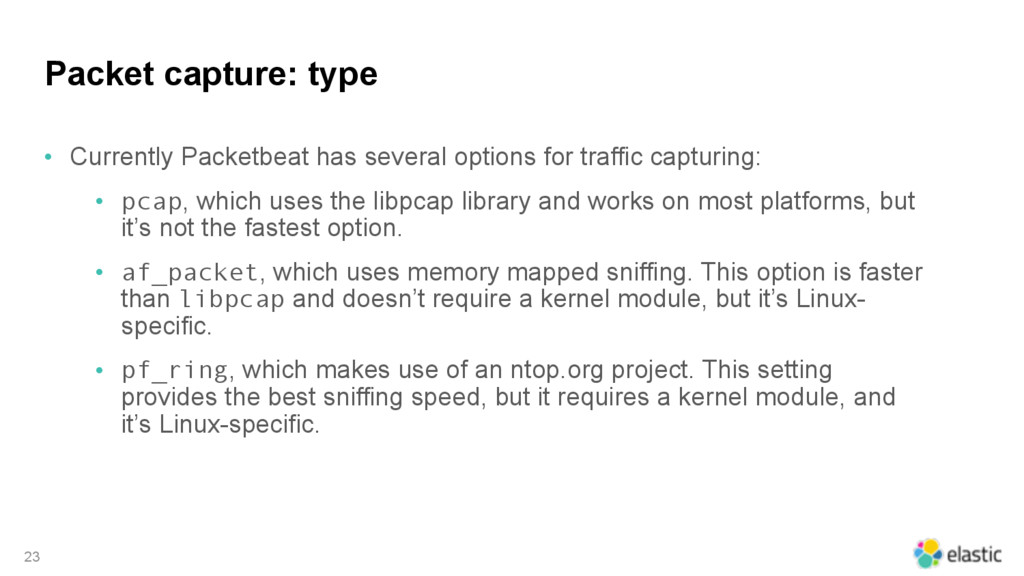
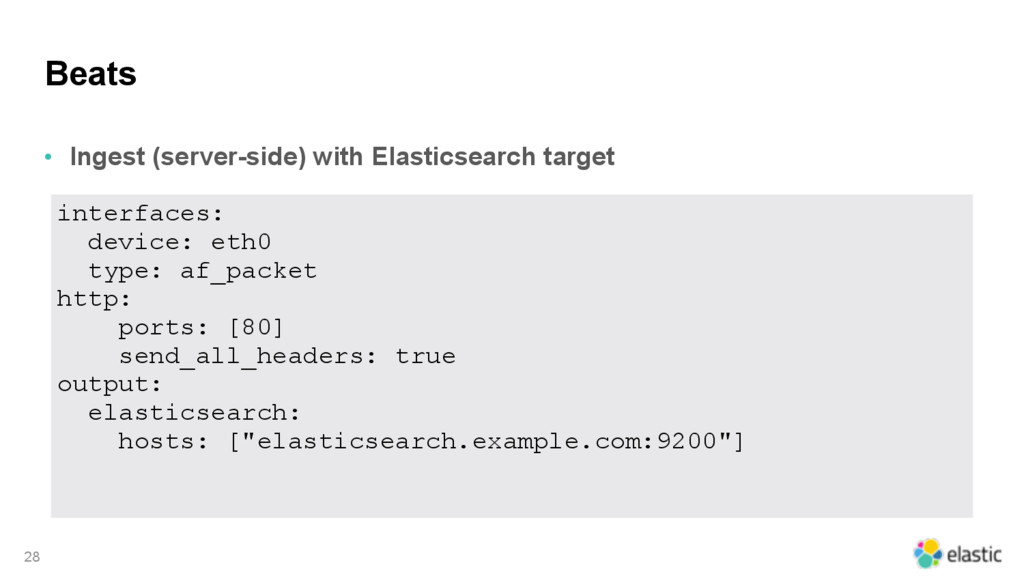
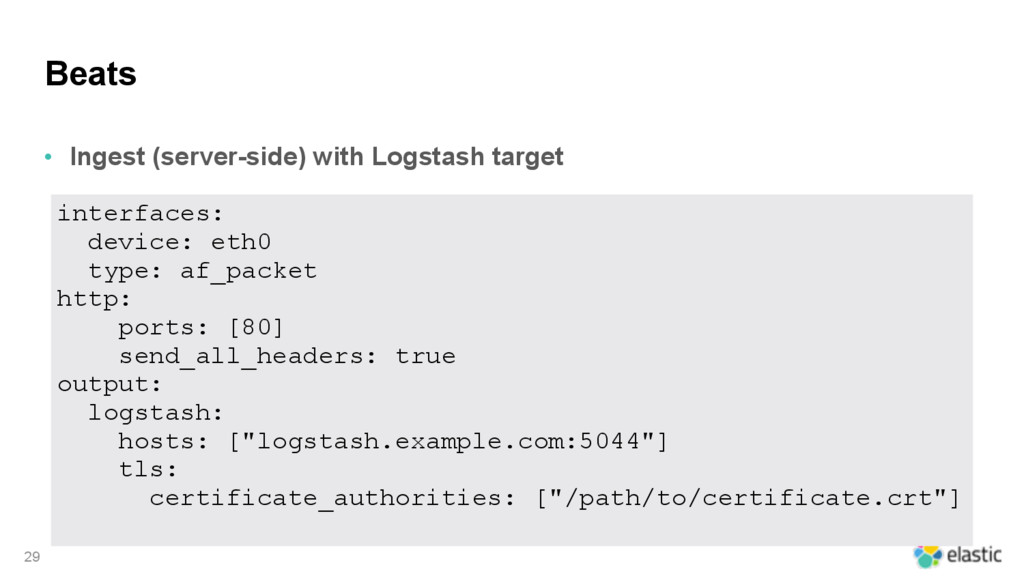
traffic capturing:
    • pcap, which uses the libpcap library and works on most platforms, but
    it’s not the fastest option.
    • af_packet, which uses memory mapped sniffing. This option is faster
    than libpcap and doesn’t require a kernel module, but it’s Linux-
    specific.
    • pf_ring, which makes use of an ntop.org project. This setting
    provides the best sniffing speed, but it requires a kernel module, and
    it’s Linux-specific.
    23

    View Slide

  24. Packet capture: protocols
    • dns
    • http
    • memcache
    • mysql
    • pgsql
    • redis
    • thrift
    • mongodb
    24

    View Slide

  25. HTTP: ports
    • Capture one port:
    • ports: 80
    • Capture multiple ports:
    • ports: [80, 8080, 8000, 5000, 8002]
    25

    View Slide

  26. HTTP: send_headers / send_all_headers
    • Capture all headers:
    • send_all_headers: true
    • Capture only named headers:
    • send_headers: [ "host", "user-agent", "content-
    type", "referer" ]
    26

    View Slide

  27. HTTP: hide_keywords
    • The names of the keyword parameters are case insensitive.
    • The values will be replaced with the 'xxxxx' string. This is useful for
    avoiding storing user passwords or other sensitive information.
    • Only query parameters and top level form parameters are replaced.
    • hide_keywords: ['pass', 'password', 'passwd']
    27

    View Slide

  28. Beats
    • Ingest (server-side) with Elasticsearch target
    28
    interfaces:
    device: eth0
    type: af_packet
    http:
    ports: [80]
    send_all_headers: true
    output:
    elasticsearch:
    hosts: ["elasticsearch.example.com:9200"]

    View Slide

  29. Beats
    • Ingest (server-side) with Logstash target
    29
    interfaces:
    device: eth0
    type: af_packet
    http:
    ports: [80]
    send_all_headers: true
    output:
    logstash:
    hosts: ["logstash.example.com:5044"]
    tls:
    certificate_authorities: ["/path/to/certificate.crt"]

    View Slide

  30. Why send to Logstash?
    • Enrich your data!
    • geoip
    • useragent
    • dns
    • grok
    • kv
    30

    View Slide

  31. Logstash
    • Ingest Beats (Pre-formatted JSON)
    31
    input {
    beats {
    port => 5044
    ssl => true
    ssl_certificate => "/path/to/certificate.crt"
    ssl_key => "/path/to/private.key"
    codec => "json"
    }
    }

    View Slide

  32. Logstash
    • Filters
    32
    filter {
    # Enrich HTTP Packetbeats
    if [type] == "http" and "packetbeat" in [tags] {
    geoip { source => "client_ip" }
    useragent {
    source => "[http][request_headers][user-agent]"
    target => "useragent"
    }
    }
    }

    View Slide

  33. Extended JSON output from Beats + Logstash
    33
    "@timestamp": "2016-01-20T21:40:53.300Z",
    "beat": {
    "hostname": "ip-172-31-46-141",
    "name": "ip-172-31-46-141"
    },
    "bytes_in": 189,
    "bytes_out": 6910,
    "client_ip": "68.180.229.41",
    "client_port": 57739,
    "client_proc": "",
    "client_server": "",
    "count": 1,
    "direction": "in",
    "http": {
    "code": 200,
    "content_length": 6516,
    "phrase": "OK",
    "request_headers": {
    "accept": "*/*",
    "accept-encoding": "gzip",
    "host": "example.com"

    View Slide

  34. Extended JSON output from Beats + Logstash
    34
    "user-agent": "Mozilla/5.0 (compatible; Yahoo! Slurp; http://help.yahoo.com
    help/us/ysearch/slurp)"
    },
    "response_headers": {
    "connection": "keep-alive",
    "content-type": "application/rss+xml; charset=UTF-8",
    "date": "Wed, 20 Jan 2016 21:40:53 GMT",
    "etag": "\"8c0b25ce7ade4b79d5ccf1ebb656fa51\"",
    "last-modified": "Wed, 24 Jul 2013 20:31:04 GMT",
    "link": "; rel=\"https://api.w.org/\"",
    "server": "nginx/1.4.6 (Ubuntu)",
    "transfer-encoding": "chunked",
    "x-powered-by": "PHP/5.5.9-1ubuntu4.14"
    }
    },
    "ip": "172.31.46.141",
    "method": "GET",
    "params": "",
    "path": "/tag/redacted/feed/",
    "port": 80,
    "proc": "",

    View Slide

  35. Extended JSON output from Beats + Logstash
    35
    "query": "GET /tag/redacted/feed/",
    "responsetime": 278,
    "server": "",
    "status": "OK",
    "type": "http",
    "@version": "1",
    "host": "ip-172-31-46-941",
    "tags": [
    "packetbeat"
    ],
    "geoip": {
    "ip": "68.180.229.41",
    "country_code2": "US",
    "country_code3": "USA",
    "country_name": "United States",
    "continent_code": "NA",
    "region_name": "CA",
    "city_name": "Sunnyvale",
    "postal_code": "94089",
    "latitude": 37.42490000000001,
    "longitude": -122.00739999999999,

    View Slide

  36. Extended JSON output from Beats + Logstash
    36
    "dma_code": 807,
    "area_code": 408,
    "timezone": "America/Los_Angeles",
    "real_region_name": "California",
    "location": [
    -122.00739999999999,
    37.42490000000001
    ]
    },
    "useragent": {
    "name": "Yahoo! Slurp",
    "os": "Other",
    "os_name": "Other",
    "device": "Spider"
    }

    View Slide

  37. Logstash + beats (pre-formatted JSON)
    • Pro
    • CPU cost 
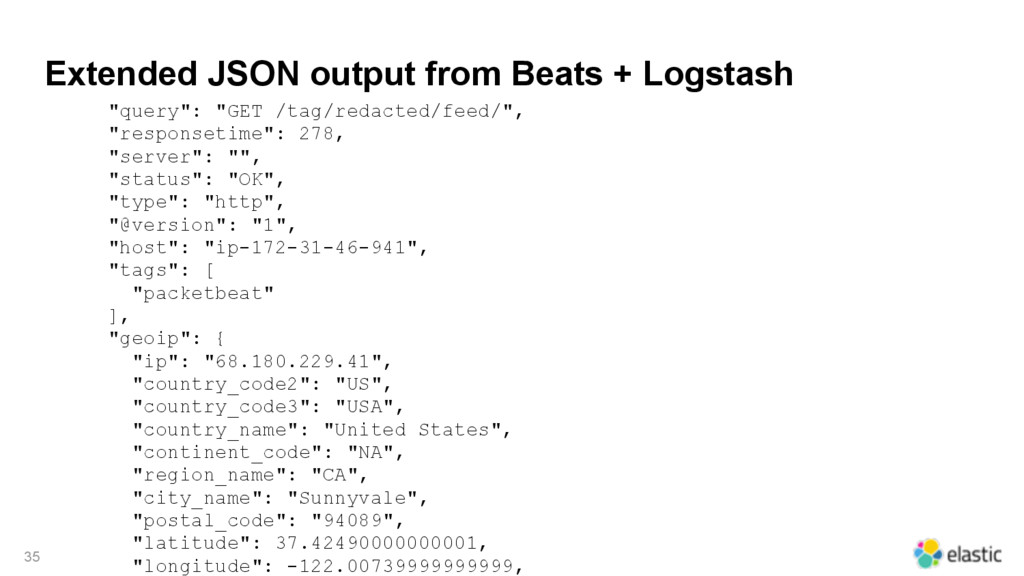
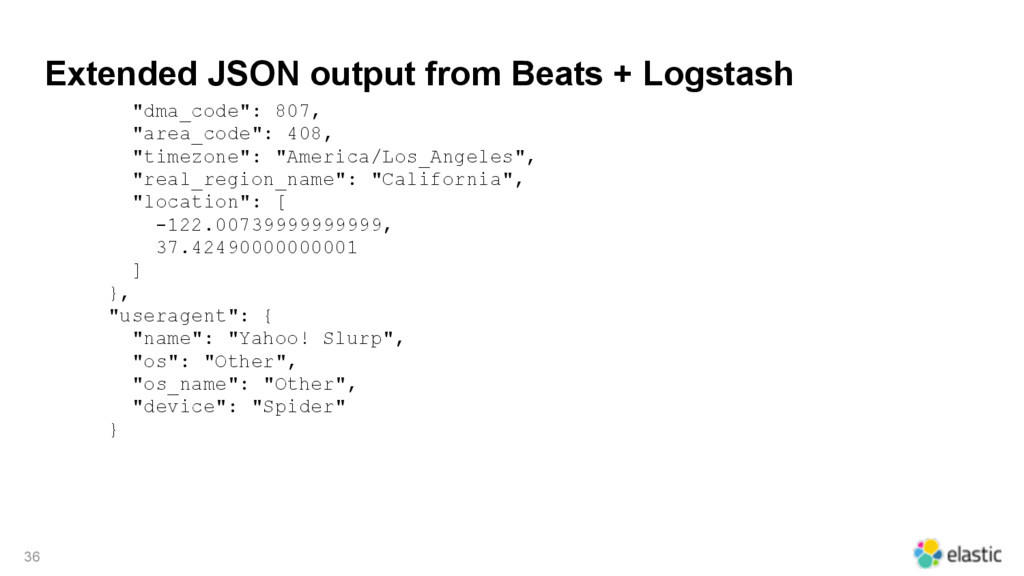
dramatically reduced (Logstash side)
    • Simple configuration to capture everything.
    • Logstash not necessary!
    • Useful to enrich data: geoip, useragent, headers, etc.
    • Con
    • Cannot directly monitor SSL traffic
    • CPU cost (server side) scales with traffic volume. Might be higher for
    heavy traffic.
    • Uncaptured packet data is unrecoverable.
    37

    View Slide

  38. Evolution?
    Is one path better than another?
    38

    View Slide

  39. Evolution?
    Is one path better than another?
    39
    • Unstructured log data
    • Structured log data
    • Captured packet data

    View Slide

  40. Conclusions
    • There are a lot of ways to monitor your traffic and put the data into
    Elasticsearch. Not all of them require log files any more.
    • With many options, choose the ingest scenario that works for you.
    • There's also filebeat, topbeat, and several community contributed
    beats available.
    • Don't overlook enriching your data. There's a goldmine in there!
    40

    View Slide

  41. ‹#›
    Questions?
    I'll be here all night…

    View Slide