Upgrade to Pro — share decks privately, control downloads, hide ads and more …

What's new in Logstash 5.0

What's new in Logstash 5.0

Logstash 5.0 is upon us. What is new in Logstash 5.0? Why should I upgrade? What are the pitfalls? These questions will be answered in this 45 minute presentation.
Questions aswered include:
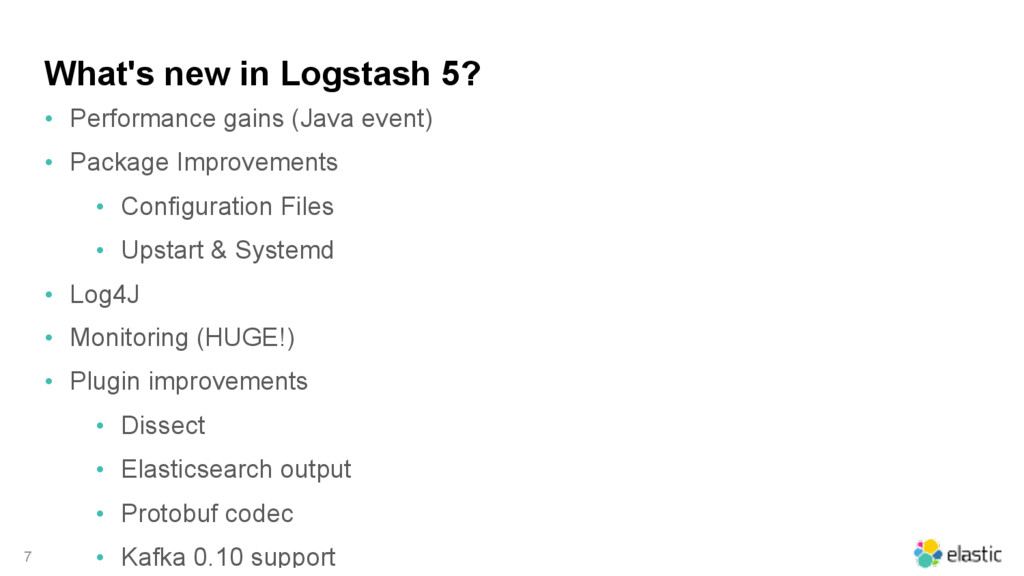
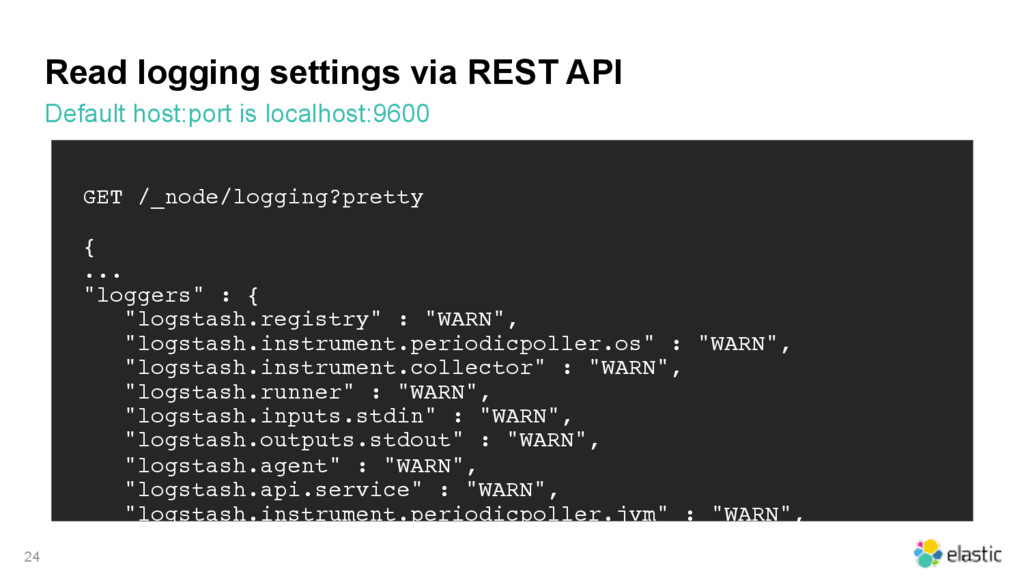
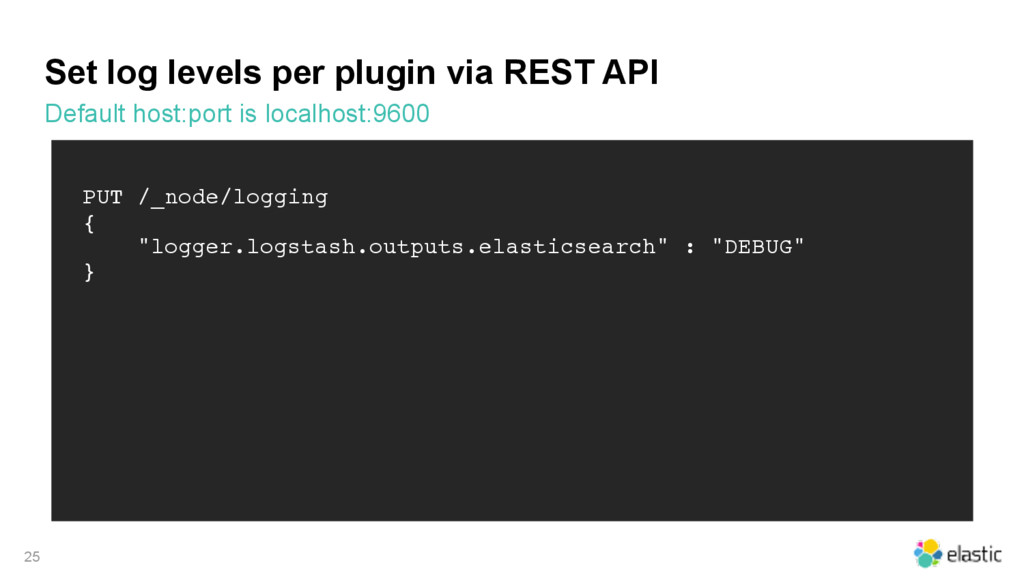
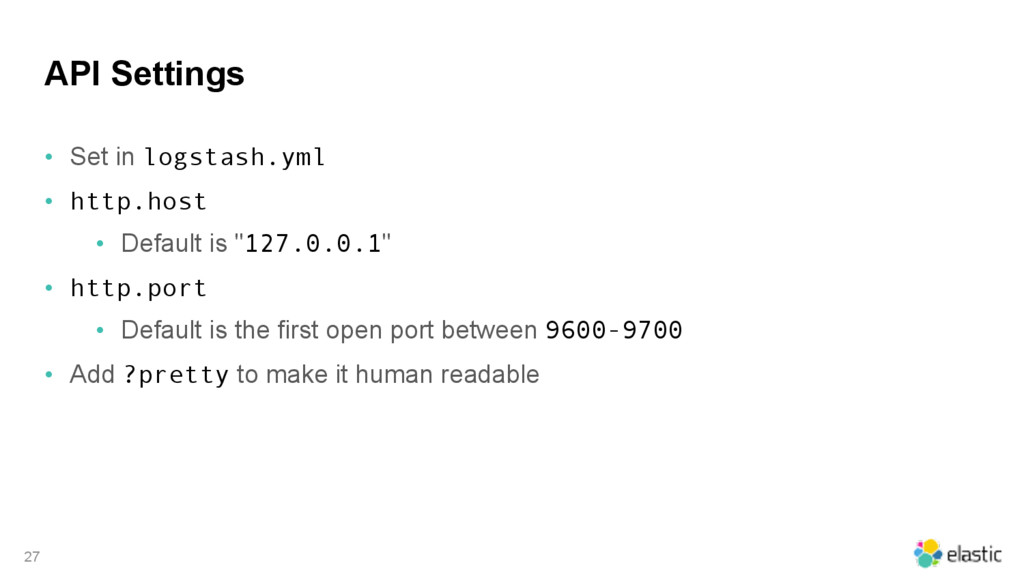
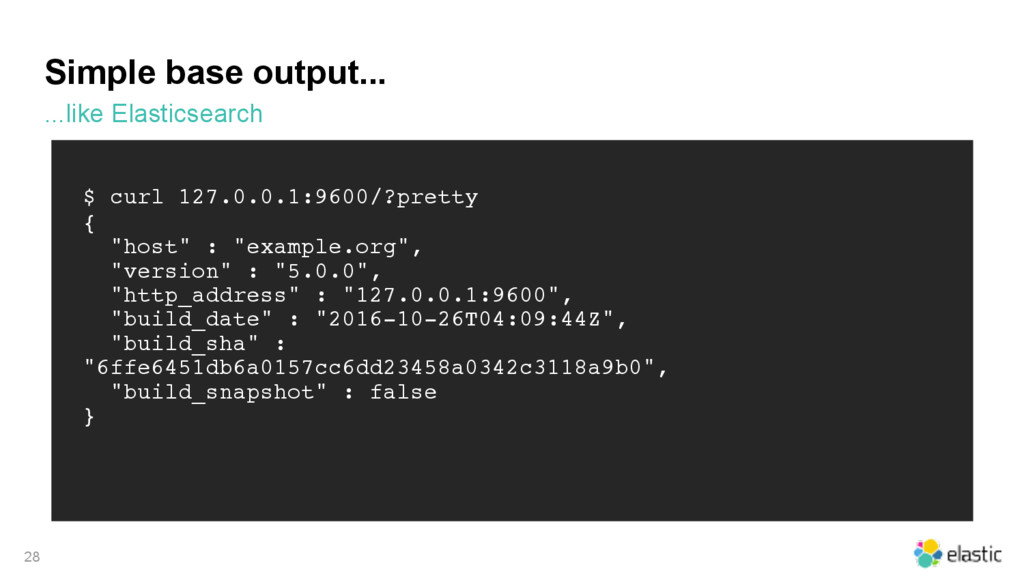
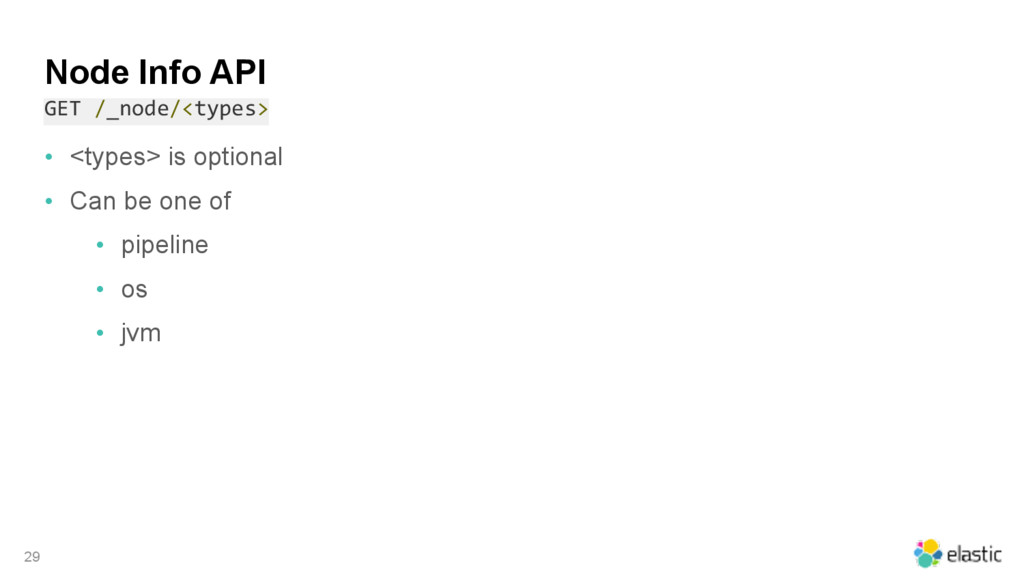
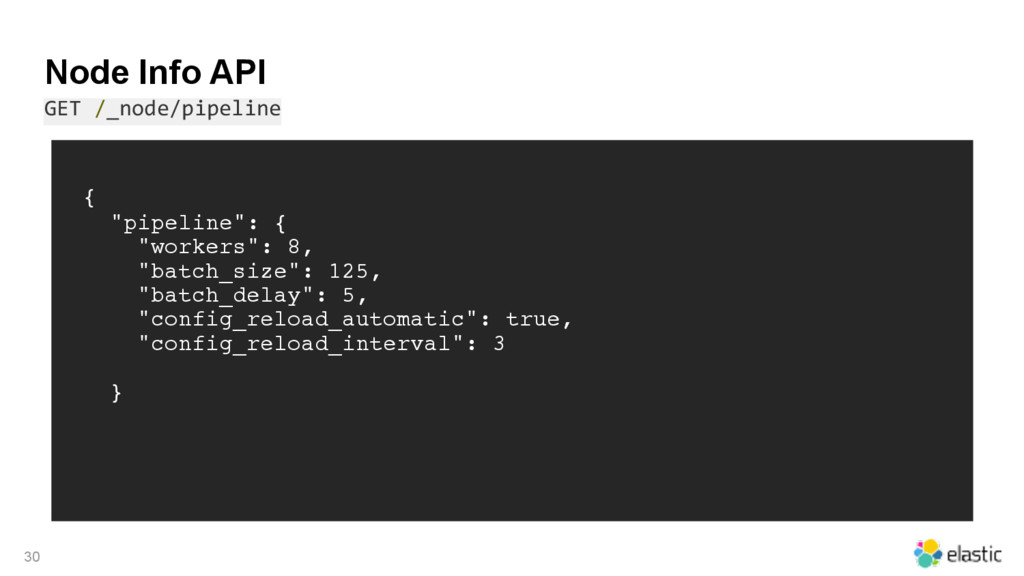
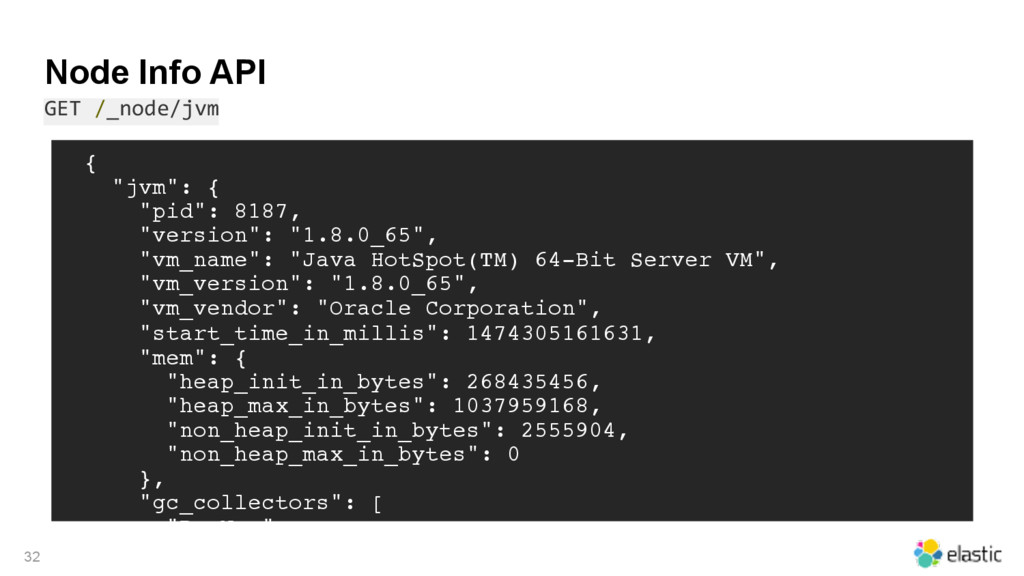
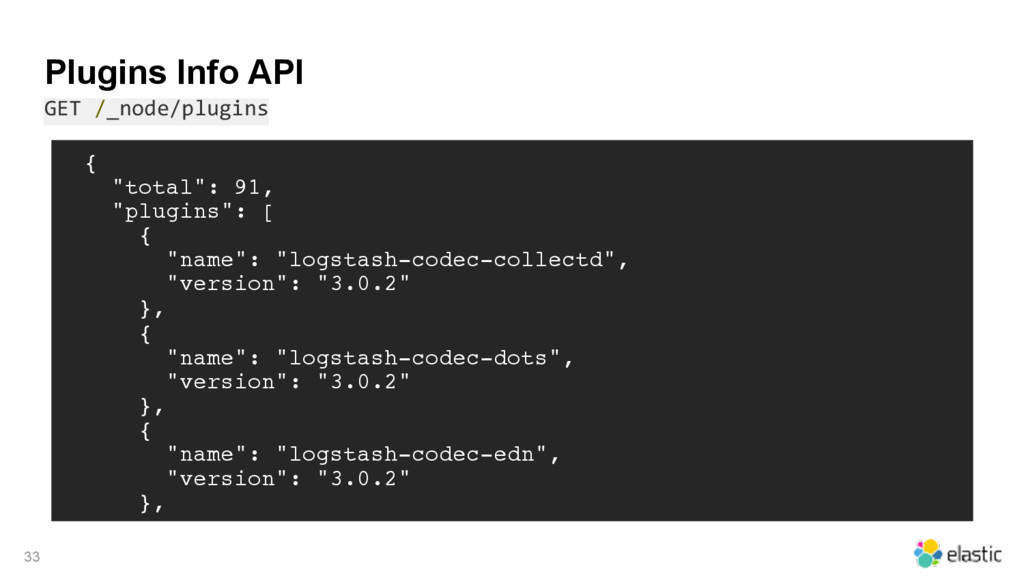
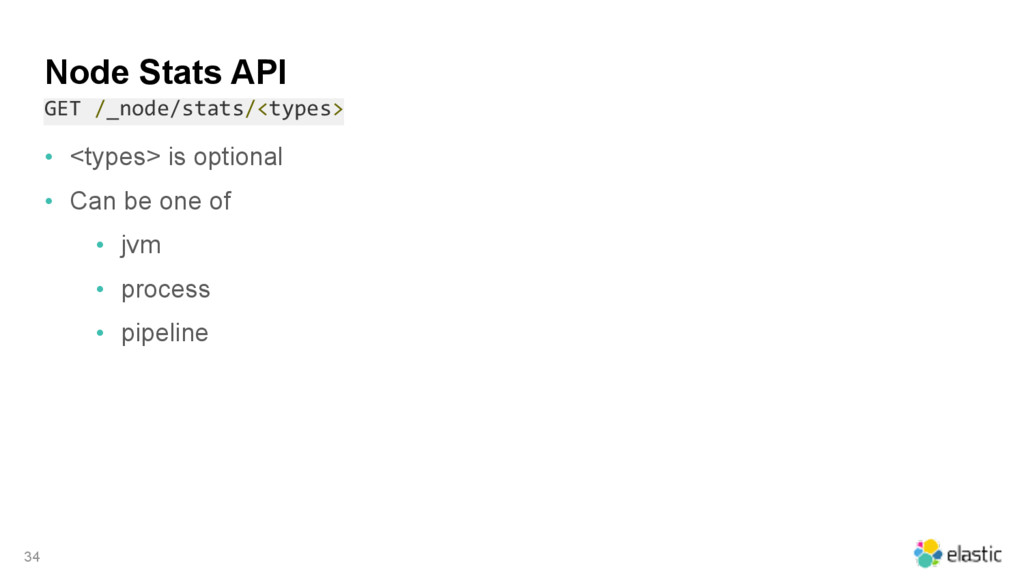
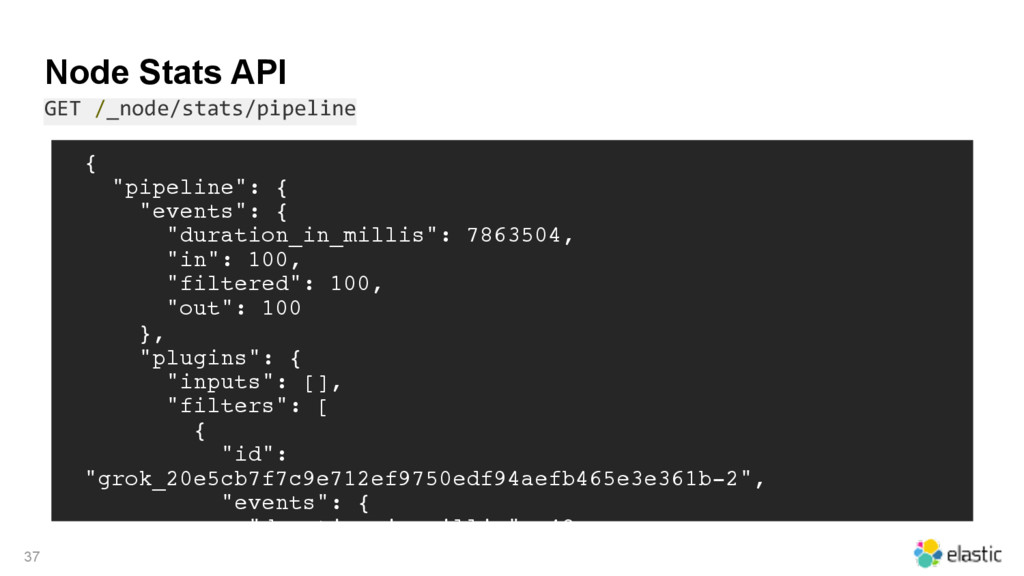
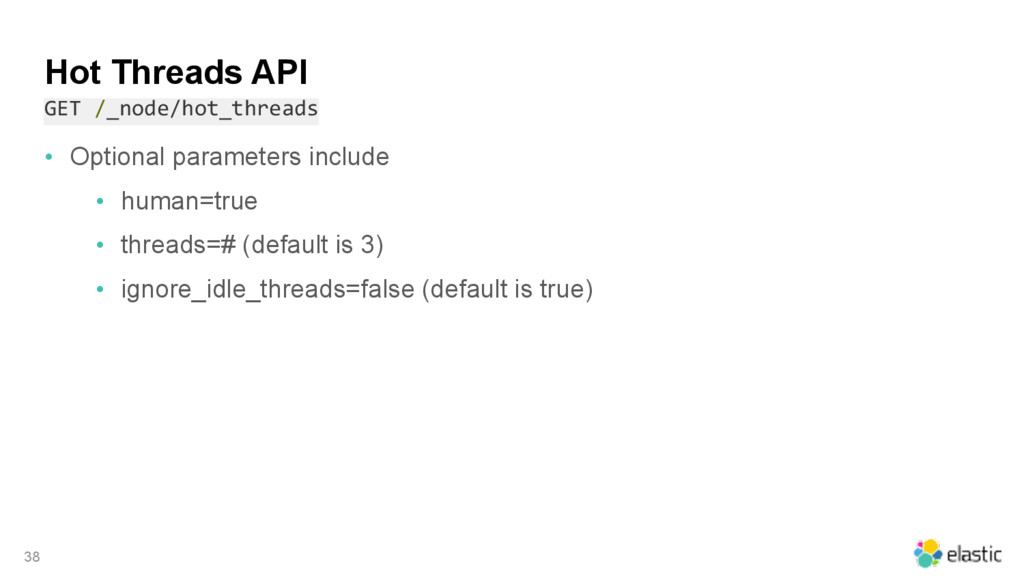
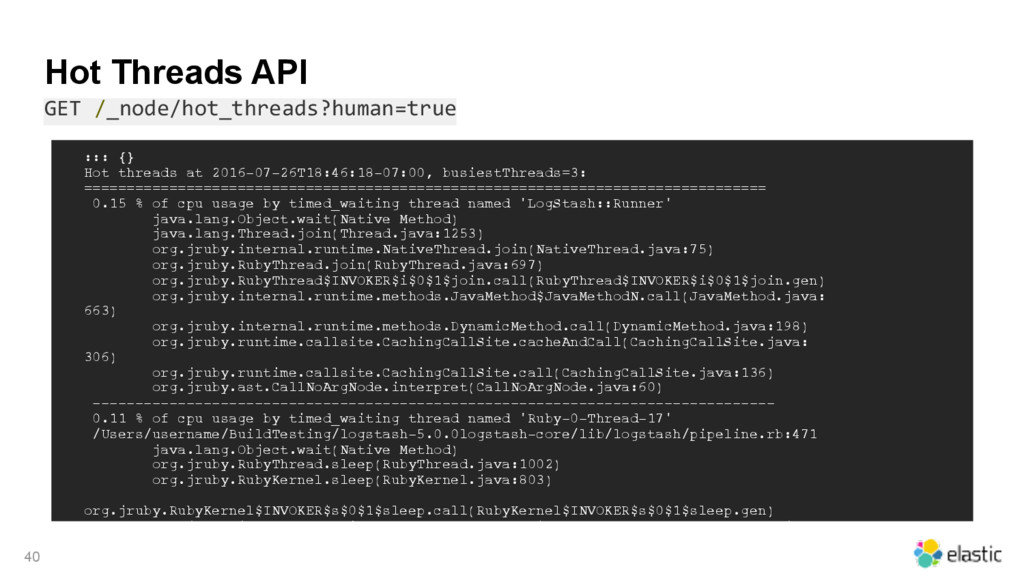
how to make use of the new Logstash Monitoring API, to monitor throughput and plugin-level performance,
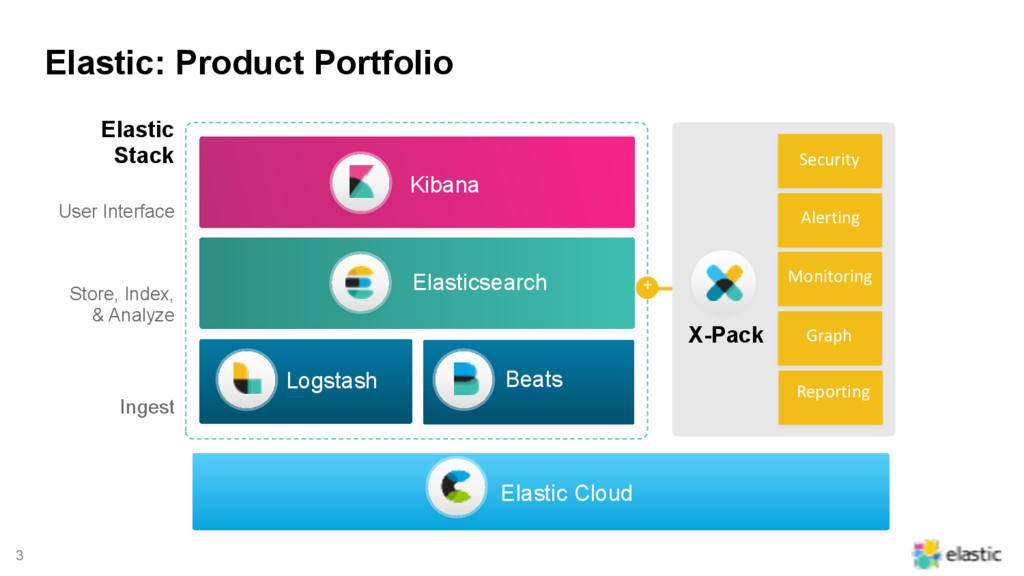
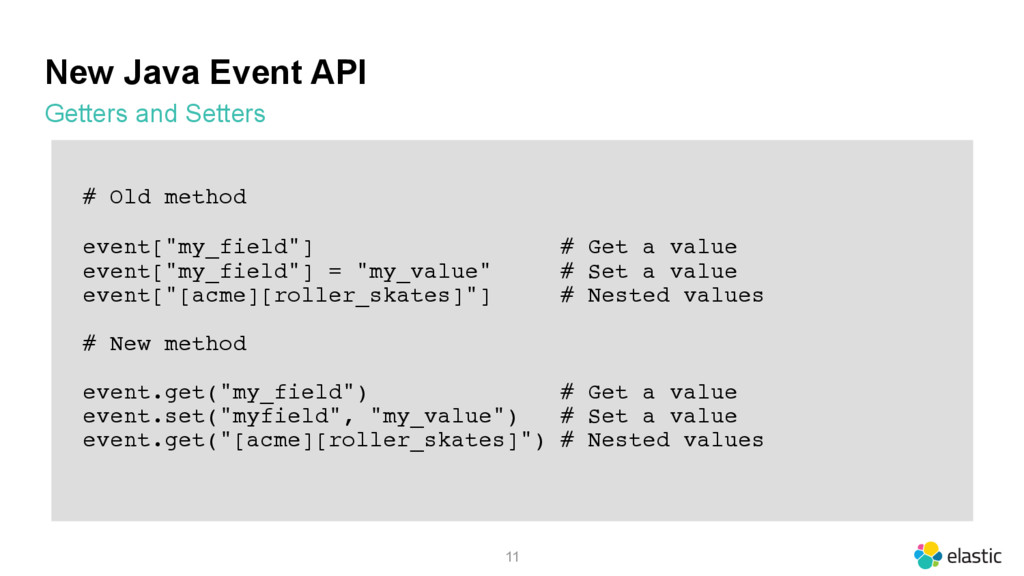
changes in the plugin architecture and associated APIs,
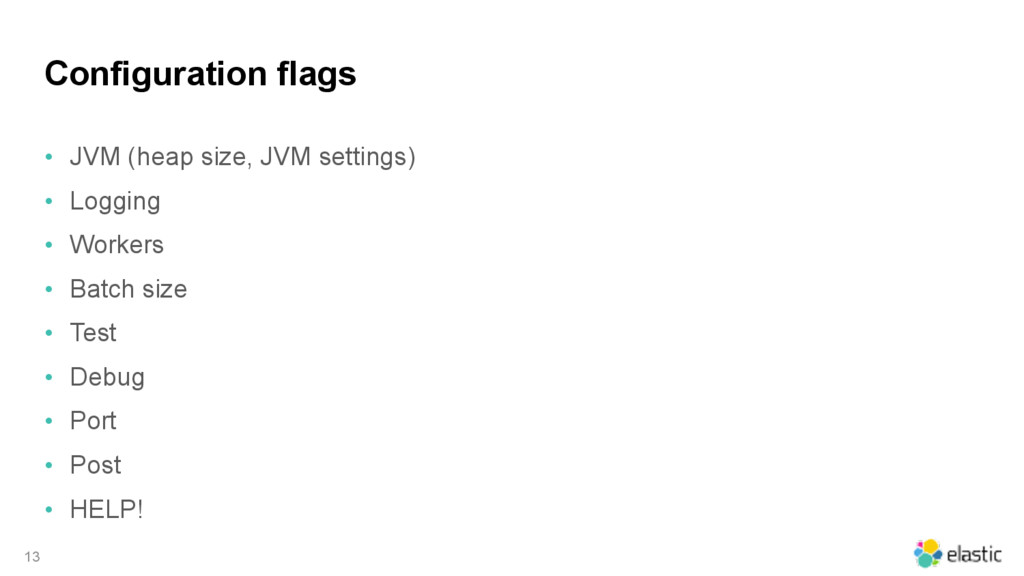
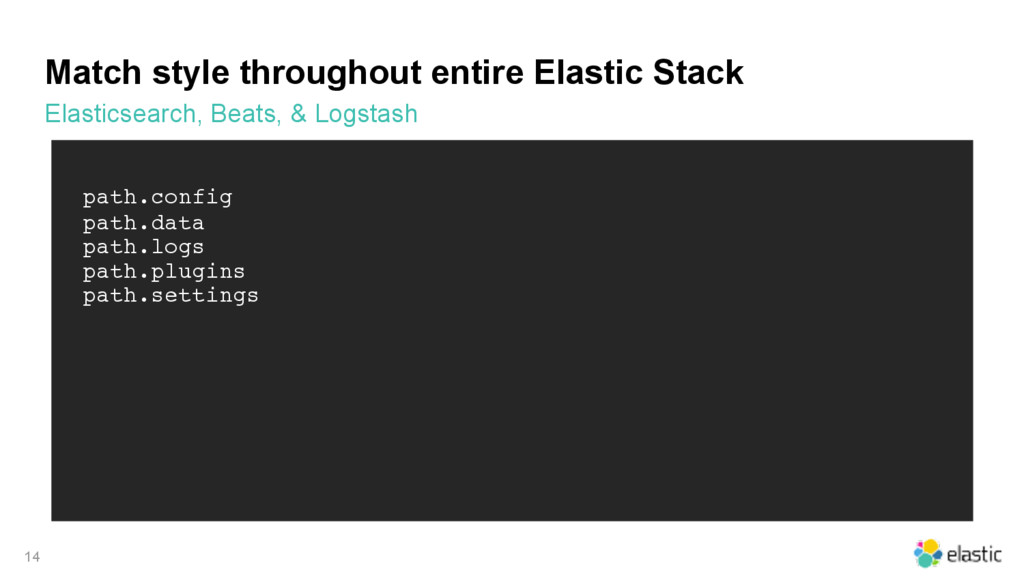
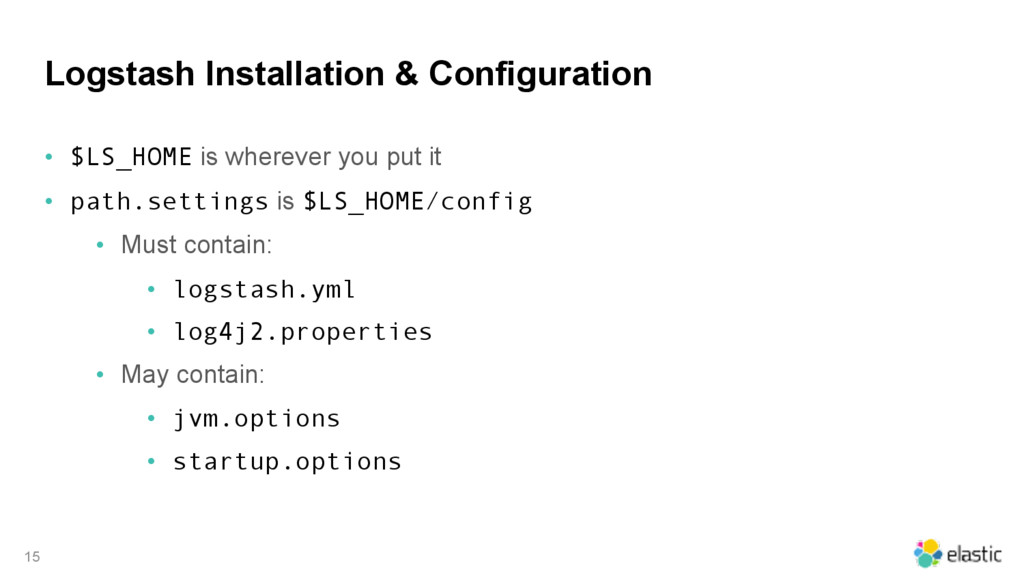
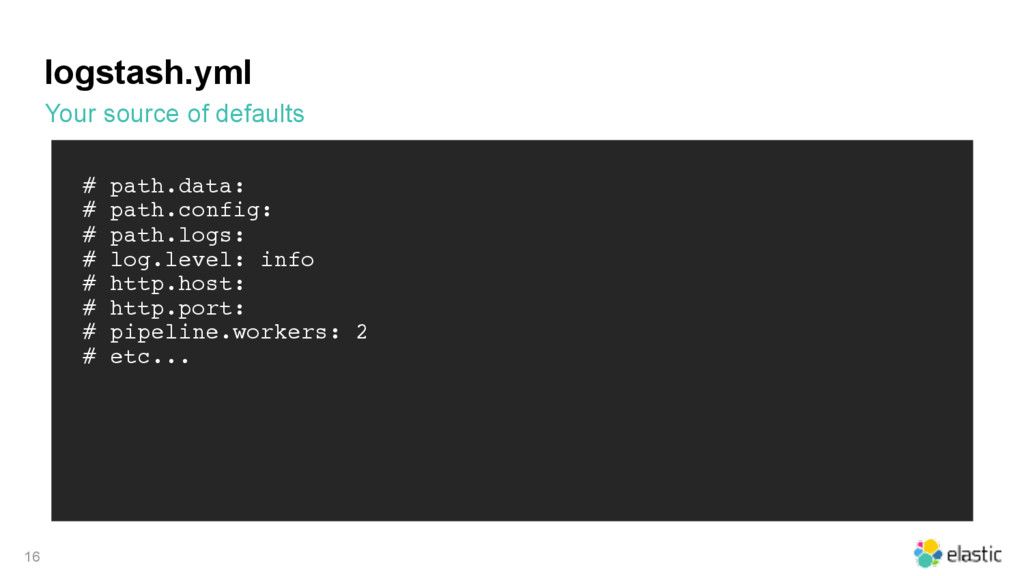
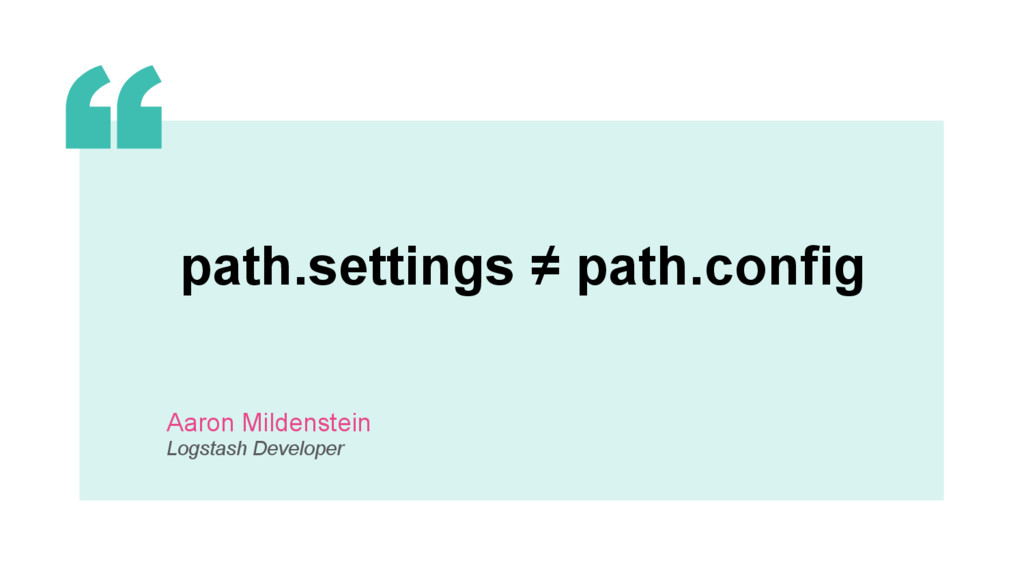
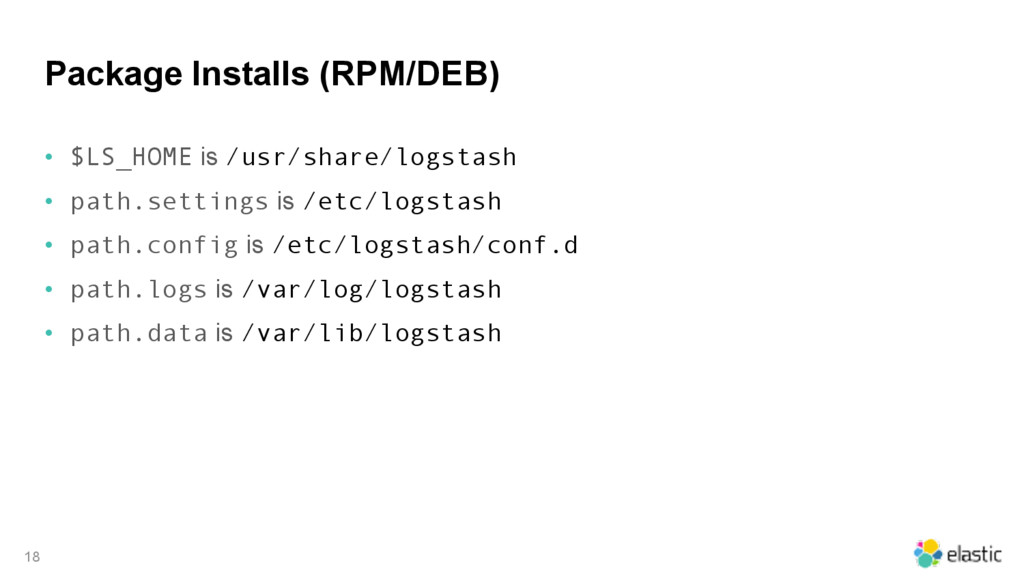
packaging and directory path changes, and
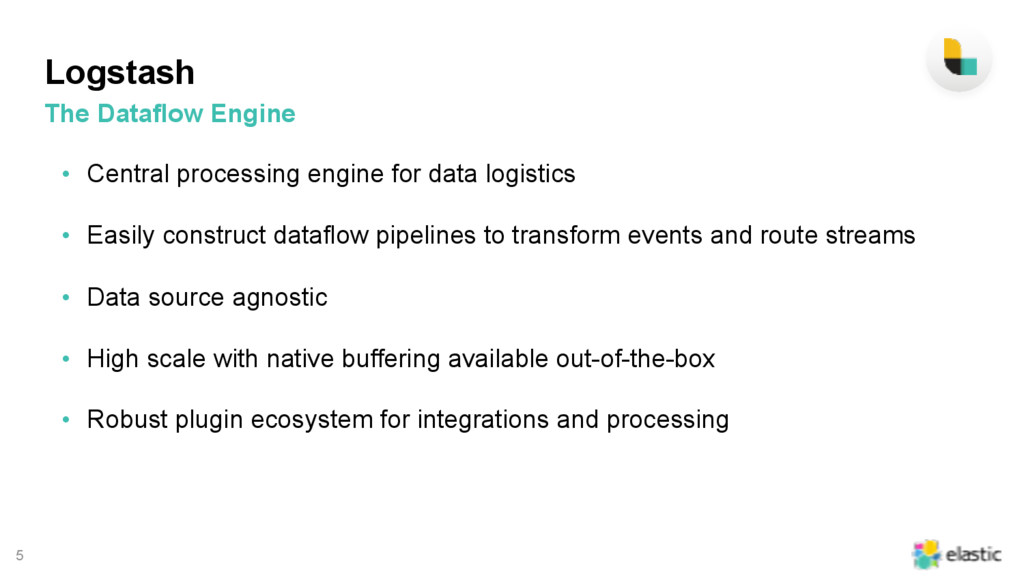
why this is a good thing: much more than will fit in this space here!

Presentation given at NLUUG 2016.

Aaron Mildenstein

November 17, 2016
Tweet

More Decks by Aaron Mildenstein

Other Decks in Programming

Transcript

  1. 3 Elastic Cloud Security Monitoring Alerting X-Pack Kibana User Interface

    Elasticsearch Store, Index,
 & Analyze Ingest Logstash Beats + Elastic Stack Elastic: Product Portfolio Reporting Graph
  2. 4 Beats Log Files Metrics Wire Data Datastore Web APIs

    Social Sensors Kafka Redis Messaging Queue Logstash ES-Hadoop Elasticsearch Kibana Nodes (X) Master Nodes (3) Ingest Nodes (X) Data Nodes – Hot (X) Data Notes – Warm (X) Instances (X) your{beat} X-Pack X-Pack Custom UI LDAP Authentication AD Notification SSO The Elastic Stack (& Friends) Hadoop Ecosystem
  3. 5 Logstash The Dataflow Engine • Central processing engine for

    data logistics • Easily construct dataflow pipelines to transform events and route streams • Data source agnostic • High scale with native buffering available out-of-the-box • Robust plugin ecosystem for integrations and processing
  4. 6 Data Source Discovery Ingest All the Things Logs &

    Files Web Apps & APIs Metrics Network Wire Data Data Stores Data Streams
  5. What's new in Logstash 5? • Performance gains (Java event)

    • Package Improvements • Configuration Files • Upstart & Systemd • Log4J • Monitoring (HUGE!) • Plugin improvements • Dissect • Elasticsearch output • Protobuf codec • Kafka 0.10 support 7
  6. Benchmark performance increase 10 Logstash Config 2.x 5.0 % Simple

    line in / out 95100 170160 79 Simple line in / json out 116400 168163 44 json codec in / out 58216 99146 70 line in / json filter / json out 57879 68417 18 apache in / json out 92737 145029 56 apache in / grok / json out 55129 65155 18 syslog in / json out 18663 22248 19
  7. New Java Event API Getters and Setters 11 # Old

    method event["my_field"] # Get a value event["my_field"] = "my_value" # Set a value event["[acme][roller_skates]"] # Nested values # New method event.get("my_field") # Get a value event.set("myfield", "my_value") # Set a value event.get("[acme][roller_skates]") # Nested values
  8. Configuration flags • JVM (heap size, JVM settings) • Logging

    • Workers • Batch size • Test • Debug • Port • Post • HELP! 13
  9. Match style throughout entire Elastic Stack Elasticsearch, Beats, & Logstash

    14 path.config path.data path.logs path.plugins path.settings
  10. Logstash Installation & Configuration • $LS_HOME is wherever you put

    it • path.settings is $LS_HOME/config • Must contain: • logstash.yml • log4j2.properties • May contain: • jvm.options • startup.options 15
  11. logstash.yml Your source of defaults 16 # path.data: # path.config:

    # path.logs: # log.level: info # http.host: # http.port: # pipeline.workers: 2 # etc...
  12. Package Installs (RPM/DEB) • $LS_HOME is /usr/share/logstash • path.settings is

    /etc/logstash • path.config is /etc/logstash/conf.d • path.logs is /var/log/logstash • path.data is /var/lib/logstash 18
  13. Non-package Installs (tar/zip/source) • $LS_HOME is where you put it

    • path.settings is $LS_HOME/config • path.config is not defined • path.logs is STDOUT • path.data is $LS_HOME/data 19
  14. Start Logstash from the command-line Minimal 20 $LS_HOME/bin/logstash \ --path.settings

    /path/to/settings_dir sudo -u logstash /usr/share/logstash/bin/logstash sudo -u logstash /usr/share/logstash/bin/logstash \ --path.settings /etc/logstash \ --config.test_and_exit
  15. jvm.options • At start time, $LS_HOME/bin/logstash.lib.sh initializes. If $LS_JVM_OPTS is

    undefined, it • Tests for the existence of jvm.options in • /etc/logstash • $LS_HOME/config • Sets $LS_JVM_OPTS to be whichever it finds first • Overrides internal defaults with settings in jvm.options 21
  16. startup.options • Read only by system-install script (automatic after package

    install) • Detects startup system used (SysV init, upstart, systemd) • Installs startup scripts according to settings in startup.options file • Can use this concept to control multiple, local instances of Logstash: • Make new settings dir with log4j2.properties, logstash.yml, startup.options • Adjust all settings in these files accordingly (paths, logging, etc.) • Run: 
 $LS_HOME/bin/system-install /path/to/startup.options • systemctl start logstash2.service 22
  17. Read logging settings via REST API Default host:port is localhost:9600

    24 GET /_node/logging?pretty { ... "loggers" : { "logstash.registry" : "WARN", "logstash.instrument.periodicpoller.os" : "WARN", "logstash.instrument.collector" : "WARN", "logstash.runner" : "WARN", "logstash.inputs.stdin" : "WARN", "logstash.outputs.stdout" : "WARN", "logstash.agent" : "WARN", "logstash.api.service" : "WARN", "logstash.instrument.periodicpoller.jvm" : "WARN", "logstash.pipeline" : "WARN", "logstash.codecs.line" : "WARN"
  18. Set log levels per plugin via REST API Default host:port

    is localhost:9600 25 PUT /_node/logging { "logger.logstash.outputs.elasticsearch" : "DEBUG" }
  19. API Settings • Set in logstash.yml • http.host • Default

    is "127.0.0.1" • http.port • Default is the first open port between 9600-9700 • Add ?pretty to make it human readable 27
  20. Simple base output... ...like Elasticsearch 28 $ curl 127.0.0.1:9600/?pretty {

    "host" : "example.org", "version" : "5.0.0", "http_address" : "127.0.0.1:9600", "build_date" : "2016-10-26T04:09:44Z", "build_sha" : "6ffe6451db6a0157cc6dd23458a0342c3118a9b0", "build_snapshot" : false }
  21. • <types> is optional • Can be one of •

    pipeline • os • jvm 29 Node Info API GET /_node/<types>
  22. Node Info API GET /_node/pipeline 30 { "pipeline": { "workers":

    8, "batch_size": 125, "batch_delay": 5, "config_reload_automatic": true, "config_reload_interval": 3 }
  23. Node Info API GET /_node/os 31 { "os": { "name":

    "Mac OS X", "arch": "x86_64", "version": "10.11.2", "available_processors": 8 }
  24. Node Info API GET /_node/jvm 32 { "jvm": { "pid":

    8187, "version": "1.8.0_65", "vm_name": "Java HotSpot(TM) 64-Bit Server VM", "vm_version": "1.8.0_65", "vm_vendor": "Oracle Corporation", "start_time_in_millis": 1474305161631, "mem": { "heap_init_in_bytes": 268435456, "heap_max_in_bytes": 1037959168, "non_heap_init_in_bytes": 2555904, "non_heap_max_in_bytes": 0 }, "gc_collectors": [ "ParNew", "ConcurrentMarkSweep"
  25. Plugins Info API GET /_node/plugins 33 { "total": 91, "plugins":

    [ { "name": "logstash-codec-collectd", "version": "3.0.2" }, { "name": "logstash-codec-dots", "version": "3.0.2" }, { "name": "logstash-codec-edn", "version": "3.0.2" }, . .
  26. • <types> is optional • Can be one of •

    jvm • process • pipeline 34 Node Stats API GET /_node/stats/<types>
  27. Node Stats API GET /_node/stats/jvm 35 { "jvm": { "threads":

    { "count": 33, "peak_count": 34 }, "mem": { "heap_used_in_bytes": 276974824, "heap_used_percent": 13, "heap_committed_in_bytes": 519045120, "heap_max_in_bytes": 2075918336, "non_heap_used_in_bytes": 182122272, "non_heap_committed_in_bytes": 193372160, "pools": { "survivor": {
  28. Node Stats API GET /_node/stats/process 36 { "process": { "open_file_descriptors":

    60, "peak_open_file_descriptors": 65, "max_file_descriptors": 10240, "mem": { "total_virtual_in_bytes": 5364461568 }, "cpu": { "total_in_millis": 101294404000, "percent": 0 } }
  29. Node Stats API GET /_node/stats/pipeline 37 { "pipeline": { "events":

    { "duration_in_millis": 7863504, "in": 100, "filtered": 100, "out": 100 }, "plugins": { "inputs": [], "filters": [ { "id": "grok_20e5cb7f7c9e712ef9750edf94aefb465e3e361b-2", "events": { "duration_in_millis": 48, "in": 100,
  30. • Optional parameters include • human=true • threads=# (default is

    3) • ignore_idle_threads=false (default is true) 38 Hot Threads API GET /_node/hot_threads
  31. Hot Threads API GET /_node/hot_threads 39 { "hot_threads": { "time":

    "2016-09-19T10:44:13-07:00", "busiest_threads": 3, "threads": [ { "name": "LogStash::Runner", "percent_of_cpu_time": 0.17, "state": "timed_waiting", "traces": [ "java.lang.Object.wait(Native Method)", "java.lang.Thread.join(Thread.java:1253)", "org.jruby.internal.runtime.NativeThread.join(NativeTh read.java:75)", "org.jruby.RubyThread.join(RubyThread.java: 697)",
  32. Hot Threads API GET /_node/hot_threads?human=true 40 ::: {} Hot threads

    at 2016-07-26T18:46:18-07:00, busiestThreads=3: ================================================================================ 0.15 % of cpu usage by timed_waiting thread named 'LogStash::Runner' java.lang.Object.wait(Native Method) java.lang.Thread.join(Thread.java:1253) org.jruby.internal.runtime.NativeThread.join(NativeThread.java:75) org.jruby.RubyThread.join(RubyThread.java:697) org.jruby.RubyThread$INVOKER$i$0$1$join.call(RubyThread$INVOKER$i$0$1$join.gen) org.jruby.internal.runtime.methods.JavaMethod$JavaMethodN.call(JavaMethod.java: 663) org.jruby.internal.runtime.methods.DynamicMethod.call(DynamicMethod.java:198) org.jruby.runtime.callsite.CachingCallSite.cacheAndCall(CachingCallSite.java: 306) org.jruby.runtime.callsite.CachingCallSite.call(CachingCallSite.java:136) org.jruby.ast.CallNoArgNode.interpret(CallNoArgNode.java:60) -------------------------------------------------------------------------------- 0.11 % of cpu usage by timed_waiting thread named 'Ruby-0-Thread-17' /Users/username/BuildTesting/logstash-5.0.0logstash-core/lib/logstash/pipeline.rb:471 java.lang.Object.wait(Native Method) org.jruby.RubyThread.sleep(RubyThread.java:1002) org.jruby.RubyKernel.sleep(RubyKernel.java:803) org.jruby.RubyKernel$INVOKER$s$0$1$sleep.call(RubyKernel$INVOKER$s$0$1$sleep.gen) org.jruby.internal.runtime.methods.JavaMethod$JavaMethodN.call(JavaMethod.java: 667)
  33. ‹#› If you have to use grok, you've already lost...

    Jordan Sissel Creator of Logstash & Grok
  34. Grok is amazingly powerful, but... • In some cases, it's

    like swatting a fly with a sledgehammer • Regular expressions are powerful, but mystical • Greedy lookups kill performance because of ReDoS 43
  35. ‹#› The regular expression denial of service (ReDoS) is an

    algorithmic complexity attack that produces a denial-of-service by providing a regular expression that takes a very long time to evaluate. https://en.wikipedia.org/wiki/ReDoS
  36. Introducing: Dissect • Field extraction by separator • Specify the

    patterns of delimiters between the fields of interest. • Queues up the specified delimiters and searches the source once from left to right, finding successive delimiters in the queue. • Uses different search algorithms for 1, 2 and 3+ byte delimiters • Written in Java with a very thin JRuby extension wrapper • The format of the patterns of fields and delimiters is similar to Grok: • "<%{priority}>%{syslog_timestamp} %{+syslog_timestamp} %{+syslog_timestamp} %{logsource} %{rest}" 45
  37. • Field extraction by separator • Specify the patterns of

    delimiters between the fields of interest. • Queues up the specified delimiters and searches the source once from left to right, finding successive delimiters in the queue. • Uses different search algorithms for 1, 2 and 3+ byte delimiters • Written in Java with a very thin JRuby extension wrapper • The format of the patterns of fields and delimiters is similar to Grok: • "<%{priority}>%{syslog_timestamp} %{+syslog_timestamp} %{+syslog_timestamp} %{logsource} %{rest}" Introducing: Dissect 46
  38. Dissect Field Types • Normal • "%{priority}" • Skip •

    "%{}" or "%{?priority}" • Append • "%{syslog_timestamp} %{+syslog_timestamp} %{+syslog_timestamp}" 47
  39. Dissect Field Types • Append, with the order modifier •

    %{+some_field/2} • An order modifier, /digits, allows one to reorder the append sequence. e.g. for a text of 1 2 3 go, this %{+a/2} %{+a/1} %{+a/4} %{+a/3} will build a key/value of a => 2 1 go 3 • Append fields without an order modifier will append in declared order. e.g. for a text of 1 2 3 go, this %{a} %{b} %{+a} will build two key/values of 
 a => 1 3 go, b => 2 48
  40. Dissect Field Types • Indirect • The found value is

    added to the Event using the found value of another field as the key. • The key is prefixed with an &, e.g. %{&some_field} • The key is indirectly sourced from the value of some_field • With a source text of: error: some_error, some_description • error: %{?err}, %{&err} will build a key/value where • some_error => some_description 49
  41. Better performance? Yes! 50 Workers 1 2 4 Grok +

    CSV 4824 8706 15680 Dissect 17197 30759 53213
  42. Brief mentions • Elasticsearch output plugin • Works out of

    the box with Elasticsearch 5.0.0. • Threadsafe to take better advantage of the recent changes in the pipeline architecture. • A new connection pool to efficiently reuse connections to Elasticsearch • Exponential backoff for connection retries • Better handling for sniffing. • Remains compatible with Elasticsearch 5.x, 2.x, and even 1.x. 51
  43. Brief mentions • Kafka 0.10 support • New security features

    (SSL, client based auth, access control) • Improved consumer API • This Logstash release provides out of the box support for SSL encryption and client auth features in Kafka. 52
  44. Brief mentions • Google protobuf codec • Parse protobuf messages

    • Convert them to Logstash Events • Community contribution from Inga Feick. 53
  45. Resources ‒ https://www.elastic.co (Website) ‒ https://www.elastic.co/learn (Learning Resources) ‒ https://www.elastic.co/community/meetups

    (Meetups) ‒ https://www.elastic.co/community/newsletter (News) ‒ https://discuss.elastic.co/ (Discussion Forum) ‒ https://github.com/elastic/ (Github) ‒ https://www.elastic.co/services (Support/Consulting) ‒ IRC: #elasticsearch, #logstash, #kibana on freenode 54 We like to help!!
  46. 56 Web : www.elastic.co Products : https://www.elastic.co/products Forums : https://discuss.elastic.co/

    Community : https://www.elastic.co/community/meetups Twitter : @elastic Thank You