Upgrade to Pro — share decks privately, control downloads, hide ads and more …

Urban Sanitation in India - a snapshot

Pavan Kumar
October 15, 2012

Urban Sanitation in India - a snapshot

Pavan Kumar

October 15, 2012
Tweet

Other Decks in Research

Transcript

  1. 2 Contents 1. Over view of the Scenario 2. Policies

    and Schemes in India 3. Key Issues and Challenges 4. Way Forward
  2. 3 • 4861 out of 5161 cities/towns do not have

    (even partial) sewerage network • 18 per cent of urban households defecate in the open • Lack of treatment of wastewater is costing India $15 billion in treating water-borne diseases. • The cost per DALY due to poor sanitation is estimated at Rs. 5400 and due to poor hygiene practices at Rs.900 (HPEC 2011). • Poor coverage of wastewater treatment – less than 25% of all waste water is treated. Indian Maths of Urban Sanitation? Class I cities (MLD) Class II cities (MLD)
  3. 4 Wealth-based differentials …. 94 94 98 38 57 74

    14 22 34 4 9 15 1 4 5 0 10 20 30 40 50 60 70 80 90 100 1992-93 1996-99 2005-06 % of households with toilets Richest Quntile 2nd Richest Quintile Middle 2nd Poorest Poorest Quintile Source: ADB (2009) • None of the 423 study cities are “healthy” and “clean”. Only 4 cities fared better & 190 cities are on the brink of emergency (MoUD, 2010). • Pressure on freshwater resources - about 2500 million litres are disposed directly into the Ganges River alone and about 4,250 million litres into its tributaries. Indian Maths of Urban Sanitation?
  4. 5 … and the deluge has come and yet to

    come !!! • India’s urban population to increase from 377 million in 2011 to 600 million in 2031 • Increasing peripheral expansion of many cities and towns (HPEC, 2011 and World Bank 2011), where there will be huge demand for urban services. • Phenomenal increase of 2,774 new “census towns” – greater than the number of such new towns identified in all of the 20th century. • Large proportion of population in slums – about 94 million
  5. 6 Policies and Schemes…. 1980s 1990s 2000s 1. IDSMT 2.

    ILCS Mega City Scheme 1. JNNURM – I 2. Hand Book on Service Level benchmarking 3. NUSP – CSP 4. RAY – SFCP 5. JNNRUM – II?
  6. 7 Integrated Low Cost Sanitation Scheme(ILCS) • The scheme was

    introduced in 1980 • The main objective of the scheme is to convert latrines into low cost pour flush latrines • 911 towns had been declared as scavenger free • 11th Plan Allocation was Rs 200 crore; spending has been low • The scheme was introduced in 1993-94 • 676 projects costing Rs 8626 crore • 50% of project cost has to be met from institutional finance/capital market. • 75% of the Central and State shares would be recovered & ploughed back into the Revolving Fund • The scheme was subsumed under JNNURM Mega City Scheme
  7. 8 Integrated Development of Small and Medium Towns(IDSMT) • The

    scheme was introduced in 1979-80 • Applicable to towns/cities with population up to 5 lakhs • Total central assistance was about Rs 1100 crore (another Rs 707 crore by states) JNNURM • 4 sub-missions – UIG, UIDSSMT , BSUP and IHSDP • Adopted in a reform-liked funding approach • CDP – identifying city’s development priorities through stakeholder participation • Progress of both fund utilisation and reforms under the programme has been tardy
  8. 9 National Urban Sanitation Policy (NUSP) Extent of the Policy:

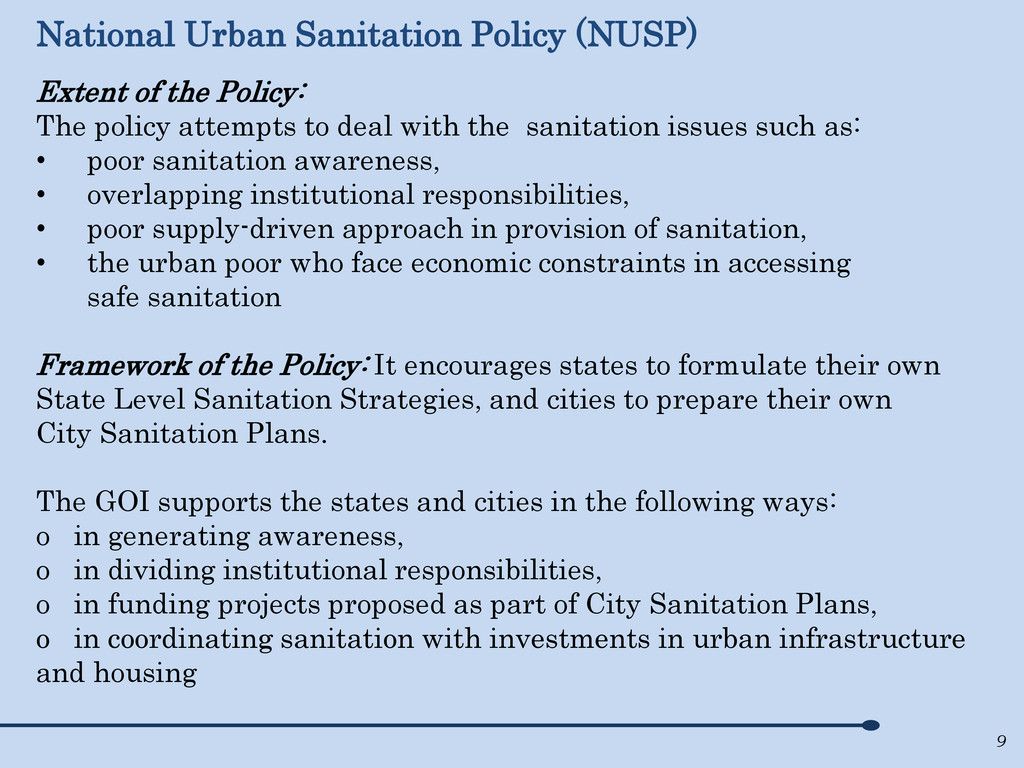
    The policy attempts to deal with the sanitation issues such as: • poor sanitation awareness, • overlapping institutional responsibilities, • poor supply-driven approach in provision of sanitation, • the urban poor who face economic constraints in accessing safe sanitation Framework of the Policy: It encourages states to formulate their own State Level Sanitation Strategies, and cities to prepare their own City Sanitation Plans. The GOI supports the states and cities in the following ways: o in generating awareness, o in dividing institutional responsibilities, o in funding projects proposed as part of City Sanitation Plans, o in coordinating sanitation with investments in urban infrastructure and housing
  9. 10 • Low Infrastructure: o Low investments – historic neglect

    o Investments (whatever little) made on an ad hoc basis o High investment needs (?) ! o Always been a catch up game • Low Service Coverage: o Norm based approach – one size fits all !? o Focus on Individual Projects and Asset Creation rather than Improved Service Delivery o No last mile connection o BANANA (Build Absolutely Nothing Anything Near Anyone) problem !! o Uncertainty over land tenure Key Issues…..
  10. 11 • Weak Institutional Framework: • Low Maintenance of Assets

    : Result is a “build-neglect-rebuild” cycle • Many institutions; no coordination • Limited technical expertise and capacity • Inadequate capacity at ULB level • Non availability of institutional finance • Availability of land for infrastructure creation Key Issues….. (Contd..)
  11. 12 • Integrated Strategic Planning at city level– (convergence of

    CDP, CSP, Master Plan and SFCP) • Investment requirements are large (?!) but financeable • Rs 2.4 lakh crore for CAPEX and Rs 2.4 lakh crore for O&M for next 20 years • Full costs must be collected and rights to all ensured • Fix the institutions that fix the pipes !! • Supply side Dynamics: Delinking land tenure to access to basic services • Stimulating investments through innovative partnerships (Alandur) • Scale up of the models that have worked (community toilets in Trichi) Way Ahead