Upgrade to Pro — share decks privately, control downloads, hide ads and more …

UXINDIA15- Design Ingredients & Recipe for Data Visualization( Balakrishna Chamola ) by uxindia

uxindia
October 31, 2015

UXINDIA15- Design Ingredients & Recipe for Data Visualization( Balakrishna Chamola ) by uxindia

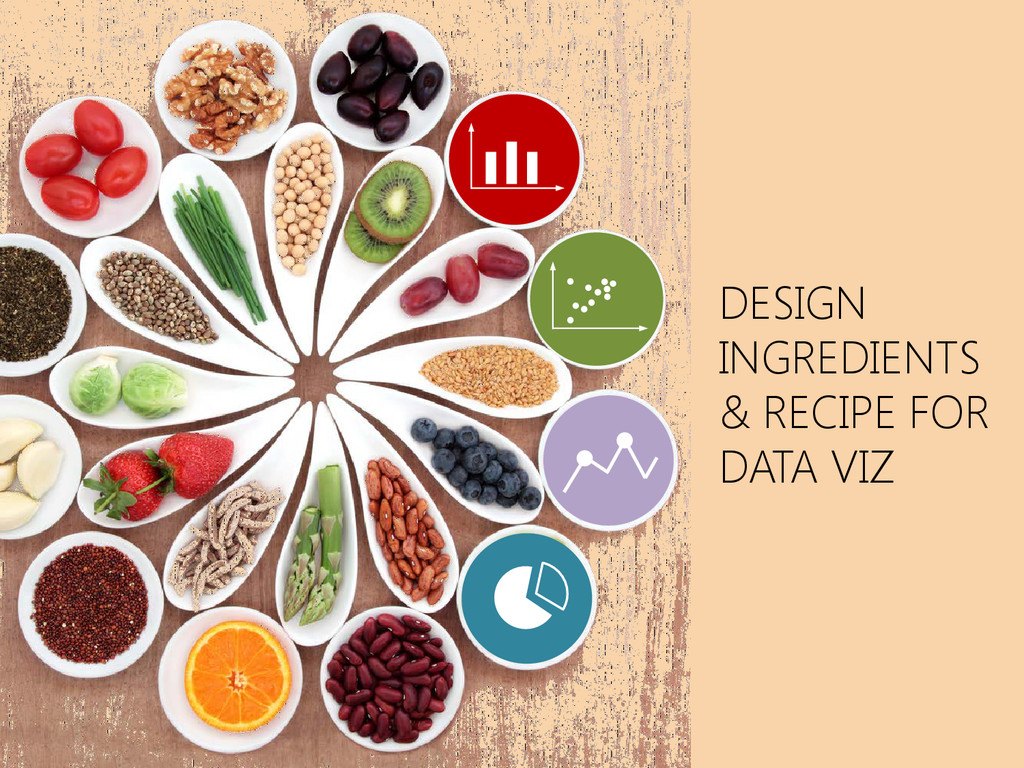
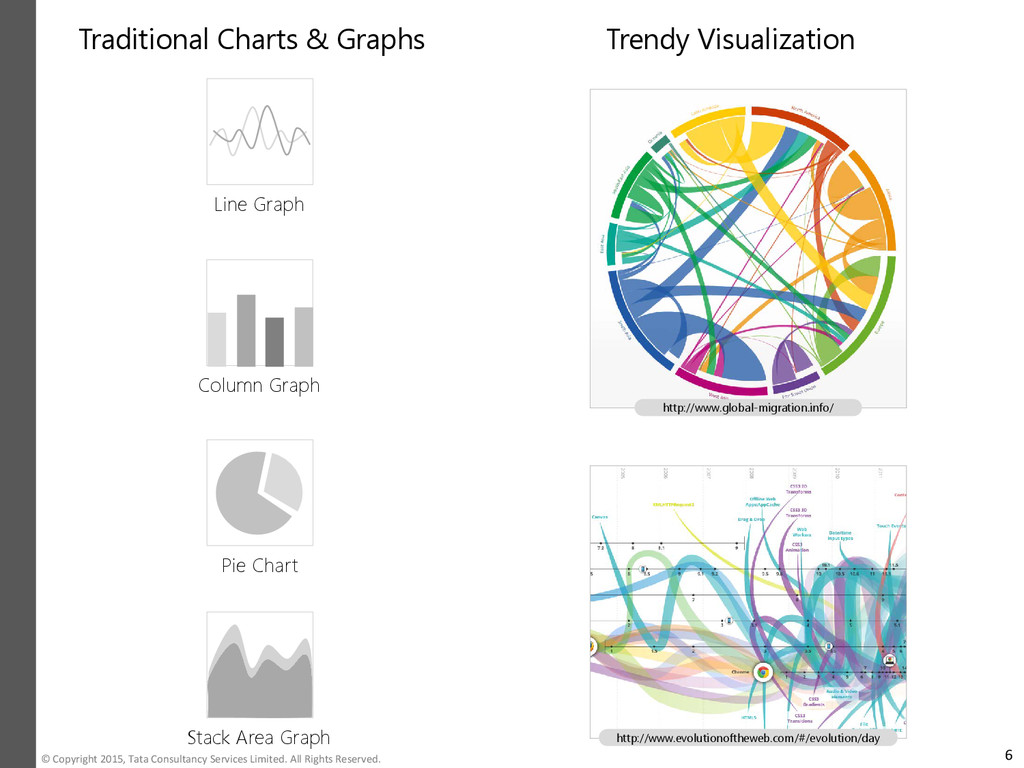
In today’s world we see huge volume of data are getting generated every minute through multiple sources; such as Social networks, IOT, Sensory devices and so on. With the increase in volume of data, it is but imperative that the visualizations that are created using the data; needs to be intuitive, easy to understand, interpretable and actionable.

uxindia

October 31, 2015
Tweet

More Decks by uxindia

Other Decks in Design

Transcript

  1. 1

  2. Data Visualization FOOD Preparation INGREDIENTS Method RECIPE 3 © Copyright

    2015, Tata Consultancy Services Limited. All Rights Reserved.
  3. DATA VISUALIZATION About Data Visualization Traditional & Trendy Visualization DESIGN

    INGREDIENTS Preparation DESIGN RECIPE Understanding Data Measurement Scale Selection of Charts and Graphs Understanding Graphic Variable Types OUR DISHES 4 © Copyright 2015, Tata Consultancy Services Limited. All Rights Reserved.
  4. Identify clusters and patterns quickly PATTERNS Tracking change in Data

    over a period of time TRENDS Find hidden relationships CORRELATIONS DATA VISUALIZATION is the representation and presentation of data that exploits our visual perception abilities in order to amplify cognition. - Andy Kirk Data Visualization 5 © Copyright 2015, Tata Consultancy Services Limited. All Rights Reserved.
  5. Traditional Charts & Graphs Trendy Visualization Line Graph Stack Area

    Graph Column Graph Pie Chart http://www.global-migration.info/ http://www.evolutionoftheweb.com/#/evolution/day 6 © Copyright 2015, Tata Consultancy Services Limited. All Rights Reserved.
  6. Preparation Analyze Viz Need Assess whether visualization is really needed

    or not. Define Viz Objectives Questions that will be answered. Evaluate or Identify Parameters Are parameters meeting the overall objective of viz Bucket and Map Parameters Group the Parameters showing co-related output Eliminate Cluttering Parameters Remove Parameters that creates crowded insights. Create Narrative To identify the problem statement. Provides Overview-to-Detailed view of viz. 8 © Copyright 2015, Tata Consultancy Services Limited. All Rights Reserved.
  7. STEP 1 Understanding Data Measurement Scale STEP 2 Selection of

    Charts and Graphs STEP 3 Understanding Graphic Variable Types 9 © Copyright 2015, Tata Consultancy Services Limited. All Rights Reserved.
  8. STEP 1 Understanding Data Measurement Scale 10 © Copyright 2015,

    Tata Consultancy Services Limited. All Rights Reserved.
  9. Quantitative Qualitative Types of Data Measurement Scales Data Measurement Scale

    NOMINAL EXAMPLES • Male - Female • Words or Numbers • Zip code • Employee ID ORDINAL EXAMPLES • Degree of satisfaction • Rating scores • Ranking – Lo-Me-Hi • Order of finishing race INTERVAL EXAMPLES • Temp in degrees • Time in hours • Lat-Long RATIO EXAMPLES • Height & Weight • No. of things • Intensity of light • Published papers 0 is arbitrary 0 100 0C 0 has it true value Kg inches 2 1 3 11 © Copyright 2015, Tata Consultancy Services Limited. All Rights Reserved.
  10. STEP 2 Selection of Charts and Graphs 12 © Copyright

    2015, Tata Consultancy Services Limited. All Rights Reserved.
  11. Selection of Charts & Graphs RELATIONSHIPS Scatter Plot Matrix Chart

    Network Diagram TREND Line Graph Stack Area Graph COMPARISON Column Graph Block Histogram Bubble Chart COMPOSITION Pie Chart Tree Map Stack Column Graph DISTRIBUTION Histogram Graph Scatter Plot 13 © Copyright 2015, Tata Consultancy Services Limited. All Rights Reserved.
  12. STEP 3 Understanding Graphic Variable Types 14 © Copyright 2015,

    Tata Consultancy Services Limited. All Rights Reserved.
  13. Graphic Variable Types / Pre-attentive Variables COLOR Hue (tint) Saturation

    (intensity) Value (lightness) FORM Shape Size Orientation Graphic Variable Types – (Pre-attentive Attributes) TEXTURE Coarse Fine POSITION 15 © Copyright 2015, Tata Consultancy Services Limited. All Rights Reserved.
  14. Graphic Variables - Quantitative Vs Qualitative Color (Hue) Shape Orientation

    Qualitative Quantitative Mapping of Graphic Variable Types Size Value Saturation Position Texture 16 © Copyright 2015, Tata Consultancy Services Limited. All Rights Reserved.
  15. Specific Use case DATASETS 1. Bus Stop/Shelter name 2. Average

    Wait Time of Passengers 3. Wait Time (as Category) 4. Date 5. Day Type 6. Day of the Week 7. Average Passengers Waiting 8. Passenger/Queue (as Category) 9. Zones & Routes 10. Bus / Bus Number 11. Max & Min AWT (Poor - Good) 12. Hour of the date 13. Hour Group 14. Max & Min Queue Size (Poor - Good) 15. Timeline 16. Month 17. Year OBJECTIVES • Decrease passenger wait time at a bus shelter • Optimize queue size at a bus shelter INSIGHTS View over a period of time, which are the best & worst performing bus Shelters based on Queue Size & Average Wait Time. • Measure how many passengers are present at each bus shelter • Measure the average wait time for passengers present at each bus shelter 18 © Copyright 2015, Tata Consultancy Services Limited. All Rights Reserved.
  16. Data Classification INTERFACE PART  Filter panel (show/hide)  Timeline

    Filter VISUALIZATION PART 19 © Copyright 2015, Tata Consultancy Services Limited. All Rights Reserved.
  17. Bus Stop / Shelter Name Passenger/Queue (as category) Wait Time

    (as category) Avg. Wait Time Avg. Queue Size Max & Min AWT (Poor - Good) Max & Min Queue Size (Poor - Good) Timeline NOMINAL / CATEGORICAL ORDINAL INTERVAL RATIO QUALITATIVE QUANTITATIVE STEP 1 – Data Types and Mapping 20 © Copyright 2015, Tata Consultancy Services Limited. All Rights Reserved.
  18. STEP 2 - Selection of Appropriate Charts and Graphs TREND

    Line Graph RELATIONSHIPS Matrix Chart COMPARISON Column Graph • Tracking changes for all the bus shelters(around 100+) information would add clutter • It wouldn’t be clear to display best and worst performing bus shelters • Comparing two data variables and performance of bus shelters would be challenge and not easy to understand, for both long and short time period ` CONSEQUENCES CUSTOMIZE VISUALIZATION 21 © Copyright 2015, Tata Consultancy Services Limited. All Rights Reserved.
  19. Avg. Wait Time Avg. Queue Size Timeline Bus Stop /

    Shelter Name Passenger/Queue (as category) Wait Time (as category) Max & Min AWT (Poor - Good) Max & Min Queue Size (Poor - Good) QUALITATIVE QUANTITATIVE LABEL SHAPE COLOR ORIENTATION SIZE VALUE SATURATION POSITION TEXTURE STEP 3 – Graphic Variable Types and Mapping label shape shape color color size size position 22 © Copyright 2015, Tata Consultancy Services Limited. All Rights Reserved.
  20. Primary Insights • Negatively impacted entities (in red) • High

    performing entities (in green) • Bubble size indicates the Queue Size • Arc indicates the Avg. wait time (in mins) • Quick recognition of Pattern and Trend Secondary Insights • Behavior of data for Weekends and Holidays 23 © Copyright 2015, Tata Consultancy Services Limited. All Rights Reserved.
  21. 26 Passenger Boarding at every 5km distance 26 © Copyright

    2015, Tata Consultancy Services Limited. All Rights Reserved.
  22. 27 Popular Merchants (count of transactions made) Credit Card Debit

    Card Check 27 © Copyright 2015, Tata Consultancy Services Limited. All Rights Reserved.
  23. Balakrishna Chamola [email protected] TCS – CEG - User Experience CoE

    Thank you 28 © Copyright 2015, Tata Consultancy Services Limited. All Rights Reserved.