Upgrade to Pro — share decks privately, control downloads, hide ads and more …

UXINDIA15- Incorporating Quantitative Research Techniques into your UX Toolkit ( Bill Albert ) by uxindia

uxindia
October 31, 2015

UXINDIA15- Incorporating Quantitative Research Techniques into your UX Toolkit ( Bill Albert ) by uxindia

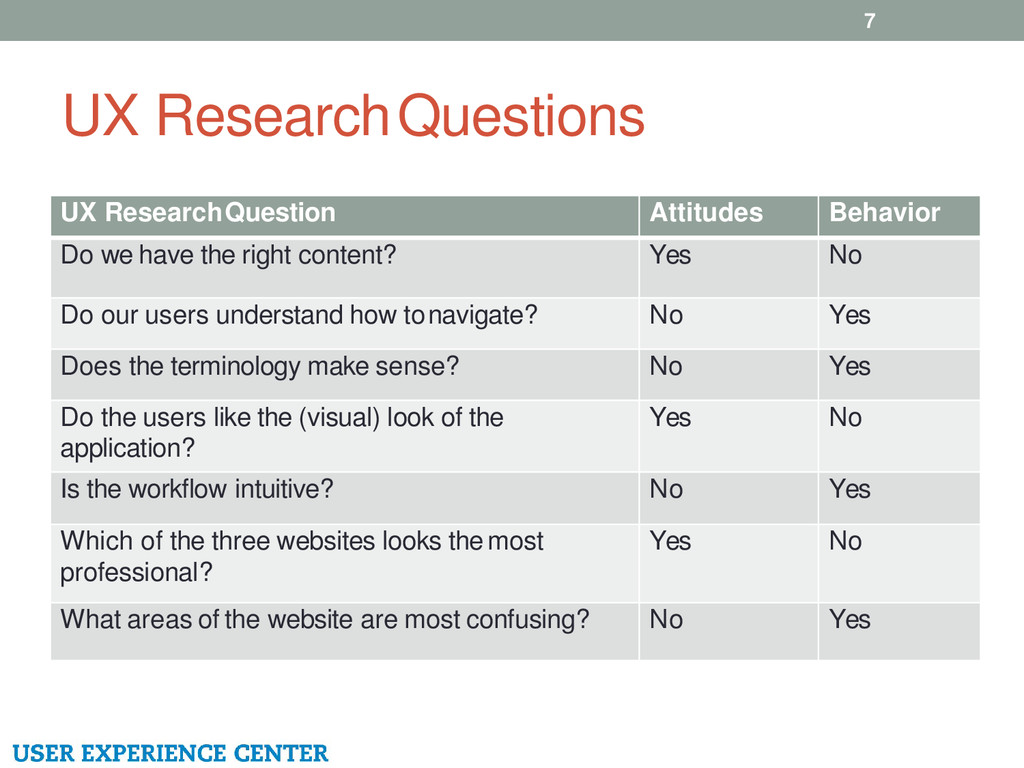
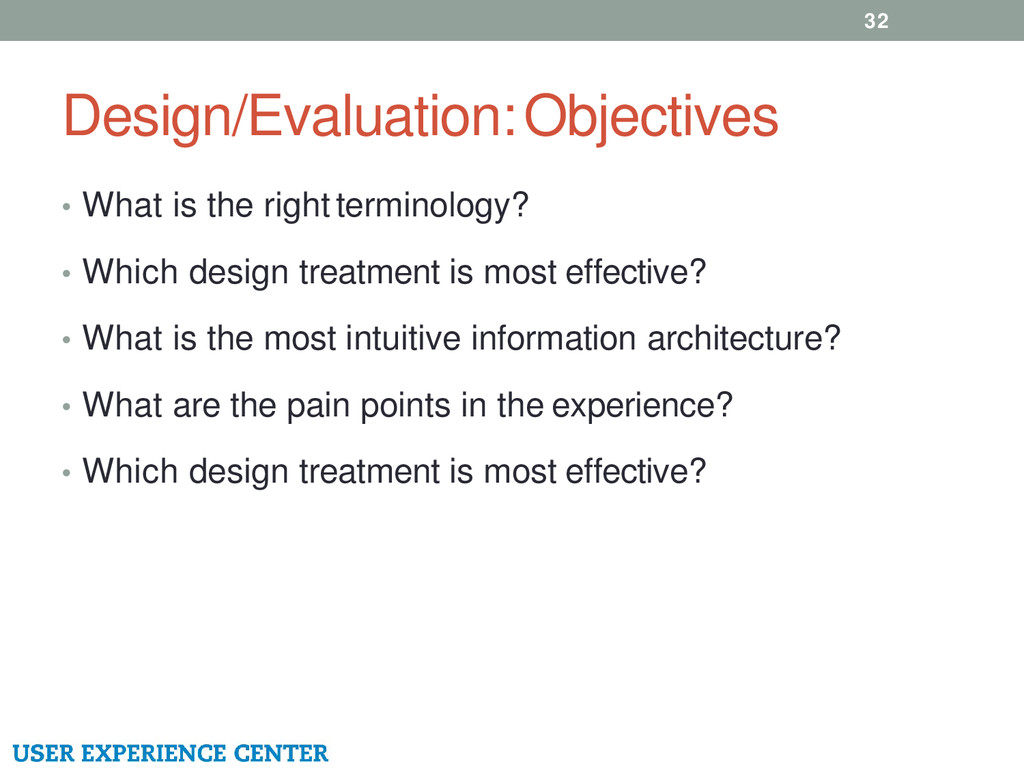
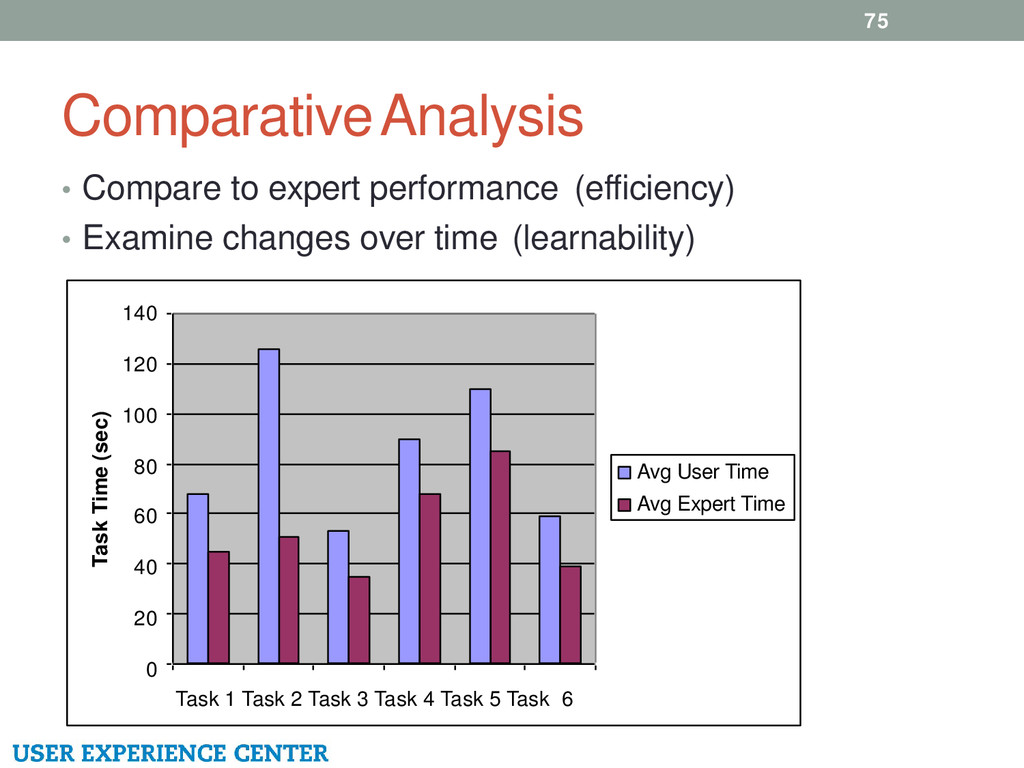
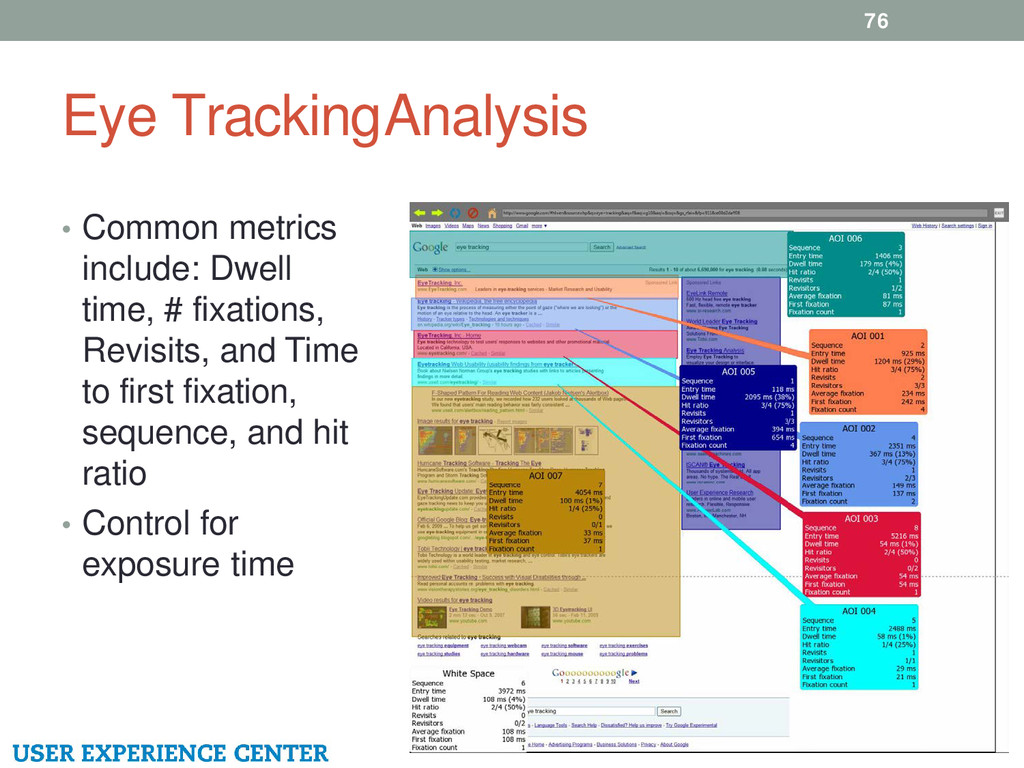
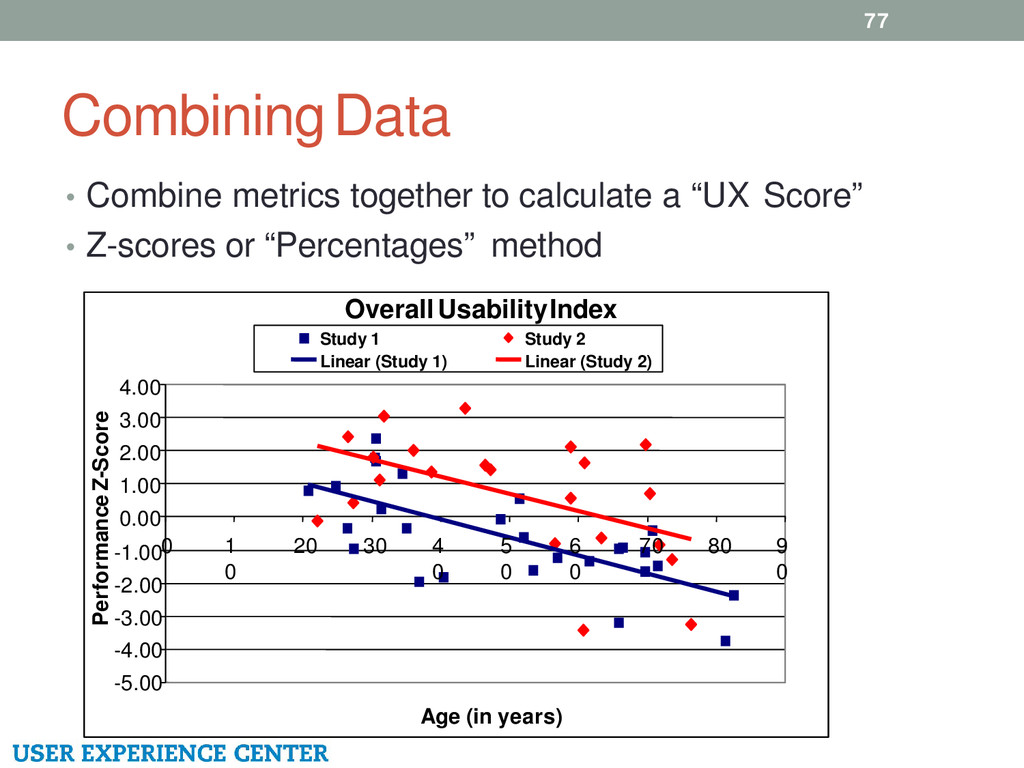
The goal of this workshop is to introduce a variety of quantitative UX research methods that are often overlooked during the user-centered design process. Most UX researchers rely heavily on qualitative methods. However, quantitative techniques offer additional insights and provide the necessary data to make the right decision and business decisions. The workshop will review how to collect, analyze, and present the most popular UX metrics. The workshop will also introduce some lesser known, but highly effective UX metrics. The workshop will also touch on quantitative techniques such as open/closed card sorting, surveys, unmoderated usability testing, and first click testing. The workshop will conclude with a discussion on how to integrate these quantitative techniques into your design process. Together, these quantitative techniques will expand your UX toolkit and make you a better-rounded UX researcher.

uxindia

October 31, 2015
Tweet

More Decks by uxindia

Other Decks in Design

Transcript

  1. INCORPORATING QUANTITATIVE TECHNIQUES INTO YOUR UX TOOLKIT Bill Albert, PhD

    Executive Director Bentley University User Experience Center 5 October 2015
  2. Agenda • Why UX quantitative methods matter • Overview of

    quantitative methods/tools • Discovery • Design/Evaluation • Validation • Data collection tips • Data analysis tips 3
  3. UX Research Framework 5 Qualitative Quantitative Attitudes Behaviors What is

    the problem and how big is it? What is the problem, why is it a problem and how to fix it? What are people doing? What are people saying?
  4. UX Research Questions 6 UX Research Question Qualitative Quantitative How

    does our app compare to the competition? No Yes What are the biggest pain points in the design? Yes Yes Has the design improved over time? No Yes Why do our users struggle with the website? Yes No How do our users like the design? Yes Yes What is the experience like for different user groups? Yes Yes Which design color do user like more? No Yes Is the design intuitive? Yes Yes
  5. UX Research Questions 7 UX Research Question Attitudes Behavior Do

    we have the right content? Yes No Do our users understand how to navigate? No Yes Does the terminology make sense? No Yes Do the users like the (visual) look of the application? Yes No Is the workflow intuitive? No Yes Which of the three websites looks the most professional? Yes No What areas of the website are most confusing? No Yes
  6. Avoid Problems 9 • Wide-spread customer dissatisfaction • Difficult to

    learn new system • High costs to remedy fixes
  7. Competitive Advantage 10 • Promote a better user experience •

    Identify and remedy problem areas • Identify new opportunities
  8. Track Improvements 11 • Measure against company goals • Determine

    organizational priorities • Reward success
  9. Magnitude of Issues 12 • Identification of an issue is

    not enough – need to measure the size of the issue • Prioritize design improvements • Identify new design opportunities
  10. Convince Management 13 • Move away from opinion • Prioritize

    design changes • Impact on business goals and customer loyalty
  11. Discussion 14 • What is your experience with quantitative methods?

    • Success stories? • How do you balance qualitative and quantitative methods? • Do your organizations value quantitative methods?
  12. Five Basic Questions 16 • What question do you want

    to answer? • Where are you in the design process? • What is the state (fidelity) of the product? • What are your budget/time constraints? • What will you do with the information?
  13. Common UX Methods 17 Qualitative Quantitative Attitudes Behaviors Usability Lab

    Testing (formative) Ethnographic Observation Diary Studies Web Analytics A/B Testing Eye Tracking Physiological Click/Mouse Contextual Inquiry/In- Depth Interviews Focus Groups Online Surveys Card Sorting/IA VOC Data Mining Unmoderated Usability
  14. Basic Categories of UX Metrics 19 • Performance Metrics •

    Self-reported Metrics • Issue-Based Metrics • Physiological Metrics • Comparative and Combined Metrics
  15. Discovery: Objectives 21 • Who are the users/customers? • What

    is their current experience? • What do users want? • What is the competition doing?
  16. Surveys 22 • Analyze current user experience – pain points,

    likes, unmet needs, etc. • Use metrics to determine new functionality and content, drive design priorities
  17. Baseline Measures 23 • Collect baseline metrics on current product

    prior to design • Use metrics to determine design priorities • Metrics used to track improvements Task Completion Rate per Person 8 7 6 5 4 3 2 1 0 <=50% 51%- 60% 61%- 70% 71%- 80% 81%- 90% 91%- 100% Frequenc y Original Redesign
  18. Case Study: Brand Perception • Client wanted to know how

    their users would perceive their brand if the color of their products changed • Would the color interfere with their work? • Would they be willing to pay more for certain colors? • Would they think about their brand differently? • How does the product perception change based on region and role? • Bentley UXC research in 2014 using online surveys and images (prototype) • Research conducted in US, Europe, and China markets 25
  19. Case Study: Brand Perception 26 Fresh 164 Innovative 140 Attractive

    137 Creative 128 Appealing 112 Energetic 103 Friendly 87 Optimistic 84 Cutting edge 81 Warm 80 China Novel 49 Attractive 44 Healthy 44 Innovative 44 Fresh 41 Creative 40 Warm 40 Energetic 36 Optimistic 32 Appealing 31 Cutting edge 31 Europe Fresh 64 Attractive 52 Creative 47 Innovative 47 Friendly 42 Optimistic 36 Inspiring 27 Appealing 26 Energetic 24 Powerful 23 Stimulating 23 US Fresh 59 Appealing 55 Innovative 49 Energetic 43 Attractive 41 Creative 41 Cutting edge 40 Fun 36 Stimulating 34 Friendly 30 Uplifting 29 Overall
  20. Case Study: Brand Perception 28 Overall Role Role in Purchasing

    Process Bottom 2 Top 2 # Responses Mean US Clinician Equipment User (no purchasing) 10% 38% 39 3.28 Decisive Role 18% 36% 11 3.27 Influential Role 20% 32% 25 3.12 Total Clinical Role 15% 36% 75 3.23 Administrator Equipment User (no purchasing) 20% 40% 5 3.20 Decisive Role 27% 27% 11 2.91 Influential Role 12% 53% 17 3.41 Total Administrator 18% 42% 33 3.21 US Total 16% 38% 108 3.22 Europe Clinician Equipment User (no purchasing) 36% 29% 14 2.86 I have a decisiverole 28% 46% 57 3.18 I have an influential role 44% 21% 34 2.79 Europe Total 34% 35% 105 3.01 China Clinician Equipment User (no purchasing) 33% 33% 3 3.00 Decisive Role 20% 80% 5 3.60 Influential Role 3% 63% 35 3.66 Total Clinical Role 7% 63% 43 3.60 Administrator Decisive Role 0% 100% 16 4.31 Influential Role 2% 84% 45 4.13 Total Administrator 2% 89% 61 4.18 China Total 4% 78% 104 3.94
  21. Case Study: Brand Perception • 82% in the US, and

    more than 90% in Europe and China liked the use of color • 83% US, 81% Europe, 86% China considered visual attractiveness when making a purchase • Blue and green were considered the most appropriate colors, as well as most preferred (for all three regions), while yellow and orange are the least preferred and least appropriate • Participants in China are most willing to pay more for equipment that is visually attractive, including the use of color (78%), followed by US participants (38%) and European participants (35%) 29
  22. Discussion 30 • What quantitative techniques do you use in

    discovery phase? • Success stories? • What are some of the strengths/limitations of each technique?
  23. Design/Evaluation: Objectives 32 • What is the right terminology? •

    Which design treatment is most effective? • What is the most intuitive information architecture? • What are the pain points in the experience? • Which design treatment is most effective?
  24. Card Sorting (Open) 34 • Understand how user categorize information

    – drive information architecture • Cluster analysis to identify categories (items occurring together)
  25. Tree Tests 35 • Test the intuitiveness of an information

    architecture • Closed card sorts test how consistent the categories are selected • Tree tests look at % correct path, directness, and speed
  26. Case Study: Information Architecture • Work carried out in 2013

    (Bentley UXC) for large retailer • How do users find products in a complex ecommerce website? • How does our client’s site compare to their main competition? • What products are easy/difficult to find on each site? • How does the client site improve over time? • Tree Test using Treejack (www.treejack.com) 36
  27. Usability Testing 39 • Performance (success, time, errors) • Self-reported

    (ease of use, confidence, SUS, NPS) • Physiological (eye tracking)
  28. Expectation Metrics 40 • Collect expectations prior to task, collect

    experience post- task • Map averages by task – use data to drive design priorities
  29. Case Study: e-Commerce 41 Overall donations had increased by 50%,

    and recurring donations increased from 2, up to 19 (a 6,715% increase!) Participant Task 1 Task 2 Task 3 Task 7 Task 8 P1 Missing Missing Missing Missing Missing P2 16 70 250 Missing 9.00 P3 56 10 60 119.00 118.00 P4 59 62 236 111.00 Missing P5 120 20 108 90.00 110.00 P6 Failure 120 322 Missing Missing P7 Failure 86 117 83.00 120.00 P8 Missing Missing Missing Missing Missing Average 63 61 182 101 89 St. Deviation 43 41 102 17 54
  30. Discussion 42 • What quantitative techniques do you use as

    part of your design/evaluation phase? • Success stories? • What are some of the strengths/limitations of the different techniques?
  31. Validation: Objectives 44 • Does the design meet it’s target

    goals? • Which design treatment is most effective? • How does a newly launched design compare to the competition?
  32. Unmoderated Tools 45 • Collect qualitative and quantitative data •

    UX metrics such as task success, time, paths, pages • Self-reported metrics post-task and post-session • Open-ended verbatim and video replay
  33. Moderated vs. Unmoderated 46 Moderated Unmoderated Greater insight into “why”

    Less insight into “why” Limited sample size Nearly unlimited sample size Data Collection is time consuming Data Collection is quick Better control of participant engagement Less control of the participant engagement
  34. Case Study: Usability Benchmark 49 • Research from 2010, presented

    at CHEST • Client wanted to benchmark their product (Genuair) against the competition • How does Genuair compare in terms of ease of use and satisfaction? • 48 participants all have COPD http://journal.publications.chestnet.org/article.aspx?articleID=1087181
  35. Discussion 53 • What quantitative techniques do you use in

    validation? phase? • Success stories? • What are some of the strengths/limitations of each technique?
  36. Choosing the Right Metrics 56 Study Goal Success Time Errors

    Efficiency Learnability Issus-Based Self-Report Physiological Combined Live Site Card Sorting/IA Completing a transaction X X X X X Comparing products X X X X Frequent use of the same product X X X X X Evaluating navigation or information architecture X X X X Increasing awareness X X X Problem discovery X X Maximizing usability for a critical product X X X Creating an overall positive user experience X X Evaluating impact of subtle changes X Comparing alternative designs X X X X X
  37. Finding Participants • Recruiters • Panel companies • Internal (company)

    lists • Friends/families • Websites • My recommendation: Pay for the recruit! 57
  38. Sample Size • Depends on: • Goals of the study

    • How much error you are willing to except • How much variation there is in the population • My general rule of thumb • Target 100 participants per distinct user type (novices vs. experts) • Margin of error around +/- 5% • Above 500 is generally not useful 58
  39. Survey Recommendations 59 • Keep it short! • Screen participants

    carefully • Pilot the study – make sure it is usable
  40. Tips in Self-Reported Metrics 60 • Use speed traps and

    consistency checks • Collect post-task and post-session data • Use Likert scales more than semantic differential
  41. Tips in Measuring Task Success 61 • Task must have

    a clear end-state • Task answers cannot be guessed • Choose distractor answers carefully • Confirm there are no other acceptable answers
  42. Tips in Measuring Completion Times 62 • Use reminders and

    warnings if answering too quickly or no activity after a few minutes • Do not use think-aloud protocol (use RTA) • Allow users to “give up” if they can’t complete the task • Decide when you will stop the timer (moderated only)
  43. Tips in Eye Tracking 63 • Decide if you want

    metrics and/or visualizations • The artifact you use will impact the analysis • Control for exposure time
  44. Tips in Measuring Engagement 64 • Define engagement – interest?

    Usefulness? Likelihood to use in the future? • Use combination of behavior and self-reported, and ideally physiological metrics • Look at comparative products/designs
  45. Task Success Analysis 66 • Binary Success (success/failure) is most

    common • Look by task and compare user groups • Look at confidence intervals! • Aggregate across tasks for overall performance
  46. Task Success Analysis 67 • Determine thresholds to see the

    big picture • Analyze success by experience • Analyze based on how the task was accomplished
  47. Task Completion Time Analysis 68 • Only analyze successful tasks

    • Visualize time data with scatterplot • Identify and remove outliers (maximum) • Identify and remove minimum times • Report as median, not mean
  48. Task Completion Time Analysis 69 • Analyze time data per

    task and across all tasks • Compare across designs and user groups • Statistical tests to determine significance Average Time-on-Task 160 140 120 100 80 60 40 20 0 Task 1 Task 2 Task 3 Task 4 Task 5 Second s
  49. Task Completion Time Data Analysis 70 • Measure the percentage

    of participants who meet specific time criteria (same or different criteria for each task) • Measure percentage of participants who completed all tasks within a specific time 50% 20% 25% 40% 45% 20% 0% 40% 60% % of Participants Under One Minute 100% 80% Task 1 Task 2 Task 3 Task 4 Task 5 % Participants
  50. Self-Reported – Post-Task Analysis 71 • Use variety of metrics

    – ease of use, confidence, usefulness, expectations • Probe special aspects such as navigation, content, etc. • Calculate % Top 2 Box and % Bottom 2 Box • Analyze verbatim comments based on positive/negative sentiment
  51. Self-Reported – Post-Session Analysis 72 • Use post-session survey such

    as SUS (System Usability Scale) • Consider rating statements to cover the entire experience Frequency Distribution of SUS Scores for 129 Conditions from 50 Studies 50 45 40 35 30 25 20 15 10 5 0 <=40 41-50 81-90 91-100 51-60 61-70 71-80 Average SUS Scores Frequency Percentiles: 10th 47.4 25th 56.7 50th 68.9 75th 76.7 90th 81.2 Mean 66.4 www.measuringusability.com
  52. Issues-Based Analysis 73 • Metrics for issues should be classified

    by severity and type • Use metrics to compare designs, iterations, groups – drive design resources
  53. Card Sorting (Closed) Data 74 • Compare IA’s with different

    # categories - examine agreement across users • Validate IA with Tree Tests – look at success speed, and directness
  54. Comparative Analysis 75 • Compare to expert performance (efficiency) •

    Examine changes over time (learnability) 140 120 100 80 60 40 20 0 Task 1 Task 2 Task 3 Task 4 Task 5 Task 6 Task Time (sec) Avg User Time Avg Expert Time
  55. Eye Tracking Analysis 76 • Common metrics include: Dwell time,

    # fixations, Revisits, and Time to first fixation, sequence, and hit ratio • Control for exposure time
  56. Combining Data 77 • Combine metrics together to calculate a

    “UX Score” • Z-scores or “Percentages” method Overall Usability Index 4.00 3.00 2.00 1.00 0.00 -1.000 -2.00 -3.00 -4.00 -5.00 1 0 20 30 4 0 5 0 6 0 70 80 9 0 Age (in years) Performance Z-Score Study 1 Linear (Study 1) Study 2 Linear (Study 2)
  57. Thank You! Bill Albert, PhD Executive Director [email protected] @UXMetrics Bentley

    Univ. User Experience Center www.bentley.edu/uxc @BentleyUXC LinkedIn Group – Bentley UXC