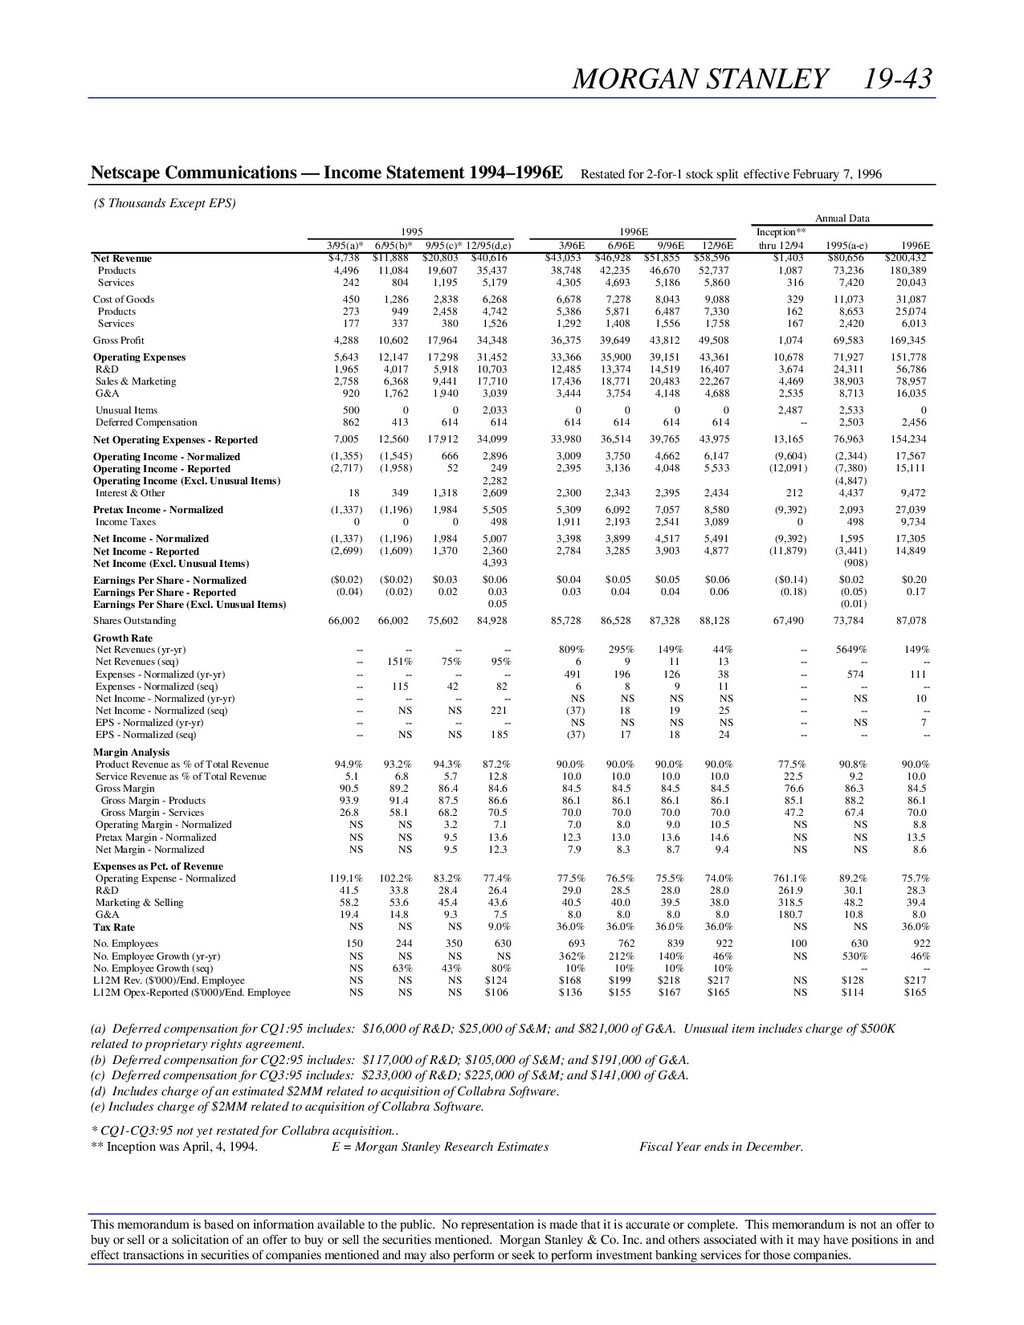
to the public. No representation is made that it is accurate or complete. This memorandum is not an offer to buy or sell or a solicitation of an offer to buy or sell the securities mentioned. Morgan Stanley & Co. Inc. and others associated with it may have positions in and effect transactions in securities of companies mentioned and may also perform or seek to perform investment banking services for those companies. Netscape Communications — Income Statement 1994–1996E Restated for 2-for-1 stock split effective February 7, 1996 ($ Thousands Except EPS) Annual Data 1995 1996E Inception** 3/95(a)* 6/95(b)* 9/95(c)* 12/95(d,e) 3/96E 6/96E 9/96E 12/96E thru 12/94 1995(a-e) 1996E Net Revenue $4,738 $11,888 $20,803 $40,616 $43,053 $46,928 $51,855 $58,596 $1,403 $80,656 $200,432 Products 4,496 11,084 19,607 35,437 38,748 42,235 46,670 52,737 1,087 73,236 180,389 Services 242 804 1,195 5,179 4,305 4,693 5,186 5,860 316 7,420 20,043 Cost of Goods 450 1,286 2,838 6,268 6,678 7,278 8,043 9,088 329 11,073 31,087 Products 273 949 2,458 4,742 5,386 5,871 6,487 7,330 162 8,653 25,074 Services 177 337 380 1,526 1,292 1,408 1,556 1,758 167 2,420 6,013 Gross Profit 4,288 10,602 17,964 34,348 36,375 39,649 43,812 49,508 1,074 69,583 169,345 Operating Expenses 5,643 12,147 17,298 31,452 33,366 35,900 39,151 43,361 10,678 71,927 151,778 R&D 1,965 4,017 5,918 10,703 12,485 13,374 14,519 16,407 3,674 24,311 56,786 Sales & Marketing 2,758 6,368 9,441 17,710 17,436 18,771 20,483 22,267 4,469 38,903 78,957 G&A 920 1,762 1,940 3,039 3,444 3,754 4,148 4,688 2,535 8,713 16,035 Unusual Items 500 0 0 2,033 0 0 0 0 2,487 2,533 0 Deferred Compensation 862 413 614 614 614 614 614 614 -- 2,503 2,456 Net Operating Expenses - Reported 7,005 12,560 17,912 34,099 33,980 36,514 39,765 43,975 13,165 76,963 154,234 Operating Income - Normalized (1,355) (1,545) 666 2,896 3,009 3,750 4,662 6,147 (9,604) (2,344) 17,567 Operating Income - Reported (2,717) (1,958) 52 249 2,395 3,136 4,048 5,533 (12,091) (7,380) 15,111 Operating Income (Excl. Unusual Items) 2,282 (4,847) Interest & Other 18 349 1,318 2,609 2,300 2,343 2,395 2,434 212 4,437 9,472 Pretax Income - Normalized (1,337) (1,196) 1,984 5,505 5,309 6,092 7,057 8,580 (9,392) 2,093 27,039 Income Taxes 0 0 0 498 1,911 2,193 2,541 3,089 0 498 9,734 Net Income - Normalized (1,337) (1,196) 1,984 5,007 3,398 3,899 4,517 5,491 (9,392) 1,595 17,305 Net Income - Reported (2,699) (1,609) 1,370 2,360 2,784 3,285 3,903 4,877 (11,879) (3,441) 14,849 Net Income (Excl. Unusual Items) 4,393 (908) Earnings Per Share - Normalized ($0.02) ($0.02) $0.03 $0.06 $0.04 $0.05 $0.05 $0.06 ($0.14) $0.02 $0.20 Earnings Per Share - Reported (0.04) (0.02) 0.02 0.03 0.03 0.04 0.04 0.06 (0.18) (0.05) 0.17 Earnings Per Share (Excl. Unusual Items) 0.05 (0.01) Shares Outstanding 66,002 66,002 75,602 84,928 85,728 86,528 87,328 88,128 67,490 73,784 87,078 Growth Rate Net Revenues (yr-yr) -- -- -- -- 809% 295% 149% 44% -- 5649% 149% Net Revenues (seq) -- 151% 75% 95% 6 9 11 13 -- -- -- Expenses - Normalized (yr-yr) -- -- -- -- 491 196 126 38 -- 574 111 Expenses - Normalized (seq) -- 115 42 82 6 8 9 11 -- -- -- Net Income - Normalized (yr-yr) -- -- -- -- NS NS NS NS -- NS 10 Net Income - Normalized (seq) -- NS NS 221 (37) 18 19 25 -- -- -- EPS - Normalized (yr-yr) -- -- -- -- NS NS NS NS -- NS 7 EPS - Normalized (seq) -- NS NS 185 (37) 17 18 24 -- -- -- Margin Analysis Product Revenue as % of Total Revenue 94.9% 93.2% 94.3% 87.2% 90.0% 90.0% 90.0% 90.0% 77.5% 90.8% 90.0% Service Revenue as % of Total Revenue 5.1 6.8 5.7 12.8 10.0 10.0 10.0 10.0 22.5 9.2 10.0 Gross Margin 90.5 89.2 86.4 84.6 84.5 84.5 84.5 84.5 76.6 86.3 84.5 Gross Margin - Products 93.9 91.4 87.5 86.6 86.1 86.1 86.1 86.1 85.1 88.2 86.1 Gross Margin - Services 26.8 58.1 68.2 70.5 70.0 70.0 70.0 70.0 47.2 67.4 70.0 Operating Margin - Normalized NS NS 3.2 7.1 7.0 8.0 9.0 10.5 NS NS 8.8 Pretax Margin - Normalized NS NS 9.5 13.6 12.3 13.0 13.6 14.6 NS NS 13.5 Net Margin - Normalized NS NS 9.5 12.3 7.9 8.3 8.7 9.4 NS NS 8.6 Expenses as Pct. of Revenue Operating Expense - Normalized 119.1% 102.2% 83.2% 77.4% 77.5% 76.5% 75.5% 74.0% 761.1% 89.2% 75.7% R&D 41.5 33.8 28.4 26.4 29.0 28.5 28.0 28.0 261.9 30.1 28.3 Marketing & Selling 58.2 53.6 45.4 43.6 40.5 40.0 39.5 38.0 318.5 48.2 39.4 G&A 19.4 14.8 9.3 7.5 8.0 8.0 8.0 8.0 180.7 10.8 8.0 Tax Rate NS NS NS 9.0% 36.0% 36.0% 36.0% 36.0% NS NS 36.0% No. Employees 150 244 350 630 693 762 839 922 100 630 922 No. Employee Growth (yr-yr) NS NS NS NS 362% 212% 140% 46% NS 530% 46% No. Employee Growth (seq) NS 63% 43% 80% 10% 10% 10% 10% -- -- L12M Rev. ($'000)/End. Employee NS NS NS $124 $168 $199 $218 $217 NS $128 $217 L12M Opex-Reported ($'000)/End. Employee NS NS NS $106 $136 $155 $167 $165 NS $114 $165 (a) Deferred compensation for CQ1:95 includes: $16,000 of R&D; $25,000 of S&M; and $821,000 of G&A. Unusual item includes charge of $500K related to proprietary rights agreement. (b) Deferred compensation for CQ2:95 includes: $117,000 of R&D; $105,000 of S&M; and $191,000 of G&A. (c) Deferred compensation for CQ3:95 includes: $233,000 of R&D; $225,000 of S&M; and $141,000 of G&A. (d) Includes charge of an estimated $2MM related to acquisition of Collabra Software. (e) Includes charge of $2MM related to acquisition of Collabra Software. * CQ1-CQ3:95 not yet restated for Collabra acquisition.. ** Inception was April, 4, 1994. E = Morgan Stanley Research Estimates Fiscal Year ends in December.