Upgrade to Pro — share decks privately, control downloads, hide ads and more …

Mary Meeker ”Our new world”

vc.ru
March 22, 2021

Mary Meeker ”Our new world”

vc.ru

March 22, 2021
Tweet

More Decks by vc.ru

Other Decks in Business

Transcript

  1. 1 April 17, 2020 We are in an environment the

    likes of which we have not experienced before... In this informal note, we have compiled observable trends that help form our views of the present and should provide insights into the future. Relevant reference points from Internet Trends plus USA, Inc. can be found at bondcap.com. – Mary, Noah, Mood, Juliet, Daegwon, Paul & the BOND team Our New World (Outline) 1) Covid-19 = Shock + Aftershocks 2) Viruses + Microbes = Consistent + Periodic Agents of Disaster 3) Creative Innovators (Globally + Together) Will Rise Above the Virus 4) Rapid Changes Drive Growth in Both Directions… • Scientists / Engineers / Domain Experts Get Back More Seats at The Tables • Work-Life Re-Balanced • Digital Transformation Accelerating • Rise of On-Demand Services as Economic Growth Driver Continues (for Consumers + Workers) • Government’s Role in Stabilizing / Stimulating Economy (& Jobs) Must Be Enabled by Modern Technologies • 2020 = Step-Function Year for Technology + Healthcare? • Traditional Sports = Post Covid-19 Evolution Provides Real-Time Engagement Clues for Other Businesses 5) ‘The World Just Doesn’t End That Often’ = We Will Get Through This…But Life Will Be Different…
  2. 2 Our New World 1) Covid-19 = Shock + Aftershocks

    Earthquakes are like high-speed zippers that rip open the earth – they can run 138 miles in a minute1 as the San Francisco Earthquake did in 1906. The big ones transform the way people live. The shock from Covid-19’s high-speed spread / impact has similarities – as of 4/16/20, in the 94 days since the first known cases outside of China were reported, 2.1MM people have tested positive globally and 145K have died. 93% of the world’s 193 countries have reported cases, and governments’ only choice has been to impose unprecedented social control policies with the hope of ‘flattening the curve.’ The top 20 countries by GDP have all implemented some form of social distancing and/or quarantine – in aggregate, this represents 80% of global GDP and a large portion of the population. Covid-19 has upended our modern lives in ways we’re just starting to understand. With an abrupt shock, many of us – other than those who are infected or serving those in need of care – have shifted from navigating the ‘rat race’ to moving at a relative snail’s pace. We are living in a hunkered down world that in many ways seems more attuned to life from another era – but in 24x7 streaming global color. In the face of an enemy on our shores, America has stepped up. Neighbors are looking out for each other. Philanthropic initiatives (often local) are rolling out to provide stopgap help to those in need until more sustainable solutions are optimized. And, over 18MM2 healthcare workers are tirelessly and heroically serving on our front lines. In the aftershock, the economy has also ground to a halt, and job losses are rising rapidly. At current course and speed, in a few months unemployment could reach levels not seen since the Great Depression almost a century ago. Nearly one in four American workers are employed in the most affected face-to-face jobs like food service, hospitality, retail and other services3. As of one month ago, one in five Americans had already lost working hours or jobs4. Seventy-three percent of Americans have indicated their household income has been reduced5. 0 20 40 60 80 100 120 140 160 180 1/23 1/30 2/6 2/13 2/20 2/27 3/5 3/12 3/19 3/26 4/2 4/9 Number of Countries Week (Starting 1/23, Week of China's Lockdown) Number of Countries With Confirmed Community Cases Covid-19 = Rapid Globalization Source: Internal analysis as of 4/13/20, John Hopkins University, Worldometer N = 1 1 2 5 5 12 27 47 94 123 149 175 1 U.S. Geological Survey (USGS) – The Northern California Earthquake, 4/18/1906. 8,300 miles per hour illustratively converted to miles per minute. 2 CDC. 3 Pew Research 3/27/20. 4 NPR/PBS NewsHour/Marist poll on 3/17/20. 5 FT-Peterson poll, 3/24/20 – 3/27/20. Note: Throughout we use Covid-19 to refer to both the disease, and the virus (SARS-CoV-2) that causes the disease.
  3. 3 Comparing U.S. unemployment and the stock market of the

    past 43 trading days with September 1929 – December 1936 (the Great Depression), one finds terrifyingly similar trends in stock market movements while today’s unemployment levels are spiking at a materially faster clip. Similar shocks have taken place in other advanced economies, amplifying the knock-on effects to trade that may worsen the global downturn. Recent government-imposed containment actions have necessitated government-funded lending / liquidity / stimulus programs at unprecedented speed, scope, scale and complexity. In its effort to stabilize and stimulate the weakening economy, the U.S. government has committed over $2 trillion in aid to consumers and the economy while the Federal Reserve has committed up to $2.3 trillion to expand an existing corporate lending program for small and medium-sized businesses along with the purchase of municipal bonds. These numbers will likely continue to rise. Source: St. Louis FRED, BLS, CBO (including Q2:20E unemployment projection from 4/2/20), CapitalIQ as of 4/14/20. Unemployment vs. Stock Market Trends = 2020 (2/12 – Current) vs. 1929 – 1936 USA Unemployment Rate (%) Dow Jones Industrial Average Indexed Returns 4.4% (3/20) – 5% 10% 15% 20% 25% 30% 0 20 40 60 80 100 120 9/1/29 9/1/30 9/1/31 9/1/32 9/1/33 9/1/34 9/1/35 9/1/36 USA Unemployment Rate vs. Dow Jones Industrial Average (Indexed) DJIA Returns (Peak 9/29 Indexed) DJIA Returns (Peak 2/12/20 Indexed) Unemployment Rate (1929 - 1936) Umployment Rate 2020 DJIA Returns (Peak 9/3/1929 Indexed) DJIA Returns (Peak 2/12/2020 Indexed) Unemployment Rate (1929 - 1936) Unemployment Rate (2020) >10% (Q2:20E) USA CARES Act (2020) = Largest & Fastest Stimulus Package Ever Source: St. Louis FRED. 2009 – 2020 assumes 1.77% annual inflation. 1933 – 2020 assumes 3.52% annual inflation based on CPI. Historical USA Stimulus Bills ($B) Nominal Dollars Historical USA Stimulus Bills ($B) Inflation Adjusted Dollars $2,000 $1,500 $42 – 10% 20% 30% 40% $0 $1,000 $2,000 $3,000 2020 CARES Act (2020) 2008 Recovery Act New Deal (1933 - 1940) $2,000 $1,788 $826 $0 $1,000 $2,000 $3,000 2020 CARES Act (2020) 2008 Recovery Act New Deal (1933 - 1940) Stimulus Dollars ($B) % of GDP Stimulus Dollars ($B) Stimulus Dollars ($B) % GDP CARES Act (2020) Recovery Act & TARP (2009) New Deal (1933 - 1940) CARES Act (2020) Recovery Act & TARP (2009) New Deal (1933 - 1940) Months to Implement 1st Stimulus Package From Stock Market Peak 1 10 42
  4. 4 We have a hydra-like crisis – health / economic

    / psychological – that occurred at a time when many things were humming (economic growth / consumer spending / employment / wages…) but there weren’t huge margins for error. For context, the $4.3 trillion in government monetary and fiscal responses is the equivalent of 124% of the American government’s revenue in 2019 and 20% of GDP. Simplistically, it would take total debt / GDP level to 127% vs. 107% in 2019. The speck of relative good news here is that interest rates are near record low levels so the near-term annual cost of the new debt will be relatively low. Personal Saving Rate = Rising But 8% vs. 12% Fifty Years Ago… Debt-to-Annual-Income Ratio = 23% vs. 15% Source: St. Louis Federal Reserve FRED Database, USA Federal Reserve Bank. *Consumer debt-to-annual-income ratio = outstanding credit extended to individuals for household, family & other personal expenditures, excluding loans secured by real estate vs. average annual personal income. Personal saving rate = percentage of disposable personal income (DPI), frequently referred to as “the personal saving rate.” (i.e. the annual share of disposable income dedicated to saving) Personal Saving Rate & Debt-to-Annual-Income* Ratio 0% 15% 30% 1969 1979 1989 1999 2009 2019 Personal Saving Rate Debt-to-Annual-Income* Ratio Ratio, USA USA Public Debt / GDP Level = 8th Highest vs. Major Economies (2018) Source: IMF 2018 Estimate, World Bank GDP data. Government Debt Country % of GDP 2018 ($B) 1) Japan 236% $4,971 2) Sudan 186 41 3) Greece 185 218 4) Italy 135 2,084 5) Portugal 122 241 6) Singapore 110 364 7) Mozambique 107 15 8) USA 106 20,544 9) Cyprus 101 25 10) Belgium 100 543 11) France 98 2,778 12) Spain 98 1,419 13) Egypt 93 251 14) Congo 90 11 15) Canada 90 1,713 Government Debt Country % of GDP 2018 ($B) 16) Angola 89% $106 17) Brazil 87 1,869 18) Argentina 86 520 19) UK 86 2,855 20) Sri Lanka 84 89 21) Croatia 75 61 22) Zambia 75 27 23) Austria 74 455 24) Pakistan 72 315 25) Slovenia 70 54 26) Hungary 70 158 27) India 69 2,719 28) Morocco 65 118 29) Ireland 64 382 30) Yemen 63 27 USA Income Statement = Expenses > Revenue for Years… -19% Average Net Margin Over 30 Years USA Income Statement Source: Congressional Budget Office, White House Office of Management and Budget. *Individual & corporate income taxes include capital gains taxes. Note: USA federal fiscal year ends in September. Non-defense discretionary includes federal spending on education, infrastructure, law enforcement, judiciary functions. F1989 F1994 F1999 F2004 F2009 F2014 F2019 Comments Revenue ($B) $991 $1,259 $1,827 $1,880 $2,105 $3,021 $3,463 Y/Y Growth 9% 9% 6% 5% (17%) 9% 4% +5% Y/Y average over 25 years Individual Income Taxes* $446 $543 $879 $809 $915 $1,395 $1,718 Largest driver of revenue % of Revenue 45% 43% 48% 43% 43% 46% 50% Social Insurance Taxes $359 $461 $612 $733 $891 $1,023 $1,243 Social Security & Medicare payroll tax % of Revenue 36% 37% 33% 39% 42% 34% 36% Corporate Income Taxes* $103 $140 $185 $189 $138 $321 $230 Fluctuates with economic conditions % of Revenue 10% 11% 10% 10% 7% 11% 7% Other $83 $114 $151 $148 $161 $283 $272 Estate & gift taxes, duties / fees… % of Revenue 8% 9% 8% 8% 8% 9% 8% Expense ($B) $1,144 $1,462 $1,702 $2,293 $3,518 $3,506 $4,448 Y/Y Growth 7% 4% 3% 6% 18% 1% 8% Entitlement / Mandatory $486 $717 $900 $1,238 $2,093 $2,098 $2,735 Risen owing to rising healthcare costs + % of Expense 42% 49% 53% 54% 60% 60% 61% aging population Non-Defense Discretionary $208 $255 $312 $463 $846 $573 $853 Education / law enforcement / % of Expense 18% 17% 18% 20% 24% 16% 19% transportation / general government… Defense $304 $282 $275 $456 $661 $603 $686 2009 increase driven by War on Terror % of Expense 27% 19% 16% 20% 19% 17% 15% Net Interest on Public Debt $169 $203 $230 $160 $187 $229 $375 Recent benefit of historic low interest % of Expense 15% 14% 14% 7% 5% 7% 8% Surplus / Deficit ($B) ($153) ($203) $126 ($413) ($1,413) ($485) ($985) -19% average net margin, 1989-2019 Net Margin (%) (15%) (16%) 7% (22%) (67%) (16%) (28%)
  5. 5 These are all big numbers. The biggest / fastest

    such intervention ever from Washington DC – by a long shot. For better or worse, given the circumstances, the boosters – or bazookas (a term used by Hank Paulson, U.S. Treasury Secretary, during the financial crisis in 2008) are needed for the attempt to stabilize and restart our rapidly deteriorating economy. These large numbers may not be large enough – after all, one person’s lost revenue is also another person’s lost revenue and so on and so on…a problematic cascade on multiple dimensions that is still in its early stages. We are all participating in an unproven test for fiscal and monetary policy of a magnitude we have not experienced before. Can a rapid response of this scale using lots of capital stabilize rapidly declining business trends and help them resume growth in short order? The money is one thing; human confidence is another. We will know soon enough – we suspect business trends in Q3 will be better than Q2 but that will be a low bar… Key challenges of this multi-sided situation include: 1) Understanding when people can safely leave their homes, resume some version of their former lives, and restart the economy…all while balancing privacy and civil liberties 2) Ensuring government funding efficiently gets in the right hands and helps the economy weather the sudden slowdown 3) Helping businesses gradually get up and running again, while mindful of the potential for periodic shutdowns 4) Ensuring sufficient and creative ways for people to get back to work (and/or receive support) that sustain long-term economic growth 5) Managing government debt – which unfortunately has risen in good times – so that the financial overhang does not overburden our future USA Total Federal Debt as % of GDP = @ 107% & Rising (2019) Source: St. Louis FRED, Office of Management & Budget. Total Federal Debt % of US GDP Total Federal Debt % of US GDP 0% 20% 40% 60% 80% 100% 120% 140% 1940 1950 1960 1970 1979 1989 1999 2009 2019 WWII USA Interest Rates = Near Historic Lows…Total Federal Debt at Historic High Source: St. Louis FRED, Office of Management & Budget. Effective Federal Funds Rate (%) vs. Total Federal Debt ($B) Effective Federal Funds Rate (%) – Blue Line Total Federal Debt ($B) – Black Shading $0 $5,000 $10,000 $15,000 $20,000 $25,000 0% 5% 10% 15% 20% 1954 1959 1964 1969 1974 1979 1984 1989 1994 1999 2004 2009 2014 2019
  6. 6 2) Viruses + Microbes = Consistent + Periodic Agents

    of Disaster The battle of humans vs. infectious disease has been going on forever and humanity’s ever-increasing proximity is the primary facilitator. Viruses are commonplace, epic viruses are rare – these are the big ones that changed the world… Sources: Visual Capitalist, CDC, History.com, TIME Additional viruses over the last century have been material killers, all originating outside America: Asian Flu killed 1.1MM people in 1957-58 primarily in Asia; Hong Kong Flu killed 1MM in 1968-70 primarily in Asia; Swine Flu killed 200K in 2009-2010 globally, Ebola killed 11.3K in 2014-2016 in West Africa1 and SARS killed 8K people in 2003. While other regions (primarily Asia) have experienced easily spread viruses with high mortality rates in recent history, America’s last pandemic experience (at scale) was the Spanish Flu one-hundred years ago. Unfortunately, 3-4 generations are long enough for many people to have forgotten the pain and to be ill-prepared for the next attack. Our world had become increasingly porous, handing a coronavirus the perfect setup for global impact. As digital connectivity, air travel, cross-border movement and trade have ramped steadily upward, our population has become untethered physically, darting from place to place with limited geographic constraints. Furthermore, people have migrated from rural, isolated regions to more densely populated, connected urban areas. Pandemic Type # Deaths # Infected Mortality Rate Duration Years Origin Region Most Affected Stopping Mechanism Bubonic Plague Bacterial 200MM ~333MM 60% 5 years 1347-51 China Europe Quarantine / Survivor Immunity Small Pox Viral 56MM ~185MM 30% 431 years 1520-1951 Europe Global Vaccine Spanish Flu Viral 40-50MM ~500MM 8% 2 years 1918-19 Unknown Global Quarantine / Survivor Immunity Plague of Justinian Bacterial 30-50MM ~80MM 50% 2 years 541-542 Middle East Europe Survivor Immunity HIV / AIDS Viral 25-35MM ~70MM 35% 39 years 1981 - Present Africa Global Testing / Antivirals Third Plague Bacterial 12MM NA NA 1 year 1885 Asia Asia Quarantine / Survivor Immunity Internet user data is as of mid-year. Source: United Nations / International Telecommunications Union, USA Census Bureau. Pew Research (USA), China Internet Network Information Center (China), Islamic Republic News Agency / InternetWorldStats / Bond estimates (Iran), Bond estimates based on IAMAI data (India), & APJII (Indonesia). Global Internet Users (2018) = 3.8B vs. <15MM Twenty-Five Years Ago 0% 10% 20% 0 2B 4B 1990 1994 1996 1998 2000 2002 2004 2006 2008 2010 2012 2014 2016 2018 Y/Y Growth (Red Line) Internet Users, Global (Blue Bar) Internet Users vs. Y/Y Growth Global Air Travel (2018) = >4.2B Passengers, +7% Y/Y Global Air Passengers (Millions) Global Air Passengers (millions) Source: World Bank, CLEAR. – 1,000 2,000 3,000 4,000 5,000 1970 1974 1978 1982 1986 1990 1994 1998 2002 2006 2010 2014 2018 Oil Shock Recession Gulf War I Recession Asian Financial Crisis Dot Com Bubble WTC Attacks Global Financial Crisis 1 CDC, Visual Capitalist and Encyclopedia Britannica.
  7. 7 All these trends set up a virus’ dream –

    hitchhike on a human or surface, and travel hundreds of miles per hour across land and sea to get to a whole new world. When there, quietly multiply before anyone can contain you. The virus is clever, and it has evolved perfectly for the global environment through its long incubation time, asymptomatic transmission and symptoms so mild that most carriers just keep working and milling about. Its impact on a human is a toxic cocktail of the unpredictable: from nothing...to sniffles…to coughing…to breathing difficulties…to death. The capriciousness sows fear, not just of the infected, but of every human interaction. It creates a feeling of being helpless in a war – with an invisible enemy. We are all focused on the duration and severity of our crisis and watching / waiting / praying for the ebb of coronavirus cases so we can begin to go out without fear of infection. The good news is that social distancing appears to work and governments around the world have embraced it. In an unprecedented and rapid global response, 100% of the 20 largest economies are now in some form of lockdown, with 19 of those countries taking action within a 4-week window. Global Cross-Border Air Travel (2018) = 1.4MM Arrivals, +6% Y/Y International Flight Arrivals (Millions) Total International Flight Arrivals (millions) Source: World Bank – 500 1,000 1,500 1995 1998 2001 2004 2007 2010 2013 2016 2018 Global Cross-Border Trade (2018) = $25T @ 29% of Global GDP 0% 20% 40% 1960 1965 1970 1975 1980 1985 1990 1995 2000 2005 2010 2015 Trade as % of Global GDP % of Global GDP 2018 Source: World Bank. Note: ‘World Trade’ refers to the average of Imports & Exports (to account for goods in-transit between years) for all nations. Global Relative GDP (Current $) = China + USA Rising…Europe Falling (2018) Global GDP Contribution (Current $) Source: World Bank (GDP in current $). Other countries account for ~30% of global GDP. 0% 20% 40% 1960 1970 1980 1990 2000 2010 % of Global GDP USA Europe China India Latin America 26% 22% 4% 16% 40% 24% 3% 7% 3% 6% 2018 Global Population (2018) = On-Going Migration to Urban Areas Source: Qatalyst Partners (March 2020) & World Bank China 59% Europe 75% USA 82% World 55% – 20% 40% 60% 80% 100% 1960 1970 1980 1990 2000 2010 USA China World Europe Urban Population (% of Total Population) Urban Population (% of Total Population) 2018
  8. 8 From the epidemiological data emerging from around the world,

    we now know more about this agent of disaster, much faster than ever before in pandemic history: 1) In the absence of intervention, Covid-19 infections will grow exponentially… Early consensus is that each person infected with Covid-19 will lead to 2 to 3 additional people becoming infected. In a world where the average person physically interacts with 10-15 others1 per day, there are hundreds of opportunities for transmission during the infectious stage of the disease. Empirically, that was proven in almost every country around the world, where a doubling time of every three days was observed in the weeks prior to social distancing. This doubling time is what produced the early warnings of hundreds of millions of infections. 2) Extreme social distance measures work... After implementing control measures, countries consistently see an improvement to ~6 days of doubling time within two weeks, and ~11 days within three weeks. The earliest countries to enter lockdown have now hit their peak hospitalization and death rates, approximately four weeks after implementing strict social controls. As a result, worldwide new daily cases largely stabilized in April and the world’s case count doubling time of ~15 days suggests we may be near the peak of this outbreak. 3) We don’t know what to expect ‘in between’... We know the two extremes, but we don’t know what will happen when we start to let down our guard. To do so, we need 100% available diagnostic testing with much faster turn-around (measured in minutes, not days). We need the systems and the tools to take action one step at a time, measure the impact, and iterate to find the most effective ways to contain Covid-19 until we have a vaccine. Social Distancing = Rapidly Implemented by World’s Largest 20 Economies Source: Internal analysis as of 4/13/20, John Hopkins University, Worldometer 0 5 10 15 20 1/23 1/30 2/6 2/13 2/20 2/27 3/5 3/12 3/19 3/26 Count of 20 Largest Economies with Social Distancing Week (Starting 1/23, Week of China's Lockdown) The World's 20 Largest Economies & Government-Mandated Social Distance N = 1 1 1 1 1 2 2 5 15 20 1 ’Mixing patterns between age groups in social networks’ S.Y. Del Valle et al. / Social Networks 29 (2007) 539–554.
  9. 9 The riddle for the whole world will be how

    to walk the fine line between relaxing the right measures at the right time in the right places, without fanning the flame of infection transmission and exponential case count growth. We believe that riddle is a problem that technology can help solve. 3) Creative Innovators (Globally + Together) Will Rise Above the Virus It’s easy to be fearful of how Covid-19 could continue to rage when one looks at the devastating outcomes from the epic plagues of past centuries. The difference today, in a world with near 24x7 transparency, is that broad awareness of problems rises faster than ever, thanks to our real-time global connectedness. Scientists and experts begin discussion / debate; citizens, businesses, entrepreneurs and governments move with varying levels of urgency. Action and the quest for solutions to problems can also ramp at record speed. The world has urgently moved on medical and public health initiatives to halt the spread of Covid-19: • Global Information Sharing – ~3K published Covid-19 papers, which is 20x the published research of prior infectious diseases at this stage in the public health response • Rapid Mobilization of Clinical Research – ~500 clinical trials for Covid-19 interventions underway or completed across 34 countries • Unprecedented Scale – 5MM expected clinical trial participants Impact of Social Distancing = Dramatic Reduction of Exponential Growth Source: Internal analysis as of 4/13/20, John Hopkins University, Worldometer 3.14 3.74 5.82 10.60 T0 = Lockdown T + 7 Days After Lockdown T + 14 Days After Lockdown T + 21 Days After Lockdown Average Doubling Times (Days) During Various Phases of Lockdown T0 = Date Social Distancing is Implemented N = 20 20 20 17 Daily New Cases = Largely Plateaued in April Source: Internal analysis as of 4/13/20, John Hopkins University, Worldometer (40%) (20%) 0% 20% 40% 60% 80% 100% 0 20,000 40,000 60,000 80,000 100,000 120,000 1/22 1/29 2/5 2/12 2/19 2/26 3/4 3/11 3/18 3/25 4/1 4/8 5-Day Trailing Avg. Daily Growth Rate Daily New Cases World Daily New Cases Daily New Cases 5-Day Trailing Avg. Daily Growth Rate Daily new case growth slowing Doubling Time = Dramatic Improvement In April Source: Internal analysis as of 4/13/20, John Hopkins University, Worldometer 0 10 20 30 40 50 60 70 80 90 100 1/22 1/29 2/5 2/12 2/19 2/26 3/4 3/11 3/18 3/25 4/1 4/8 3-Day Trailing Doubling Time World Doubling Times Higher Numbers = Slower Spread Just China... under control Exponential growth outside of China as the virus spreads to every country/community Slowing growth as the world retreats to social distancing
  10. 10 In sports, we often talk about dream teams from

    different eras like the New York Yankees, UCLA Bruins (Wooden Basketball), Boston Celtics, Chicago Bulls, New England Patriots, Alabama Crimson Tide (Bryant & Saban Football) and Golden State Warriors – their choreography, team play and wins have mesmerized. There’s comfort that a global healthcare dream team of medical professionals is working in unprecedented ways around the clock, rapidly sharing and iterating information / best practices / feedback in real-time at scale…in effect, organizing a lot of the world’s relevant information and making it accessible (and useful, one hopes) in record time. This type of global collective technology-assisted rapid response to a health-related problem has never happened before, including collaboration and cooperation between the private sector and governments / regulators. We will soon know if the fast-break attack of the virus can be countered by the global fast-break attack of the experts (and new thinkers) with their data, technology, machines and passion. We like the odds of the counterattack though the clock is ticking. Published Covid-19 Research = Faster Scientific Response Than Any Time In History Source: PubMed US National Library of Medicine, National Institutes of Health. 2,970 164 41 0 500 1,000 1,500 2,000 2,500 3,000 COVID-19 (2020 YTD) H1N1 (Apr 2009 - Jun 2009) SARS (Nov 2002 - Jan 2003) # of Research Reports Published in First 3 Months of Outbreak Covid-19 Clinical Trials = ~500 Trials Across 34 Countries 35 27 13 11 11 10 9 6 4 4 3 2 2 2 2 2 2 2 Clinical Trials by Country, N=499 371 Countries With 1 Active Clinical Trial South Korea, Taiwan, Norway, Jordan, Thailand, USA, Hong Kong, India, Australia, Vietnam, Brazil, French Guiana, Pakistan, Egypt, Romania, Ireland Source: Internal Analysis, clinicaltrials.gov, covid-evidence.org Clinical Trials = 13MM Participants…Primarily Drug / Traditional Medicine / Biologic Trials 0% 10% 20% 30% 40% 50% 60% 70% 80% 90% 100% Number of Studies # of Participants Breakdown by Intervention Type Drug Traditional Medicine Biologic Diagnostic Other N = 592 Studies N= 5MM Participants Source: Internal Analysis, clinicaltrials.gov, covid-evidence.org
  11. 11 4) Rapid Changes Drive Growth in Both Directions… Many

    of our customary activities have suddenly slowed – or come to complete halts. But the impact of Covid-19 has also brought accelerating growth and focus in other areas. Most of these represent an acceleration of trends that have been underway for years. Most have digital tie-ins. Some trends we see happening now… Scientists / Engineers / Domain Experts Get Back More Seats at The Table In our work at BOND, we focus on technology, innovation, and the powerful role of science / engineering / data in forward progress. We believe the Covid-19 environment creates a moment for the technology sector and its entrepreneurs to shine. The sector has consistently driven growth and value creation in the American economy. When one looks at public market capitalization as a measure of business momentum / success and reviews the top American-based market cap growers of the past ten years, there are common threads: 1) Technology / innovation 2) Digital, often cloud-based, business operations 3) CEOs with engineering / computer science degrees 4) Founded over the past ~30 years The list-toppers are Microsoft, Amazon, Apple, Alphabet / Google and Facebook. These successful companies are led by planners – they have short and long-term (10-20+ year) visions and business plans focused on data, execution, iteration, engineering and science. Events of the past 3-4 months underscore the need for broad-scale data-driven forward planning / execution and the need for modern technology. In both industry and government, we fully expect greater focus on forward planning with more scientists / engineers / domain experts who have seats at the table and relevant voices. This would be a good thing.
  12. 12 Work-Life Re-Balanced For those fortunate enough to be working

    these days, to say ‘shelter-in-place has changed daily routines’ is an understatement. Technology investors recall the legend of Instagram securing 100MM monthly active users in ~2 years and Fortnite snagging 100MM MAUs in ~18 months, but we have never seen a business-focused app rise from 10MM to 200MM daily meeting participants in three months as Zoom’s video collaboration platform just did. Zoom has secured its spot in the record books. In the wake of Covid-19, other business-focused apps (messaging & collaboration platforms) have also seen dramatic usage increases – Slack reported more than a 2x increase in paying customer adds in Q1 plus a 20% increase in average daily messages sent per user per day, while Microsoft Teams reported 44MM DAUs (daily active users), +3.7x week-over-week, for the week of March 19. Over the years, we have spent a lot of time looking at the evolution of work – from entrepreneurs working on online marketplaces (like eBay / Etsy / Upwork / Airbnb), workers earning money in new ways via on-demand services (like Uber / DoorDash / Instacart) and office workers working remotely at companies (like Automattic, Zapier and GitLab). We have often been in large open spaces at technology companies filled with people using laptops at standing desks while wearing headphones to tune out background noise. Despite the advantage of being in the same space, the workers often collaborate mostly using digital tools. We have questioned what percentage of workers need to be in the same place at the same time – is there a better win-win arrangement? Beginning on March 2, Bay-Area technology companies began to shift to work-from-home owing to Covid-19. Many workers stuffed their laptops and personal items into bags, took their regular commutes home, had a meal, went to sleep, woke up in the morning and then began doing those same jobs at a different desk (or kitchen table…or sofa). In effect, a big experiment started that will likely change the way lots of office work is done. We tend to invest in technology companies that have been founded in the past ten years. The businesses are generally run in the cloud using cutting-edge technology. Most are online businesses. Often 40-50% of their workforces focus on product development and engineering. - 10MM 200MM - 110MM 220MM Dec-13 Dec-14 Dec-15 Dec-16 Dec-17 Dec-18 Dec-19 Zoom Video = 200MM Daily Participants in March 2020, +20x in Three Months Zoom – Global Daily Meeting Participants Source: Zoom, “A Message to Our Users.” April 1, 2020. Represents maximum daily meeting participants. Zoom Global Daily Meeting Participants (Free and Paid) Jan-13 Mar-20 Dec-19 Zoom Public Release Mar-20 Dec-19 Jan-13
  13. 13 We conducted an informal survey of some of the

    companies…we asked questions about the new remote work environment. • At a high level, do you think your business is running more efficiently? • Are your teams and individuals more productive? • Are there business units / teams that are more efficient and happier? • Are there business units / teams that are less efficient and sadder? • What services are you using more – video conferencing / messengers / other? • What are the upside surprises of remote work? • How are you maintaining your company culture through remote work? • What are the downside surprises / challenges of remote work? • Assuming your business fundamentals are running as previously planned in 3-6 months, how might you change the way your business is run given what you are learning from remote working? Here’s what we have learned from the first 1½ months of remote work: • It’s still early – and the novelty may wear off and things may begin to break – but, so far so good. • At the margin, productivity is the same or higher. • Video calls, when not overused, are efficient / productive and they tend to start / end on time (or early). • Messenger & video-based information sharing / editing is very effective. • People outside of headquarters feel more included. • It’s easier to bring outsiders in for quick video discussions. • Time flexibility / commute time elimination / family meal sharing are big wins for workers. • Pre-existing management bottlenecks – around individual performance or organizational design – are only amplified in a distributed environment. • Biggest productivity and balance challenges come from parents with pre- or school-aged children that had other support systems during the working day prior to the implementation of work-from-home mandates. In addition, there’s work to be done in understanding potential psychological and physical stress and other challenges related to remote work, especially in the current ‘shelter-in-place’ environment. • Companies that focus on effective written communication and documentation (dubbed the ‘Amazon way’) – where plans are shared in written form for editing – either synchronous / asynchronous – have had an easier time shifting to distributed work. Many observe this form of communication can lead to more insightful input and decision making. • ‘Creating the office’ online can be successful – including regularly scheduled meetings plus active social experiences like work-related classes and training plus outlets like live-streamed workouts. While most companies already had teams working remotely, most believe – after the experience of forced remote work – they will shift to more distributed work. Top-of-mind issues with large-scale remote work include questions of how to: 1) Ensure creativity is captured and productivity is maintained 2) Determine which teams are optimized by working together in-person all the time / some of the time / rarely 3) Maintain engagement and culture(s), recruit / train / develop / retain people, and manage human resources 4) Manage technology / security with rising numbers of remote workers 5) Think about recruiting if physical proximity to headquarters / office is less relevant 6) Organize / utilize office space(s) 7) Evolve business travel and entertainment One founder said, ‘With newer start-up / founder-led companies, there can be a mindset that nothing is set in stone and there’s a nimbleness and receptivity to new ideas and change. Distributed work is just another new thing to embrace and make the best of. We are finding, in many ways, there’s a lot to like.’
  14. 14 Digital Transformation Accelerating On a relative basis, when we

    look back on business trends in the spring of 2020, it is likely that businesses doing the best tended to have: 1) Cloud-based business functions where workers can take their computing devices and work nearly anywhere 2) Products always in demand but especially so in uncertain times (starting with Maslow’s food / water / shelter…extended to entertainment) 3) Easily discoverable online presence that seamlessly helps consumers 4) Efficient ways to distribute products to consumers in limited-contact ways 5) Products that make businesses more digitally efficient 6) Broad (or emerging) social media presence We have seen it with the likes of: • Local restaurants shifting from four-top seating to curbside pick up • Local stores adapting to sell products on information-only websites • Local communities experiencing rising connectedness • Big brands ramping online efforts while offline falters • Instructors shifting from in-person to on-demand / virtual classes • Students shifting from physical to virtual & digital classes • Families + individuals shifting to more digital entertainment • Grocery shoppers shifting from going to store to ordering delivery • Diners shifting from eating-out to eating-in • Doctors shifting from in-person to telehealth appointments • CEOs / CTOs accelerating IT spending on cloud-based products / services Many of these offline-to-online trends have been in place for a while – Covid-19 just accelerated them. Some highlights / data follow… Restaurants = Shifting from Four-Top Seating to Curbside Pick Up Source: Instagram Local Stores = Adapting to Sell Products on Information-Only Websites Source: On Running
  15. 15 Local Communities = Experiencing Rising Connectedness Source: Nextdoor, AppAnnie

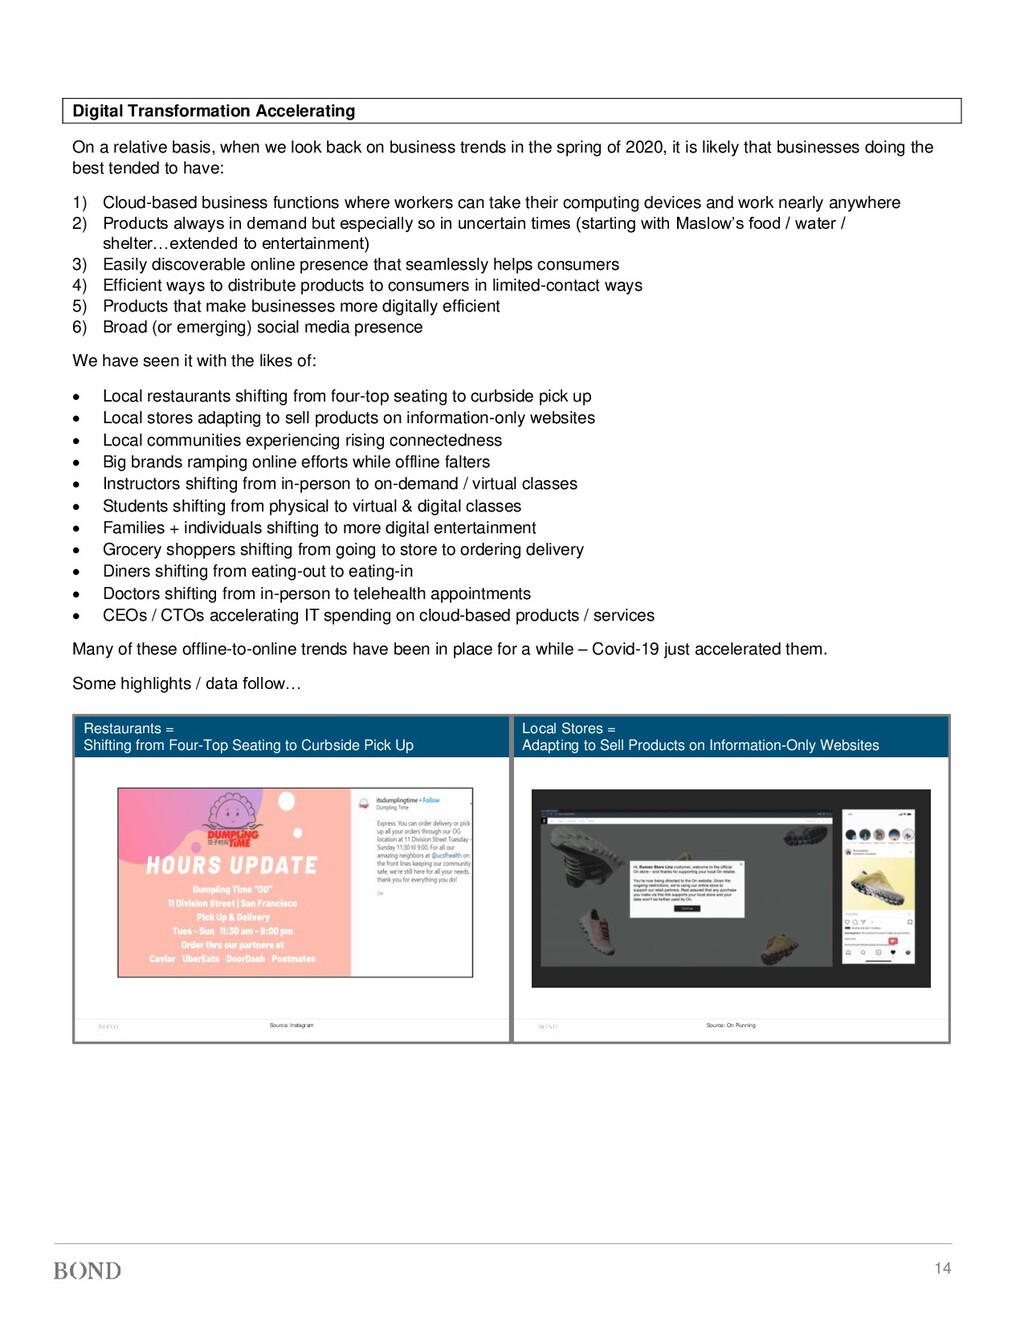
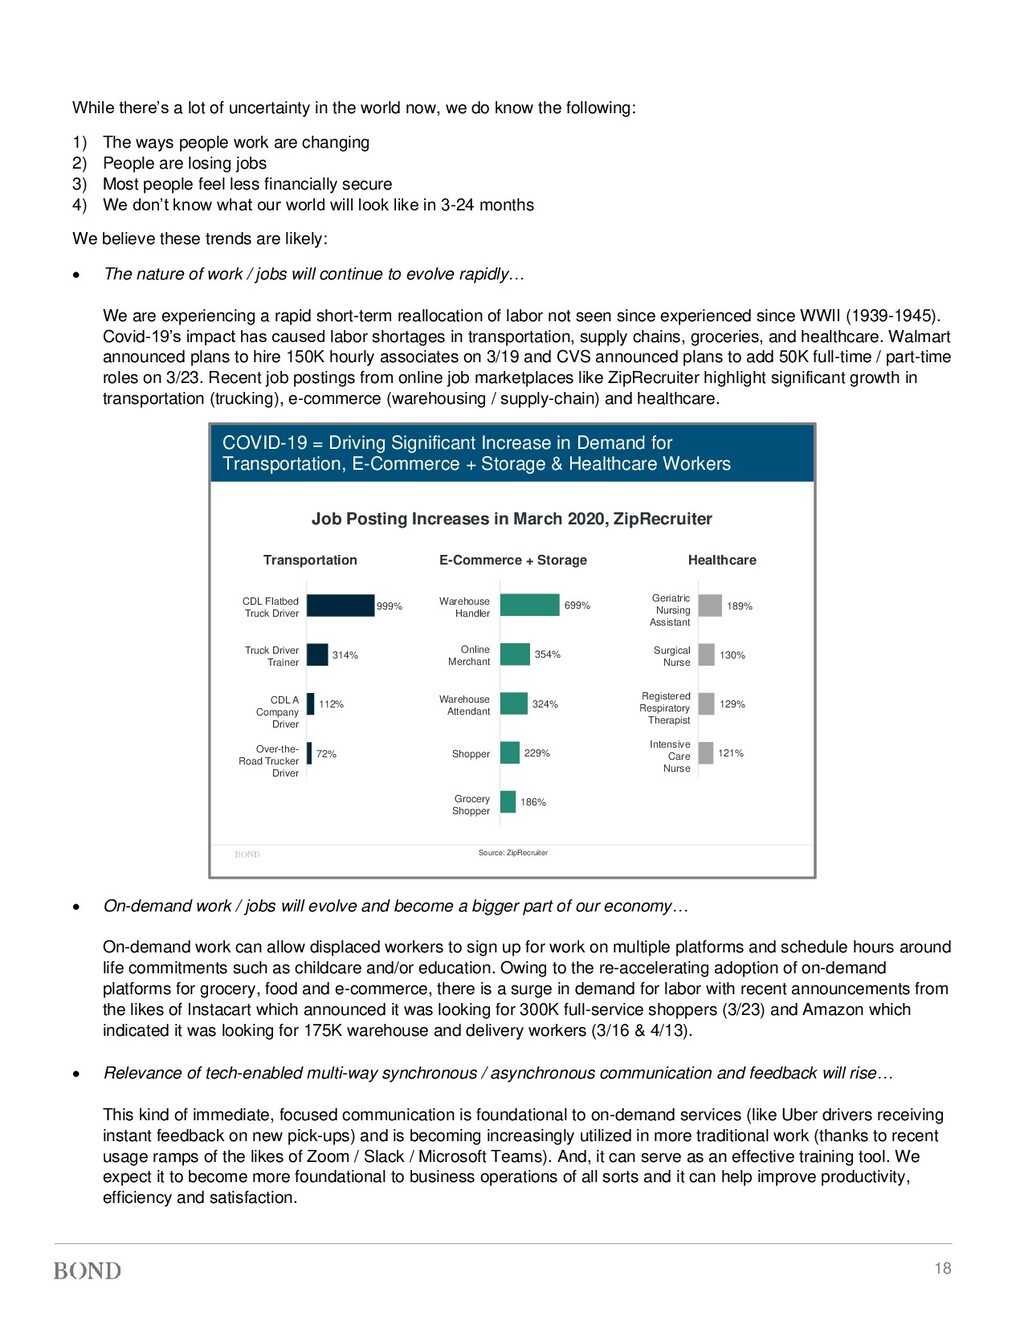
    iOS worldwide Nextdoor weekly active user data as of 4/15/2020. Nextdoor Worldwide Weekly iOS Active Users (AppAnnie) Nextdoor Help Map – 2,000,000 4,000,000 6,000,000 8,000,000 10,000,000 4/19 5/19 6/19 7/19 8/19 9/19 10/19 11/19 12/19 1/20 2/20 3/20 Worldwide Active iOS Users Big Brands = Ramping Online Efforts While Offline Falters Source: Restoration Hardware FY2019 Q4 earnings transcript So we try to reimagine how we're communicating, how we're working with the consumers. If you go to our website, you can get a sense for what we're doing. The whole front of the website starts with a letter from me addressing the current situation, letting everybody know our galleries are closed & letting everyone know that we say our doors may be closed, but our hearts & minds are open… We set up virtual appointments using FaceTime, Hangouts, Skype, Zoom, or call – it's like we're live innovating, improvising, adapting and overcoming. And the demand that our teams are generating during this time is – I think it's extraordinary. If you look back and think about the really big important moves this company & this brand has made in its history, the most important moves we made, the biggest transformational steps we've taken have been in the times of most uncertainty… I think no different then this virus is going to forever change this country & the world. This time is going to forever change our company & our way of doing business & in many ways, elevate our culture. Gary Friedman – Chairman / CEO, Restoration Hardware Earnings Call (3/30/20) Instructors = Shifting from In-Person to On-Demand / Virtual Classes Source: Core Power Yoga Instagram Students = Shifting from Physical to Virtual Classes… Source: AppAnnie iOS worldwide Google Classroom weekly active users data as of 4/15/2020. Google Classroom Worldwide Weekly Active Users on iOS (AppAnnie) – 5,000,000 10,000,000 15,000,000 20,000,000 25,000,000 4/19 5/19 6/19 7/19 8/19 9/19 10/19 11/19 12/19 1/20 2/20 3/20 Worldwide Weekly Active iOS Users …Students = Shifting from Physical to Digital Classes Source: AppAnnie iOS worldwide Duolingo weekly active user data as of 4/15/2020. Duolingo Worldwide Weekly Active Users on iOS (AppAnnie) – 2,000,000 4,000,000 6,000,000 8,000,000 10,000,000 4/19 5/19 6/19 7/19 8/19 9/19 10/19 11/19 12/19 1/20 2/20 3/20 Worldwide Weekly Active iOS Users Families + Individuals = Shifting to More Digital Entertainment Source: AppAnnie iOS worldwide Discord weekly active user data as of 4/15/2020. – 5,000,000 10,000,000 15,000,000 20,000,000 25,000,000 4/19 5/19 6/19 7/19 8/19 9/19 10/19 11/19 12/19 1/20 2/20 3/20 Discord iOS Worldwide Weekly Active Users (AppAnnie) Worldwide Weekly Active iOS Users
  16. 16 Grocery Shoppers = Shifting from Going to Store to

    Ordering Delivery Source: AppAnnie iOS US Instacart app weekly download data as of 4/15/2020. Excludes partial week download data. Instacart - 3rd Party iOS App Download Data (AppAnnie) – 100,000 200,000 300,000 400,000 500,000 600,000 700,000 800,000 4/19 5/19 6/19 7/19 8/19 9/19 10/19 11/19 12/19 1/20 2/20 3/20 4/20 USA Weekly iOS App Downloads Diners = Shifting from Eating-Out to Eating-In Source: AppAnnie iOS worldwide DoorDash weekly active user data as of 4/15/2020; public earnings transcripts Our Eats business is an important resource right now, especially for restaurants that have been hurt by containment policies. And in the US, our SMB sales team is now closing 2.5x the number of new restaurants we normally do per day. And our restaurant self-service website has seen a 10x increase in sign-ups since last Thursday. Eats is becoming all the more important for its partners, and we expect to be there for them. Dara Khosrowshahi – CEO of UBER, Shareholder Update Call (3/19/20) – 2,000,000 4,000,000 6,000,000 8,000,000 4/19 5/19 6/19 7/19 8/19 9/19 10/19 11/19 12/19 1/20 2/20 3/20 Worldwide Weekly Active iOS Users DoorDash – Worldwide Weekly Active Users on iOS (AppAnnie) Doctors = Shifting from In-Person to Telehealth Appointments Source: AppAnnie iOS worldwide Teladoc weekly download data as of 4/15/2020. Excludes partial week download data. Teladoc – 3rd Party iOS App Download Data (AppAnnie) The demand has shifted forever on virtual care & we’re on the verge of a new era for virtual care in the healthcare system. We’re certainly seeing a significant increase in volume & I didn’t exactly expect the president to be talking at a White House press briefing about telehealth. If you’d asked me that a few months ago, I would have said that’s pretty unlikely. Jason Gorevic – CEO, Teladoc Health, CNBC (3/23/20) Global Weekly iOS App Downloads – 10,000 20,000 30,000 40,000 50,000 4/19 5/19 6/19 7/19 8/19 9/19 10/1911/1912/19 1/20 2/20 3/20 CEOs / CTOs = Accelerating IT Spending on Cloud-Based Products / Services Source: Morgan Stanley CIO Survey (March 2020, report dated as of 4/2/2020), Twitter Projects with Largest Spend Increase in 2020 (% of Total Responses)
  17. 17 Rise of On-Demand Services as Economic Growth Driver Continues

    (for Consumers + Workers) On-demand services have been on the rise for years. Many of the top on-demand businesses have been negatively impacted by Covid-19. Leading on-demand platforms for transportation (Uber / Lyft…), accommodations (Airbnb…) and services have seen volumes decline as a result of stay-at-home measures, social distancing and border closures. On the other hand, on-demand platforms that deliver groceries and food (Instacart / DoorDash…) have experienced surging demand and are aggressively bringing on new workers, in addition to providing demand to local grocers, restaurants and other essential stores. Net, we believe on-demand and to-the-door delivery services may be gaining permanent market share in these unusual times. While the benefits to consumers of on-demand services are relatively obvious, we continue to believe the importance of on-demand businesses in helping provide workers with work and flexibility is underappreciated in America. In many regions around the world, especially Asia, on-demand services are more pervasive and advanced than in America. The on-demand economy is large and has been expanding in the U.S. – there were an estimated 56MM on-demand consumers in America in early 20181. Checkr indicated it had 11.5MM unique applicants on its on-demand worker background checking platform in 2019 and has supported >35MM unique applicants since 2015. This compares with the Bureau of Labor Statistics tally of 156MM American workers in March. On-Demand Consumers = 56MM + ~2x in Two Years On-Demand Consumers, USA Source: National Technology Readiness Survey (4/18). Note: authored by Rockbridge Associates, Inc. & A. Parasuraman & is co-sponsored by the Center for Excellence in Service, Robert H. Smith School of Business, University of Maryland. The study is conducted online among a representative sample of consumers in a national panel & represents the views of U.S. adults ages 18 & older. The sample size was 1,032 in 2016 & 1,004 in 2017. The margin of error is +/- 3 percentage points. 2018 figures are estimates. On-Demand Products / Services – Consumer Spend, 2017, USA 25MM 56MM 0 30MM 60MM 2016 2017 2018 On-Demand Consumers $0 $15B $30B Other Health & Beauty Food Delivery Housing Transportation Online Marketplaces Consumer Spend, 2017, USA On-Demand Workers = >35MM Unique Applicants on Checkr Platform Source: Checkr (Q1:20) 0 6MM 12MM 2015 2016 2017 2018 2019 As the on-demand economy continues to evolve & transform the world around us, we're seeing a rapid increase in new & supplemental job creation. Increasingly, this type of work has become a key driver of economic growth. Checkr has a front row seat in the on-demand economy, not only to watch the changes unfold, but also to provide solutions that shape & strengthen it. Our technology is designed to give employers the information they need to make informed decisions about their candidates, while helping them scale & grow their business. Daniel Yanisse – Co-Founder / CEO, Checkr, 6/19 Checkr On-Demand Platform Applicants, USA Annual Checkr Applicants, USA On-Demand Platforms = Big Numbers + High Growth Real-Time Platforms Internet-Enabled Marketplaces 0 3MM 6MM $0 $30B $60B $90B 2014 2015 2016 2017 2018 2019 Driver-Partners, Global Gross Bookings, Global Gross Bookings Driver-Partners Uber @ 5MM Driver-Partners 0 0.7MM 1.4MM 2014 2015 2016 2017 2018 2019 Lifetime Dashers, Global Lifetime Dashers DoorDash @ 1.3MM Dashers 0 125K 250K 2014 2015 2016 2017 2018 Onboarded Workers, Global Onboarded Workers Wonolo @ 230K Workers 0 2MM 4MM $0 $2B $4B 2012 2013 2014 2015 2016 2017 2018 2019 Sellers, Global Gross Merchandise Sales (GMS), Global GMS Sellers Etsy @ 3MM Sellers 0 3MM 6MM 0 125MM 250MM 2010 2012 2014 2016 2018 Active Listings, Global Guest Arrivals, Global Guest Arrivals Active Listings Airbnb @ 6MM Listings Uber Source: Uber. DoorDash Source: DoorDash. Note: Lifetime Dashers defined as the total number of people that have dashed on the platform through the end of each year. 2019 figures are as of 5/19. Etsy Source: Etsy. Airbnb Source: Airbnb, Note: Airbnb 2017 & 2018 Guest arrivals based on estimates from total guest arrivals disclosures in 2018 & 2019. 500MM guest arrivals have occurred via Airbnb as of 2019. VIPKid Source: Company Press Releases (3/19). Wonolo Source: Wonolo. VIPKid @ 70K Teachers 0 450K 900K 2017 2018 2019 0 55K 110K Teachers Students Students, Global Teachers, Global On-Demand Work Basics + Benefits (2017) = Extra Income + Flexibility, USA per Intuit / Emergent Research Source: Intuit / Emergent Research, 2017. Note: Intuit partnered with 12 On-Demand Economy platforms which provided access to their provider email lists. (n = 6,247 respondents who had worked on-demand within the past 6 months). The survey focused on online talent marketplaces. Airbnb and other online capital marketplaces were not included. Extra Income Flexibility 37% = Run Own Business 33% = Use Multiple On-Demand Platforms 26% = Employed Full-Time (W2 Wages) 14% = Employed Part-Time (W2 Wages) 5% = Retired 71% = Always Wanted To Be Own Boss 46% = Want To Control Schedule 19% = Responsible for Family Care 9% = Active Student 57% = Earn Extra Income 21% = Make Up For Financial Hardship 19% = Earn Income While Job Searching 91% = Control Own Schedule 50% = Do Not Want Traditional Job 35% = Have Better Work / Life Balance $34 Average Hourly Income $12K Average Annual Income 24% Average Share of Total Income 11 Average Weekly Hours With Primary On-Demand Platform 37 Average Weekly Hours of Work (All Types / Platforms) Benefits Basics 1 4/18 National Technology Readiness Survey conducted by Rockbridge Associates.
  18. 18 While there’s a lot of uncertainty in the world

    now, we do know the following: 1) The ways people work are changing 2) People are losing jobs 3) Most people feel less financially secure 4) We don’t know what our world will look like in 3-24 months We believe these trends are likely: • The nature of work / jobs will continue to evolve rapidly… We are experiencing a rapid short-term reallocation of labor not seen since experienced since WWII (1939-1945). Covid-19’s impact has caused labor shortages in transportation, supply chains, groceries, and healthcare. Walmart announced plans to hire 150K hourly associates on 3/19 and CVS announced plans to add 50K full-time / part-time roles on 3/23. Recent job postings from online job marketplaces like ZipRecruiter highlight significant growth in transportation (trucking), e-commerce (warehousing / supply-chain) and healthcare. • On-demand work / jobs will evolve and become a bigger part of our economy… On-demand work can allow displaced workers to sign up for work on multiple platforms and schedule hours around life commitments such as childcare and/or education. Owing to the re-accelerating adoption of on-demand platforms for grocery, food and e-commerce, there is a surge in demand for labor with recent announcements from the likes of Instacart which announced it was looking for 300K full-service shoppers (3/23) and Amazon which indicated it was looking for 175K warehouse and delivery workers (3/16 & 4/13). • Relevance of tech-enabled multi-way synchronous / asynchronous communication and feedback will rise… This kind of immediate, focused communication is foundational to on-demand services (like Uber drivers receiving instant feedback on new pick-ups) and is becoming increasingly utilized in more traditional work (thanks to recent usage ramps of the likes of Zoom / Slack / Microsoft Teams). And, it can serve as an effective training tool. We expect it to become more foundational to business operations of all sorts and it can help improve productivity, efficiency and satisfaction. COVID-19 = Driving Significant Increase in Demand for Transportation, E-Commerce + Storage & Healthcare Workers Source: ZipRecruiter 186% 229% 324% 354% 699% Grocery Shopper Shopper Warehouse Attendant Online Merchant Warehouse Handler 72% 112% 314% 999% Over-the-Road Truck Driver CDL A Company Driver Truck Driver Trainer CDL Flatbed Truck Driver Job Posting Increases in March 2020, ZipRecruiter Transportation E-Commerce + Storage Healthcare 121% 129% 130% 189% Intensive Care Nurse Registered Respiratory Therapist Surgical Nurse Geriatric Nursing Assistant CDL Flatbed Truck Driver Truck Driver Trainer CDL A Company Driver Over-the- Road Trucker Driver Warehouse Handler Online Merchant Warehouse Attendant Shopper Grocery Shopper Geriatric Nursing Assistant Surgical Nurse Registered Respiratory Therapist Intensive Care Nurse
  19. 19 Net, Covid-19 has been a forcing function for a

    rapid re-think about the nature of work and the training / education necessary to remain agile and relevant in the workforce. On-demand work should be a foundational way that government helps people get back to work. Uber for Drivers = Synchronous + Asynchronous Communication / Feedback Platform Source: Uber, YouTube Slack for Workers = Synchronous + Asynchronous Communication / Feedback Platform Source: Slack One of the advantages of Slack is the deep level of engagement…Even though the average number of users have [increased], the average messages per user has increased. [Users] are sending messages, creating channels, adding integrations, uploading files – we want to be integral in how these organizations operate. And the way we get there is simultaneous connections. Stewart Butterfield – Co-Founder / CEO, Slack, 3/26/20 (Interview with RBC Capital Markets)
  20. 20 Government’s Role in Stabilizing / Stimulating Economy (& Jobs)

    Must Be Enabled by Modern Technologies There will be endless debate about the wisdom and timing of government actions that stopped the economy by sending people home, and about government efforts to restart the economy by sending people back to work. But in the here and now, governments face several immediate challenges. As noted earlier, they must: 1) Understand when people can safely leave their homes, resume some version of their former lives, and restart the economy…all while balancing privacy and civil liberties 2) Ensure government funding efficiently gets in the right hands and helps the economy weather the sudden slowdown 3) Help businesses gradually get up and running again, while mindful of the potential for periodic shutdowns 4) Ensure sufficient and creative ways for people to get back to work (and/or receive support) that sustain long-term economic growth 5) Manage government debt – which unfortunately has risen in good times – so that the financial overhang does not overburden our future Covid-19 has attacked humans, and, in effect, it has also attacked our systems. We know that people most vulnerable to the virus can have pre-existing conditions. Our governments have pre-existing conditions, too. The problem is beyond partisanship: Our government’s day-to-day operating systems and technology are old / fragile / inefficient and vulnerable. Covid-19 has exposed this. We are hopeful that Covid-19 can serve as a forcing function to drive long- overdue upgrades and overhauls of government technology / processes and to help aid the ability to connect with its taxpayers, voters and citizens. The restart timing and process is well underway in different regions and we suspect it will be slow and steady with the potential for rolling lockdowns as virus hotspots emerge following increased social interaction. Around the world, we have seen success stories of governments taking advantage of technology infrastructure to organize coordinated methods of keeping citizens informed and help monitor the spread of the virus. Singapore is using WhatsApp, Twitter and Telegram to publish daily updates on Covid-19 to citizens in four different languages. In Korea, the government launched the Corona 100M app that publicly informs citizens of known cases within 100 meters of their location. Efforts, so far, to determine which people and businesses get extra capital – and how they receive it – have varied in efficiency, but we suspect there will be steady improvement. Singapore COVID Communication = Multi-Platform / Language / Format Approach to Maximize Relevance Source: Twitter, WhatsApp, Telegram Twitter WhatsApp Telegram
  21. 21 While governments are determining how to get money to

    people, there are many companies across industries that have direct / scaled / easy-to-use app-based payment relationships with customers. These include the likes of financial service (including credit card / payment) companies, communications companies, internet (including API-based) businesses and utilities. Dialogue is active and promising. And, in the world of small victories, we are encouraged that the U.S. government is discouraging the use of paper checks with its stimulus payments and including digital financial technology companies such as Intuit, PayPal and Square to participate in its emergency lending program. It’s hard to know exactly what return to work will look like. There will be many businesses that never recover. There will be many (with both small and large tweaks) that come back, some of these stronger than ever (with some doing so in spaces that will surprise us). And there will be new businesses that would have been inconceivable just a few years ago. Businesspeople know it can take a day to shut something down, but it can take years to start it back up. For many businesses, 2020, in effect, will be a lost year and the challenge will be getting to 2021 when, ideally, many business patterns we have come to know begin to resume at some scale. We believe technology infrastructure that has emerged over the past decade with remote work, on-demand businesses and mobile consumer products and apps will play critical roles in helping to balance public health considerations with America’s return to work. The costs of recent fiscal and monetary initiatives plus on-going unemployment payments are unsustainable. People need to get back to work for peace-of-mind and to help reduce the rising / on-going costs to government and taxpayers. We are hopeful that government focus in these areas will emerge in the coming weeks, and that our best- and-brightest companies will be in the mix to help people find old and new types of work, in addition to being more helpful with healthcare. 2020 = Step-Function Year for Technology + Healthcare? The front line of the battle with Covid-19 has been the institutions and individuals that make up America’s healthcare delivery system. From those ranks, millions of healthcare heroes have emerged, putting themselves and their families at risk to fight the war. America owes them honor and gratitude. Unfortunately, the pandemic also exposed a number of structural flaws in our healthcare system. Covid-19 may be the call to arms that we need to fundamentally rethink what amounts to 8% of U.S. GDP and $1.2T of federal spending in 2019 (Medicare / Medicaid / other healthcare services), representing 28% of the federal budget. Two notable healthcare observations we have had during this crisis: 1) Our healthcare delivery in the U.S. hasn’t changed as much as one would think since the Spanish Flu outbreak of 1918… Technology and innovation have had little impact on the primary care patient journey. Patient develops symptoms, patient visits a doctor’s office (possibly infecting others in the case of Covid-19), doctor diagnoses disease largely from outward symptoms, doctor sends patient home usually under ‘watch and wait,’ patient either recovers or escalates to the emergency room. That in-person diagnostic/treatment cycle is repeated during the ~500MM visits to primary care annually in the U.S., and the pattern hasn’t changed much in 100 years.
  22. 22 2) Awash in data, but lacking connectivity and insight…

    The early days of the Covid-19 crisis involved federal and state healthcare officials exchanging spreadsheets to manually track utilization and capacity at hospitals. Because the data weren’t connected, public health officials were relying on theoretical exponential models that proved to be wildly sensitive to small changes in the theoretical assumptions. Despite decades of investments in electronic health records, there remain hundreds of dark, unconnected pools of healthcare data. Even when the data are available, providers are overwhelmed by the workload and the sheer volume of the data, and therefore not getting the benefits you would expect from digitization. 490,831 461,756 505,522 481,963 0 200,000 400,000 600,000 2013 2014 2015 2016 US Primary Care Visits (000's) US Primary Care Visits = ~500MM Annually Source: US National Ambulatory Medical Care Survey (2013 – 2016) Electronic Health Records (EHR) = Organizing Patient Data EHR Adoption, USA 0% 50% 100% 2004 2006 2008 2010 2012 2014 2016 % Using E.H.R. System Source: Office for National Coordination of Health Information Technology. Stanford / Harris poll of 521 Primary Care physicians in USA (Family Practice, General Practice, or Internal Medicine) recruited through the American Medical Association. All have been using EHR for at least 1 month Note: Adoption of EHR refers to any EHR system being used by Office-based physicians or hospitals, does not imply all records are kept electronically. …EHR Usage = Still Early Innings EHR Adoption = Nearing 100%… Physician’s Offices Hospitals Top Physician ‘Wants’ for Future EHR Development, per Stanford / Harris Poll, 9/18 67% 43% 32% 0% 40% 80% Interoperability Predictive Analytics Financial / Cost Data Integration Physician Burnout Contributors = Bureaucratic Tasks / IT Tools Hurting Efficiency / Lack of Autonomy… Source: KLAS
  23. 23 We think that many healthcare innovation trends, already underway,

    will only accelerate due to Covid-19 as we continue the push to decentralize medicine away from hospitals and empower patients as consumers: • Telehealth – Telemedicine is faster, often delivers better quality, and is almost always cheaper than traditional delivery systems. It has already advanced rapidly in recent years (chart below) and in the Covid-19 environment, can help keep people at home, flatten the curve, and save lives. • Connected Devices – Internet connected monitoring devices, when deployed alongside telemedicine can enhance its efficacy and can help to produce better outcomes across the clinical spectrum, ranging from chronic to infectious disease. • Rapid Point-of-Care Diagnostics – Molecular testing has not made it to the home – or really even in the physician’s office – even though the underlying technology to perform rapid / accurate molecular diagnostics has been around for a decade or more. It’s time to expect the iPhone equivalent of diagnostics, and there are a number of technology companies making great progress on that vision. Covid-19 is a reminder that regulatory and reimbursement paradigms need to shift from being an impediment to an incentive for such innovation. • Connecting the Dark Pools – Healthcare is just beginning to embrace the modern data architecture of interoperability and APIs. In the Covid-19 environment, the pressure to connect systems is greater than ever and we expect innovative companies, together with government support, to accelerate connectivity without the intensive integration requirements of past attempts. • Applying Automation and Artificial Intelligence – The current crisis is a reminder that our healthcare labor resources were already stretched thin. Automation will continue to make inroads in healthcare to reduce workload and improve the quality of data capture. Applied / vertical artificial intelligence is just beginning to be paired with abundant EHR data to drive the right insights to the right providers at the right time. Telehealth Engagement = Rising Dramatically Source: Google Trends as of 4/17/20. Note: Numbers represent search interest relative to the highest point on the chart for the given region and time. A value of 100 is the peak popularity for the term. – 20 40 60 80 100 120 4/19 5/19 6/19 7/19 8/19 9/19 10/19 11/19 12/19 1/20 2/20 3/20 US Google Trends Interest (100 = Peak Interest) US Telemedicine Searches (Google Trends)
  24. 24 Traditional Sports = Post Covid-19 Evolution Provides Real-Time Engagement

    Clues for Other Businesses America’s passion for contact and near-contact sports is legendary. America’s top draws are team sports like football, baseball, basketball, soccer and ice hockey. Other top draws include limited-contact individual sports like motorsports, golf and eSports. Social distancing is not the way athletes and in-person fans participate in the most popular sports. Sports organizations around the world are being forced to re-think how players (and fans) engage in play and what the on-site experiences will be like in 2-12 months. Will Shanghai Disney Resort’s new process of requiring guests to wear masks / allow for temperature checks / virus- free credentials (on mobile devices) be the new norm until we have a vaccine? Will we shift to biometric check in for fans? What about athletes and support crews? The rapid evolution of sports in our new world provides clues to the ways real-time engagement in other types of businesses may evolve…in effect, in many ways, like one big Zoom Room. It’s notable that we have seen the likes of Twitch and Discord continue to move beyond their original gaming use cases (of connecting / sharing / collaborating) into social / business environment uses. This trend will continue. Traditional Sport / Professionals (NASCAR & Formula One) Move Online… On March 17, NASCAR & iRacing announced the formation of the eNASCAR iRacing Pro Invitational Series, an esports series with the sport’s most talented and popular drivers. This was a Covid-19 driven evolution to the amateur gaming iRacing series which launched in 2010. Competitors use virtual simulators (often from their homes) to race one another, all while being broadcast live on Fox Sports with lots of social media action. NASCAR summed it up by saying, ‘Until we have cars back on track, the entire NASCAR community has aligned to provide our passionate fans with a unique, fun and competitive experience on race day.’ The first race at virtual Homestead-Miami Speedway on March 22 was won by Denny Hamlin, a three-time Daytona 500 champ – he raced barefoot with his daughter cheering him on. Notably, racing legend Dale Earnhardt Jr. came out of retirement to compete and placed second. The second race at Texas Motor Speedway on March 29 drew 1.3MM viewers (up 43% week-on-week) and broke the record for eSports TV viewership set by the previous week’s race1. While there isn’t a winner’s purse for the Pro Invitational Series (yet), some racers are pursuing sponsorship deals on car e-paint schemes. Penn National Gaming announced it would serve as the sponsor of the upcoming virtual race at Dover International Speedway on May 3 – the race will feature content / integration from Barstool Sports’ (a Penn Gaming subsidiary) personalities to help fans feel more connected to the live event. eNASCAR iRacing Pro Invitational Series = Homestead-Miami Speedway (3/22) Source: iRacing, SportsCenter Live View – Racer Perspective SportsCenter Post-Race Coverage eNASCAR iRacing Pro Invitational Series = Social Media Coverage Denny Hamlin Source: Twitter 1 Nielsen Sports.
  25. 25 On March 22, Formula 1 debuted its esports Virtual

    Grand Prix race. Formula 1 drivers / celebrities / sports stars competed on Bahrain’s Sakhir circuit. The race was streamed on YouTube, Twitch and Facebook and had 3.2MM viewers. Traditional Sport Tournament (College Basketball) Moves Online & Artificial Intelligence Predicts Outcomes… On March 11, in lieu of March Madness 2020, College Basketball subreddit’s 1.2MM members began filling in their brackets and are streaming an unofficial 68-team simulated NCAA Tournament using the game College Hoops 2K81. The basketball games are streamed on YouTube and outcomes are determined using computer vs. computer match ups on the games. Subreddit moderators chose College Hoops 2K8, a 12-year old game, as it allowed them to customize rosters and create teams (like Northern Kentucky) that did not exist in earlier versions of College Hoops that made the field this year. First round match ups were completed in the second half of March, with Kansas, Gonzaga, Dayton and Baylor as the four #1 seeds. Final Four games are underway – with sixth seed West Virginia taking on fifth seed BYU and third seed Seton Hall facing the #1 seed Gonzaga. Final Four games will begin streaming live on YouTube on 4/18. College Basketball Subreddit = 2020 NCAA Men’s March Madness Bracket Source: Reddit College Basketball Subreddit = College Hoops 2K8 Simulated Tournament Streamed on YouTube Source: YouTube College Basketball Subreddit = College Hoops 2K8 Simulated Game on YouTube Source: YouTube 1 Published by Take-Two Interactive’s 2K Sports.
  26. 26 Traditional Player / Gamer Athletes (NBA & FIFA) Compete

    Online… On March 18, FIFA La Liga clubs Real Betis and Sevilla player / gamers Borja Iglesias and Sergio Reguilón played their team’s canceled match on FIFA 20. 60K+ people streamed the match on Twitch. Beginning on April 3, the NBA & 2K Sports launched a players-only NBA 2K tournament hosting sixteen player / gamers including Kevin Durant, Trae Young and Harrison Barnes. The tournament was broadcast on ESPN over a span of ten days with Devin Booker of the Phoenix Suns claiming the title. NBA 2K20 = 16 Player Tournament Streaming on YouTube Source: Twitter, YouTube FIFA 20 = Players Streaming Matches in Place of Live Match Source: YouTube Borja Iglesias vs. Sergio Reguilón Play a FIFA 20 Match in Place of Real Betis vs. Sevilla Match (3/18)
  27. 27 Online Competitive Gaming Growth Continues… In March, Twitch hit

    all-time high usage levels with peak daily active users (4.3MM), average concurrent viewers (1.9MM) and number of streams (46MM)1. Steam’s gaming platform hit an all-time high number of concurrent users, with 20MM online and 6.2MM in-game on March 152. Discord’s video / voice / text chat platform for gamers has seen downloads more than double over the past month. League of Legends remains one of the top watched esports on Twitch, with 430K peak viewers and +123MM streaming hours in March3 tuning in to watch professionals compete on the League of Legends Championship Series. More casual use cases include watching professional players practice, celebrities / athletes hosting watch parties to connect fans, or users watching expert players to learn new skills. As live sports have come to a halt, esports & gaming have provided a medium for users to engage in competition (via live games or streaming competition), virtually connect with friends / other gamers across the globe and help players learn and improve skills through streaming. Play Remains Foundational, In Spite of Shelter-in-Place… Humans will find ways to compete in any world (offline or online) and, the more playful it is the better. Sports will continue to thrive. We believe media innovations around the sports we love that surface during this time of social distancing and staying-at-home have the potential to transform the way traditional sports are consumed and, in turn, drive more engaging / entertaining / interactive experiences for athletes and fans. In addition, we believe fans will always covet in-person experiences and competition, as long as they feel safe and can have fun. League of Legends = Fans Tuning in to Watch League of Legends Championship Series Source: Twitch G2 Esports vs. MAD Lions (2020) Stream on Twitch Discord = Server Allowing Players to Play + Talk + Text + Share Source: Discord Fornite Discord Server 1 SullyGenome. 2 Steam Database. 3 TwitchTracker.
  28. 28 5) ‘The World Just Doesn’t End That Often’ =

    We Will Get Through This…But Life Will Be Different… The quotation above is from Brian Rogers, T. Rowe Price Chairman / CIO, during the financial crisis in 2008. We are optimists and believe there is hope on the other side of despair. That ‘other side’ can’t come soon enough. Most experts are measuring the other side in terms of months, not years – that’s good news, albeit relative. While clean hands, social distancing, self-isolation and quarantines are table stakes, we need personal protective equipment for healthcare workers, ventilators, antivirals, vaccines, accessible testing / tracing, rapid diagnostics, telehealth at scale and planning / preparation for the next virus and the next one. We also need government, business and entrepreneurial intervention at scale (deployed logically and effectively) to get to the other side. All must work together to ensure jobs and restart the economy so citizens have confidence they can work, have sufficient safety nets and take care of themselves, families and loved ones. As America’s former Secretary of State and National Security Advisor Henry Kissinger wrote1 ‘the pandemic will forever alter the world order…global leaders have learned important lessons from the 2008 financial crisis…the current economic crisis is more complex: the contraction unleashed by the coronavirus is, in its speed and global scale, unlike anything ever known in history…the U.S. must protect citizens from disease while starting the urgent work of planning for a new epoch.’ Our standards of living are being threatened. Some data suggest we are careening to the next great depression, that our confidence (and our balance sheets) will be shattered and unemployment will overwhelm. That growth (in part, driven by the torrid ramp of rising global connectivity) over the past 2-3 decades has seen its best days. That the adjustments to slowing growth will cause on-going nasty wide-spread dislocations. That early anti-connectivity signals of closing borders (initially related to virus spreading concerns) could evolve into more nationalism, supply-chain restructuring and a reversal of globalization which has been a foundational economic growth driver of the past several decades. This all could be true, but… While we have trepidations about what the coming months and quarters may have in store, for the long-term, we remain in the ‘darkest before dawn’ camp. We have been trained not to underestimate America’s global advantages, her spirit and optimism…and ability to rapidly innovate and help make the world a better place. What if? What if Covid-19 serves as a common enemy that unites and serves as a forcing function to: 1) Modernize and improve government / healthcare / education driving lower cost and more efficiency 2) Improve coordination between government and business for the good of citizens 3) Help people find jobs (and training) best suited to their skills and lifestyles 4) Promote more considered consumption 5) Get back to basics including staying closer to home 6) Bolster family connectedness / seriousness of purpose / community / faith? None of what we are going through is comfortable, or fair. And while things will likely get worse before they get better, has America, perhaps, just gotten the wake-up call it needed to get to a better place? Let’s hope so, and let’s find the best ways to get to the other side as quickly and thoughtfully as possible. We close with a recent observation from one of the more talented entrepreneurs / business builders of her generation, ‘We entered this time at business highs, but social lows and deeply fragmented as a society. And yet, Covid-19 does not discriminate, and its response requires complete unity – public, private, neighbors, employees, healthcare workers, strangers...What if we exit as a more united people and world?’ 1 The Wall Street Journal – 4/3/2020.
  29. 29 DISCLAIMER BOND is a global technology investment firm that

    supports visionary founders throughout their life cycle of innovation & growth. BOND’s founding partners have backed industry pioneers such as DocuSign, Peloton, Spotify, Square & Uber. This document, including the information contained herein, has been compiled for informational purposes only & does not constitute an offer to sell or a solicitation of an offer to purchase any security. Such offer or solicitation shall only be made pursuant to offering documents related to such security, if any. The document relies on data + insights from a wide range of sources, including public + private companies, market research firms + government agencies. We cite specific sources where data are public; the document is also informed by non-public information + insights. We disclaim any + all warranties, express or implied, with respect to the document. No document content should be construed as professional advice of any kind (including legal or investment advice). We may post updates, revisions, or clarifications of this document on Bond’s website (www.bondcap.com). BOND owns significant equity positions in certain of the companies referenced in this document.