Upgrade to Pro — share decks privately, control downloads, hide ads and more …

What Happens to Energy Costs When a Factory Add...

Sponsored · Your Podcast. Everywhere. Effortlessly. Share. Educate. Inspire. Entertain. You do you. We'll handle the rest. →
Avatar for spider energy spider energy
September 22, 2026

What Happens to Energy Costs When a Factory Adds a New High-Power Production Line

Spider Energy provides smart EV charging solutions for homes, apartments, hotels, restaurants, office spaces, commercial properties, retail destinations, and highways across Andhra Pradesh and Telangana. As electric vehicle adoption continues to grow, Spider Energy helps homeowners, businesses, and property owners build future-ready charging infrastructure that enhances convenience, attracts EV users, increases footfall, and creates new revenue opportunities. From residential charging setups to commercial charging stations and franchise partnerships, Spider Energy delivers reliable, scalable, and technology-driven charging solutions designed to support the future of sustainable mobility.

Avatar for spider energy

spider energy

September 22, 2026

More Decks by spider energy

Other Decks in Business

Transcript

  1. wWhat Happens to Energy Costs When a Factory Adds a

    New High-Power Production Line? A practical guide to understanding tariff impacts, demand charges, and cost control strategies for Indian industrial facilities.
  2. Quick Answer Key Facts at a Glance A new high-power

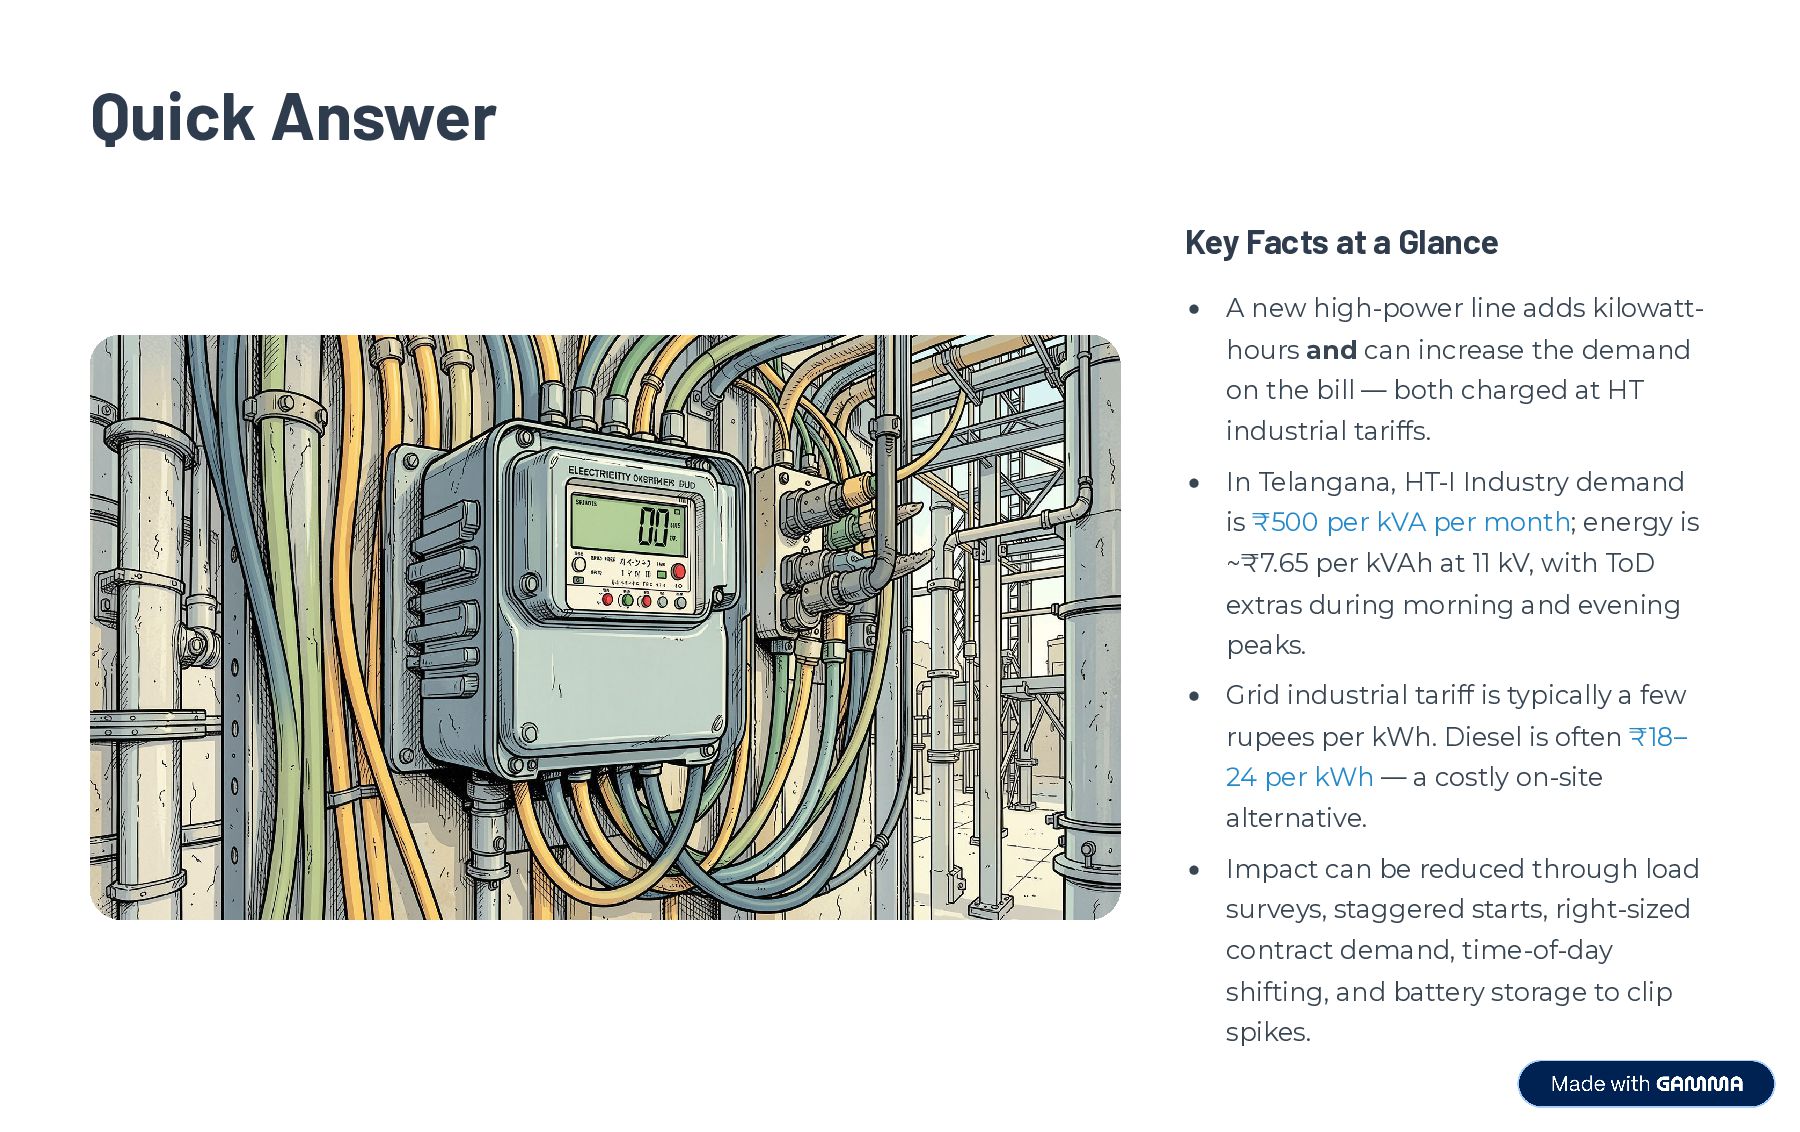
    line adds kilowatthours and can increase the demand on the bill — both charged at HT industrial tariffs. In Telangana, HT-I Industry demand is ₹500 per kVA per month; energy is ~₹7.65 per kVAh at 11 kV, with ToD extras during morning and evening peaks. Grid industrial tariff is typically a few rupees per kWh. Diesel is often ₹18– 24 per kWh — a costly on-site alternative. Impact can be reduced through load surveys, staggered starts, right-sized contract demand, time-of-day shifting, and battery storage to clip spikes.
  3. What Happens When Production Costs Increase Margin Squeeze Working-Capital Drain

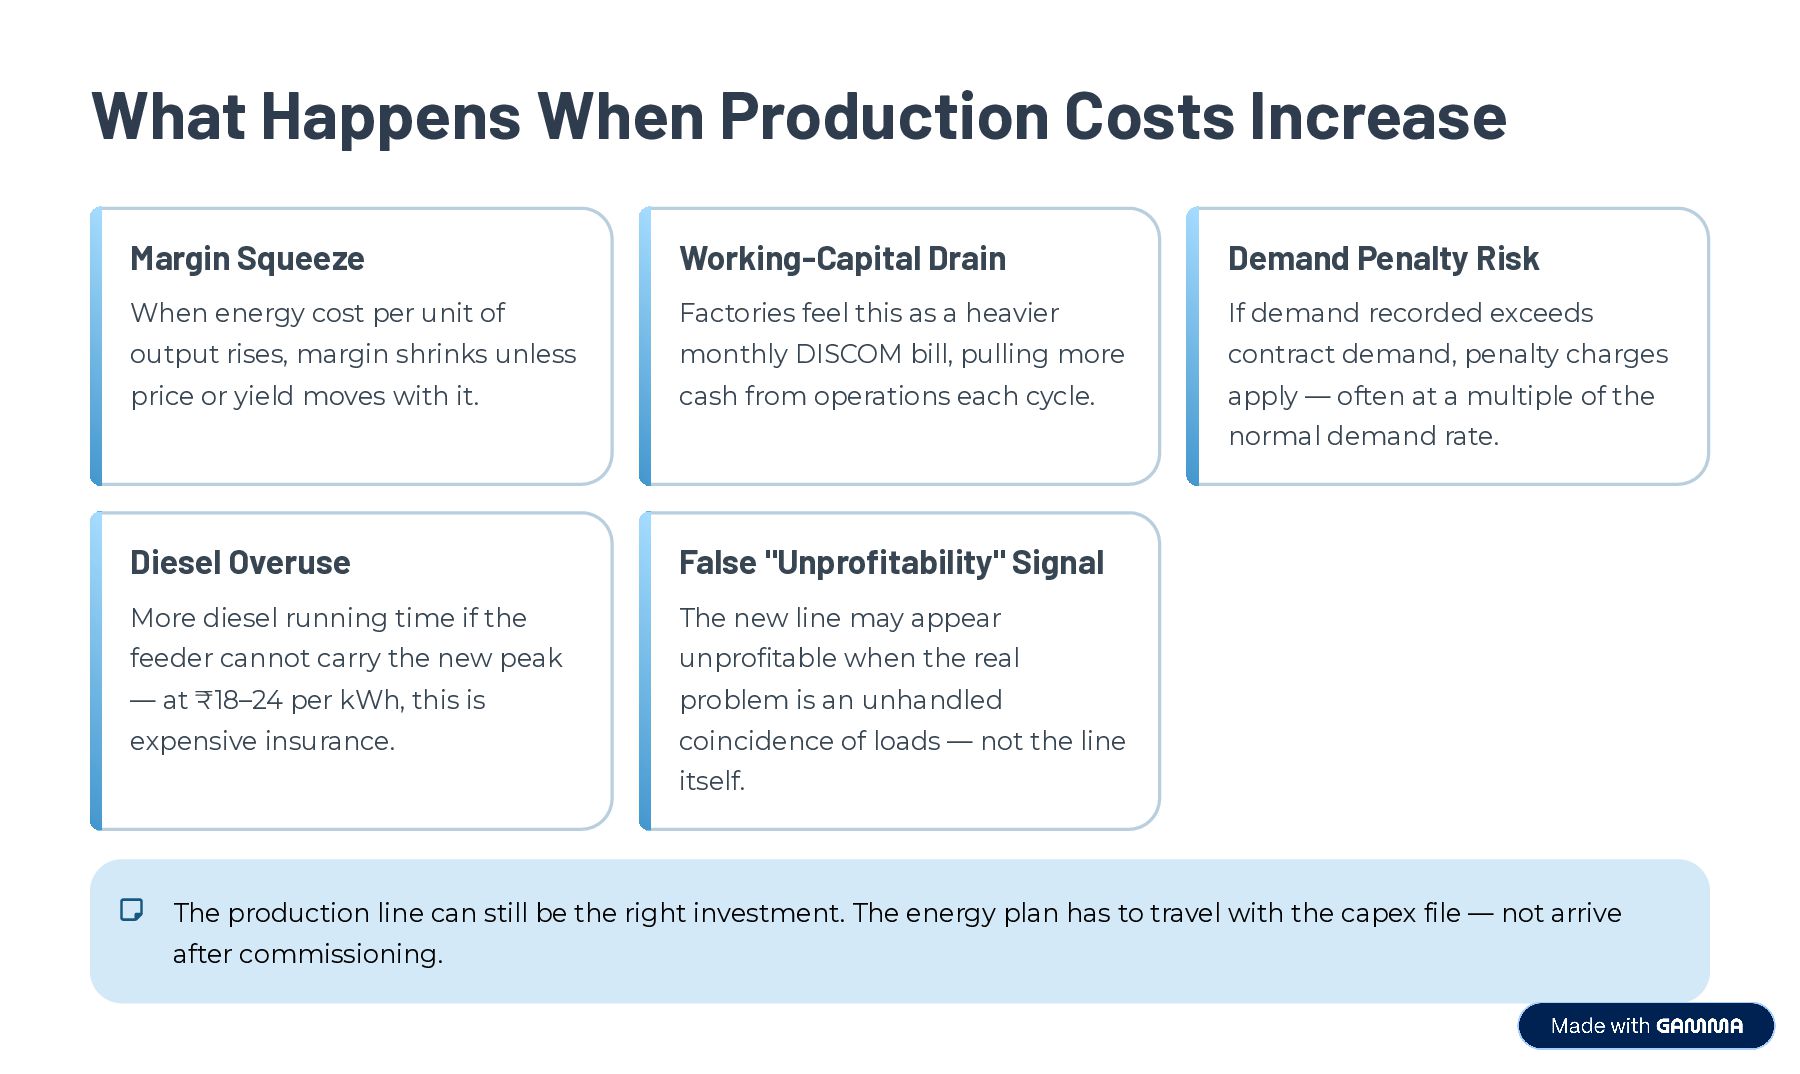
    Demand Penalty Risk When energy cost per unit of Factories feel this as a heavier If demand recorded exceeds output rises, margin shrinks unless monthly DISCOM bill, pulling more contract demand, penalty charges price or yield moves with it. cash from operations each cycle. apply — often at a multiple of the normal demand rate. Diesel Overuse False "Unprofitability" Signal More diesel running time if the The new line may appear feeder cannot carry the new peak unprofitable when the real — at ₹18–24 per kWh, this is problem is an unhandled expensive insurance. coincidence of loads — not the line itself. The production line can still be the right investment. The energy plan has to travel with the capex file — not arrive after commissioning.
  4. How Much Is 1 kWh of Electricity? One kilowatt-hour is

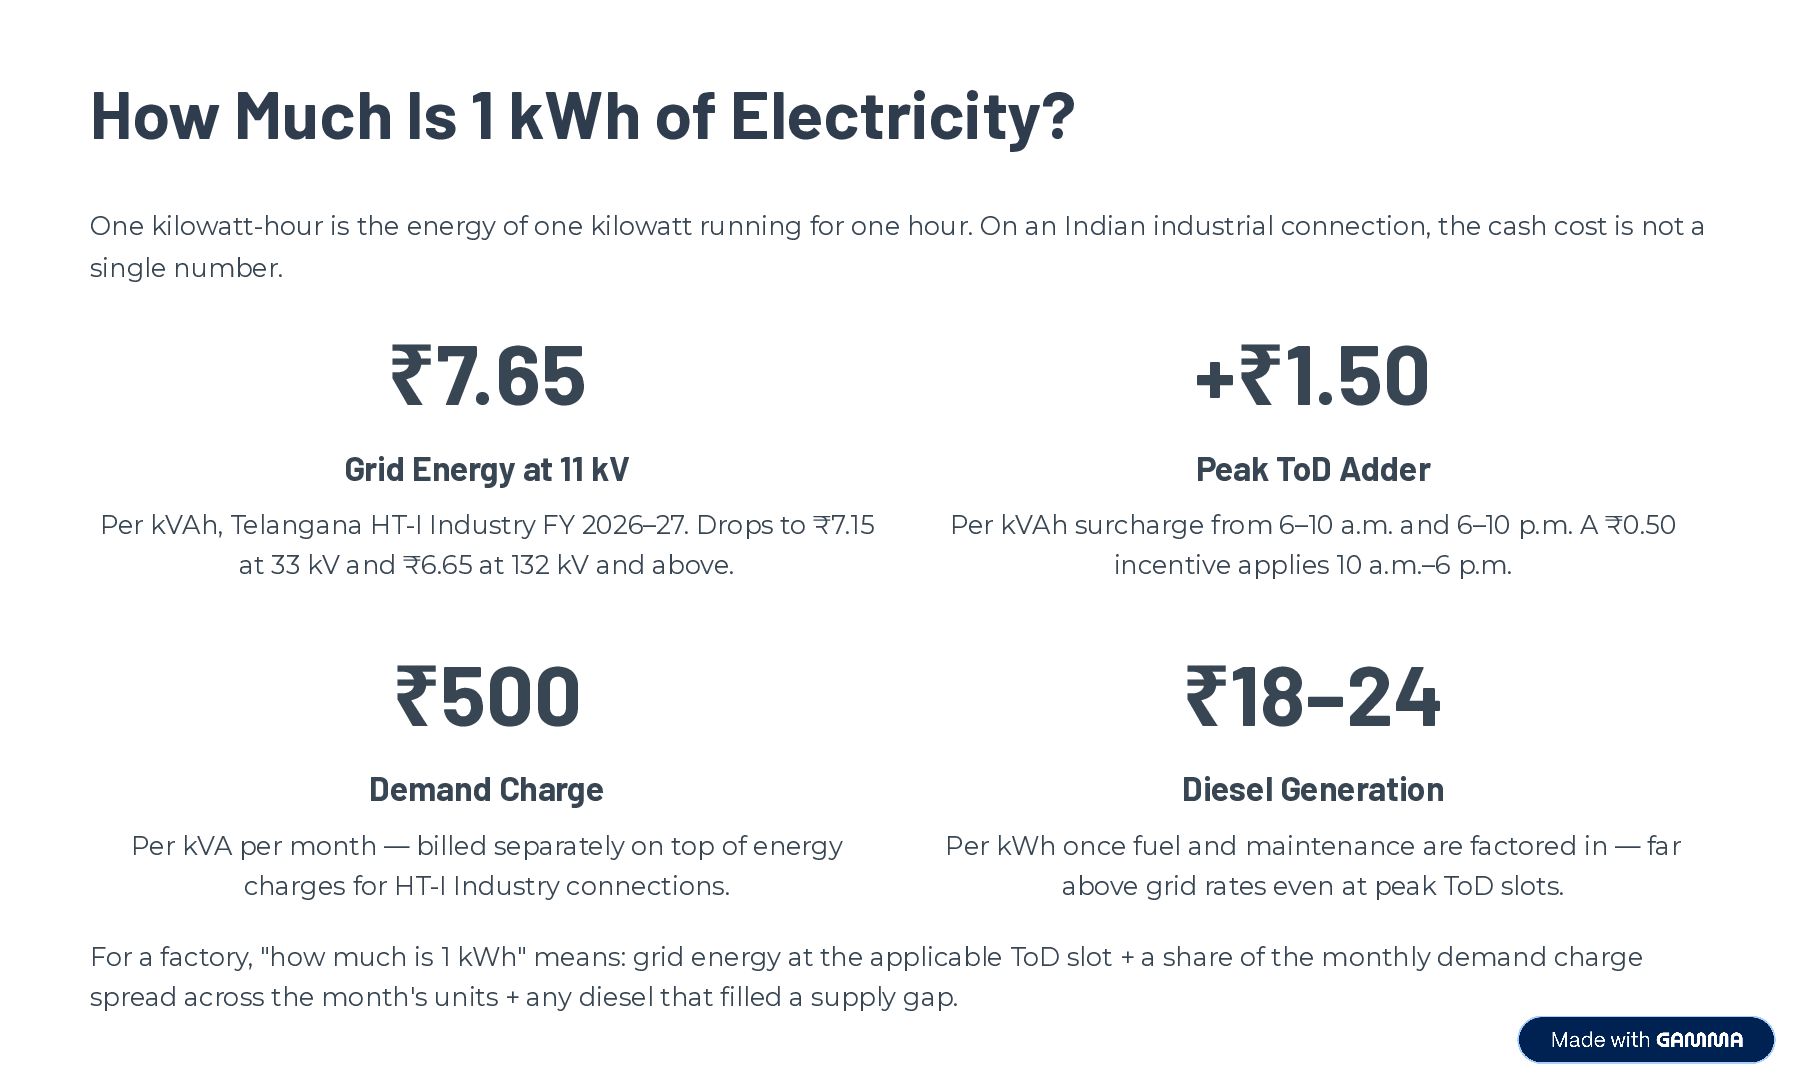
    the energy of one kilowatt running for one hour. On an Indian industrial connection, the cash cost is not a single number. ₹7.65 +₹1.50 Grid Energy at 11 kV Peak ToD Adder Per kVAh, Telangana HT-I Industry FY 2026–27. Drops to ₹7.15 Per kVAh surcharge from 6–10 a.m. and 6–10 p.m. A ₹0.50 at 33 kV and ₹6.65 at 132 kV and above. incentive applies 10 a.m.–6 p.m. ₹500 ₹18–24 Demand Charge Diesel Generation Per kVA per month — billed separately on top of energy Per kWh once fuel and maintenance are factored in — far charges for HT-I Industry connections. above grid rates even at peak ToD slots. For a factory, "how much is 1 kWh" means: grid energy at the applicable ToD slot + a share of the monthly demand charge spread across the month's units + any diesel that filled a supply gap.
  5. Where Power Lines Get Their Energy From The Supply Chain

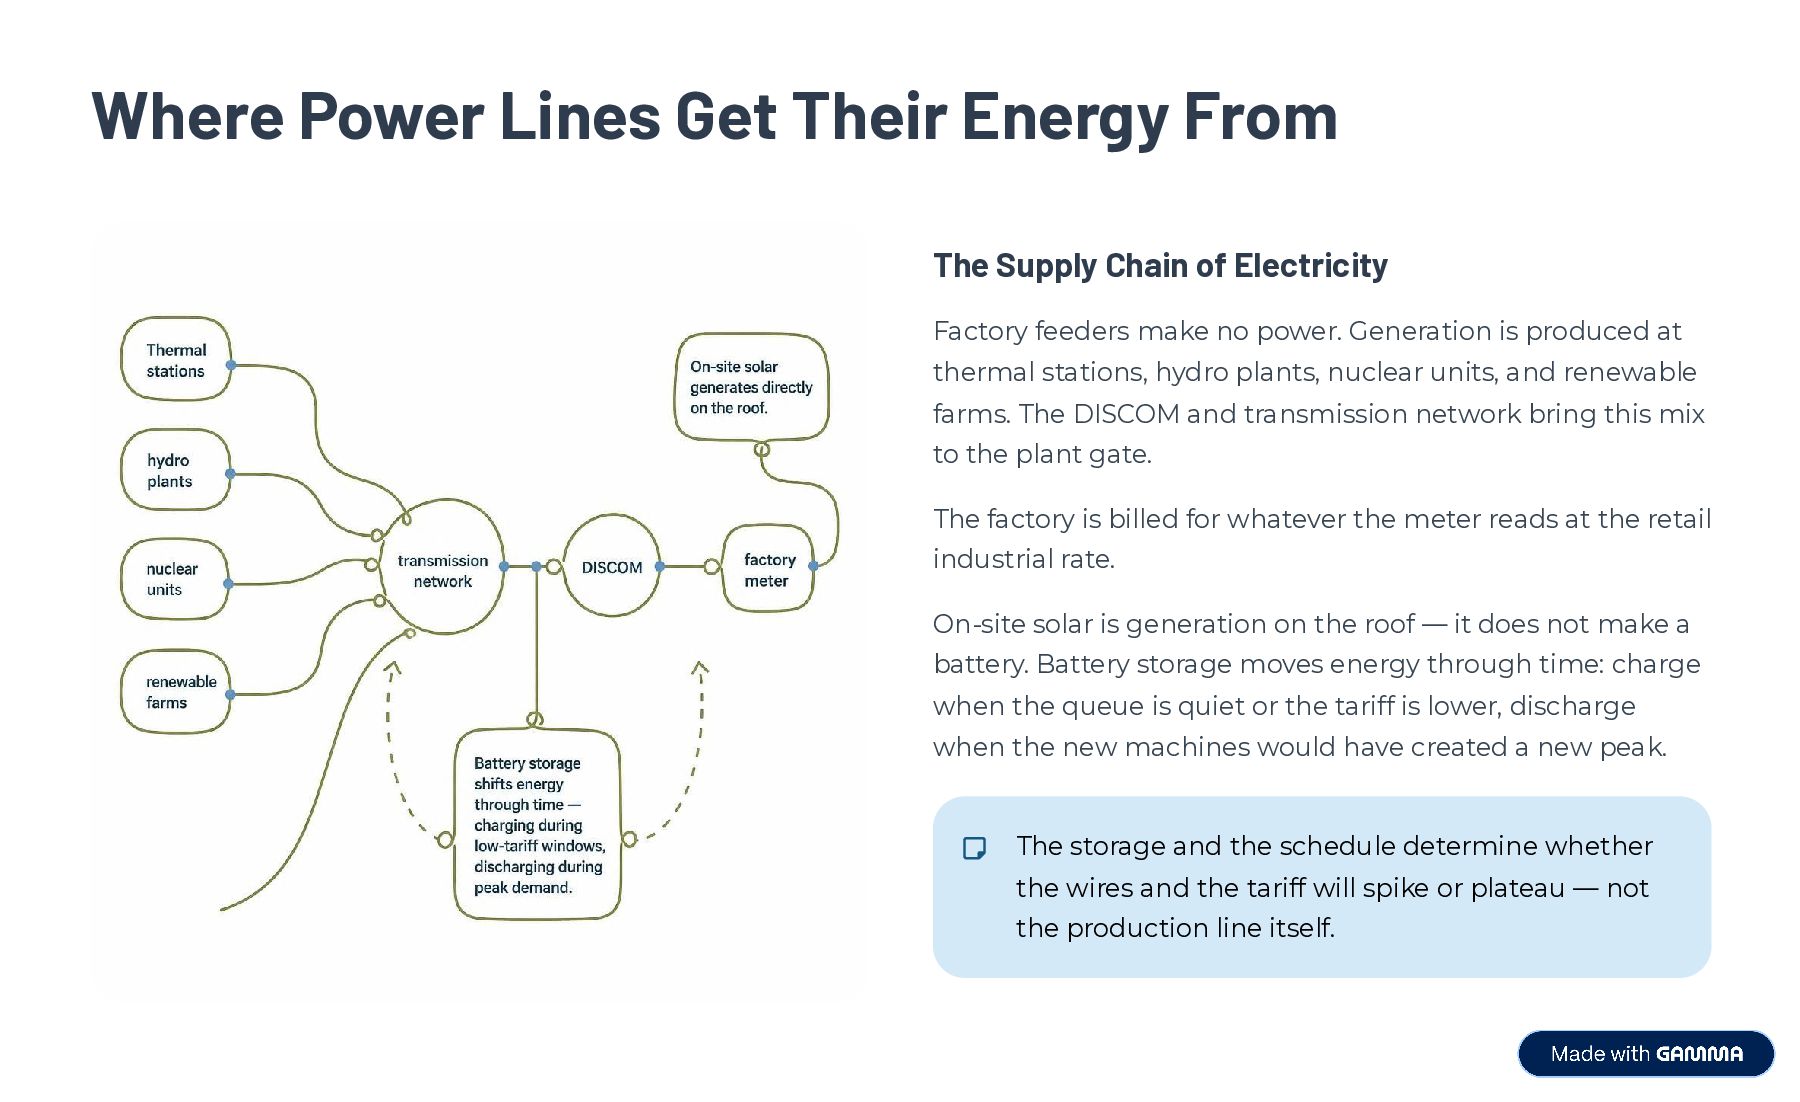
    of Electricity Factory feeders make no power. Generation is produced at thermal stations, hydro plants, nuclear units, and renewable farms. The DISCOM and transmission network bring this mix to the plant gate. The factory is billed for whatever the meter reads at the retail industrial rate. On-site solar is generation on the roof — it does not make a battery. Battery storage moves energy through time: charge when the queue is quiet or the tariff is lower, discharge when the new machines would have created a new peak. The storage and the schedule determine whether the wires and the tariff will spike or plateau — not the production line itself.
  6. The Most Expensive Ways to Produce or Buy Electricity 1

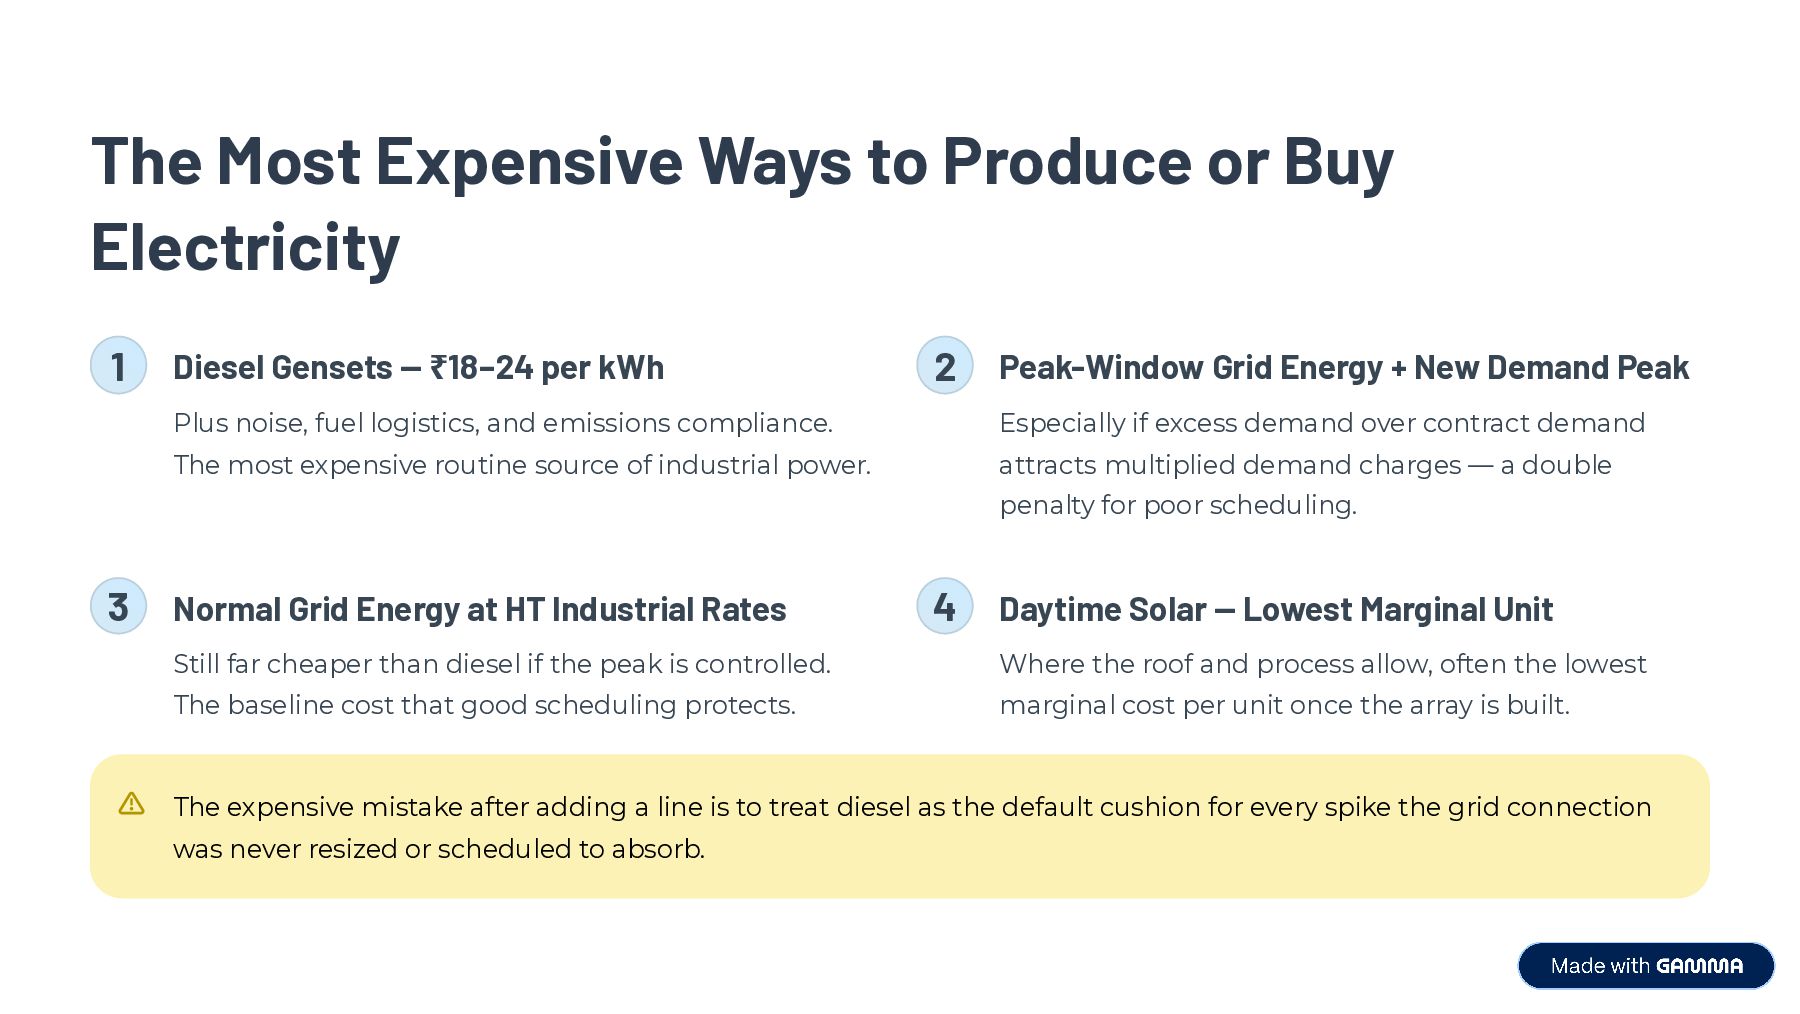
    Diesel Gensets — ₹18–24 per kWh 2 Peak-Window Grid Energy + New Demand Peak Plus noise, fuel logistics, and emissions compliance. Especially if excess demand over contract demand The most expensive routine source of industrial power. attracts multiplied demand charges — a double penalty for poor scheduling. 3 Normal Grid Energy at HT Industrial Rates 4 Daytime Solar — Lowest Marginal Unit Still far cheaper than diesel if the peak is controlled. Where the roof and process allow, often the lowest The baseline cost that good scheduling protects. marginal cost per unit once the array is built. The expensive mistake after adding a line is to treat diesel as the default cushion for every spike the grid connection was never resized or scheduled to absorb.
  7. What the New Line Actually Does to the Bill Energy

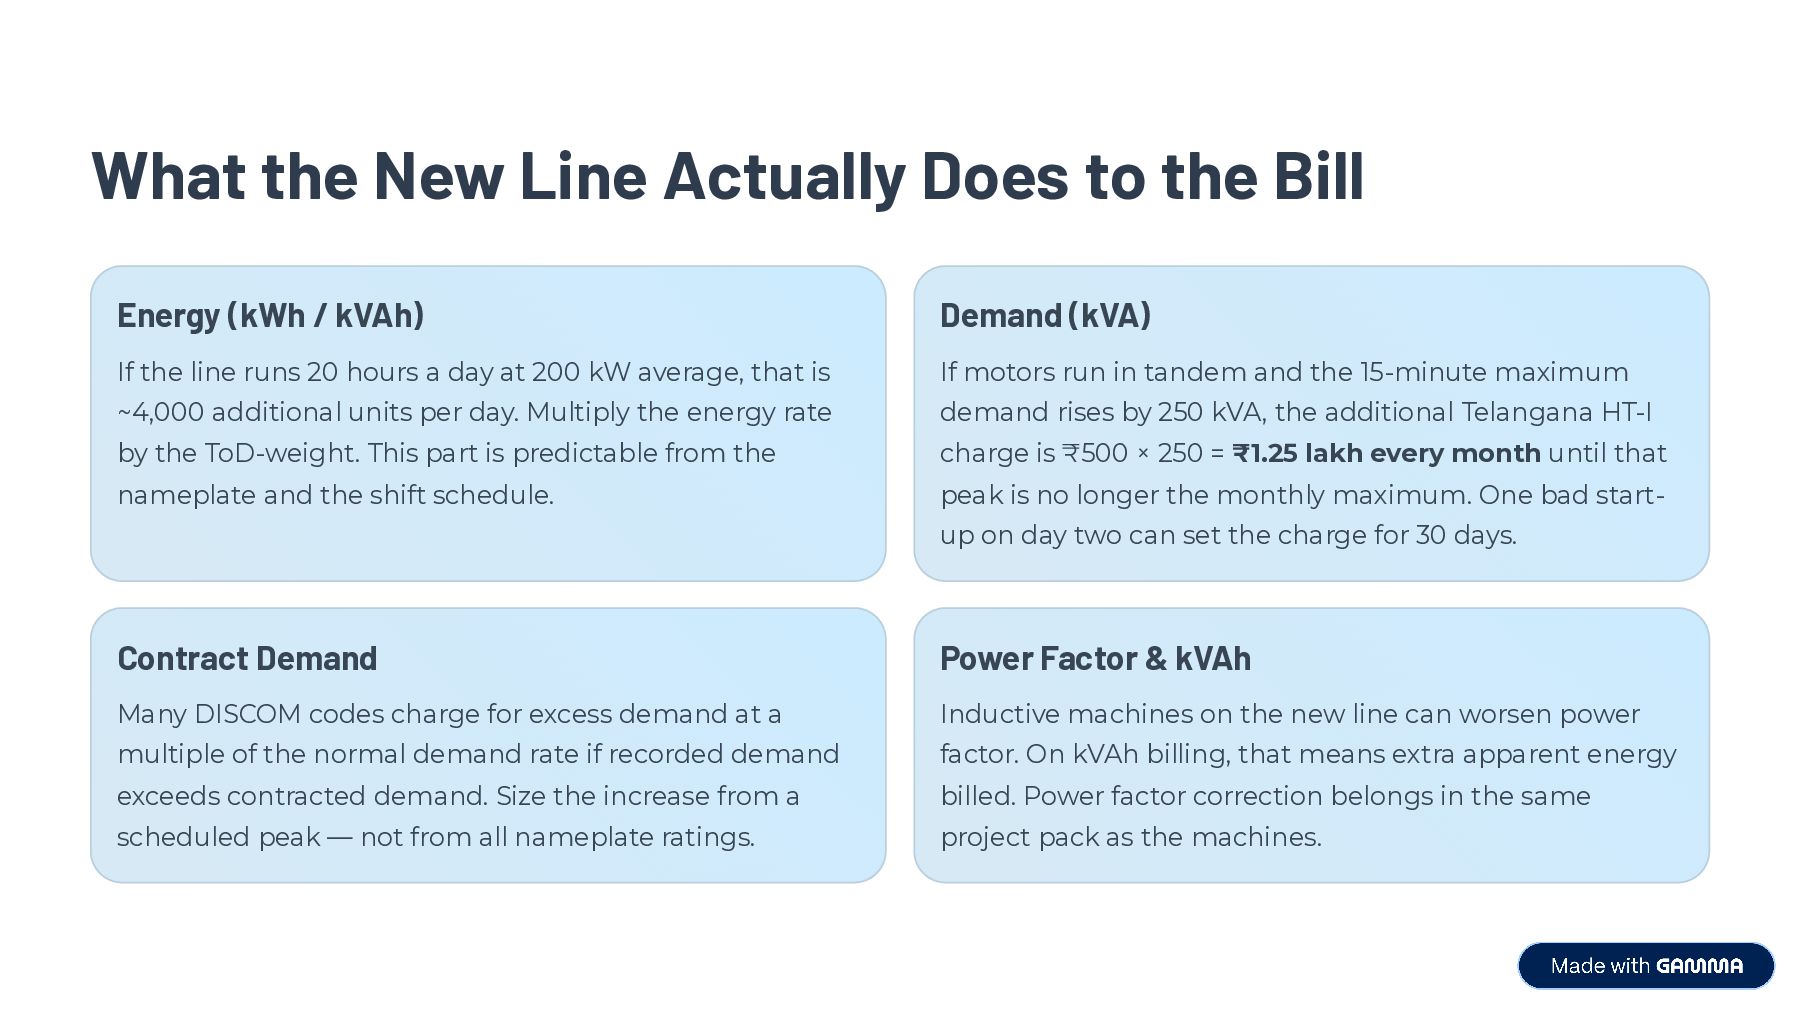
    (kWh / kVAh) Demand (kVA) If the line runs 20 hours a day at 200 kW average, that is If motors run in tandem and the 15-minute maximum ~4,000 additional units per day. Multiply the energy rate demand rises by 250 kVA, the additional Telangana HT-I by the ToD-weight. This part is predictable from the charge is ₹500 × 250 = ₹1.25 lakh every month until that nameplate and the shift schedule. peak is no longer the monthly maximum. One bad startup on day two can set the charge for 30 days. Contract Demand Power Factor & kVAh Many DISCOM codes charge for excess demand at a Inductive machines on the new line can worsen power multiple of the normal demand rate if recorded demand factor. On kVAh billing, that means extra apparent energy exceeds contracted demand. Size the increase from a billed. Power factor correction belongs in the same scheduled peak — not from all nameplate ratings. project pack as the machines.
  8. How to Reduce Production Costs on the Energy Side These

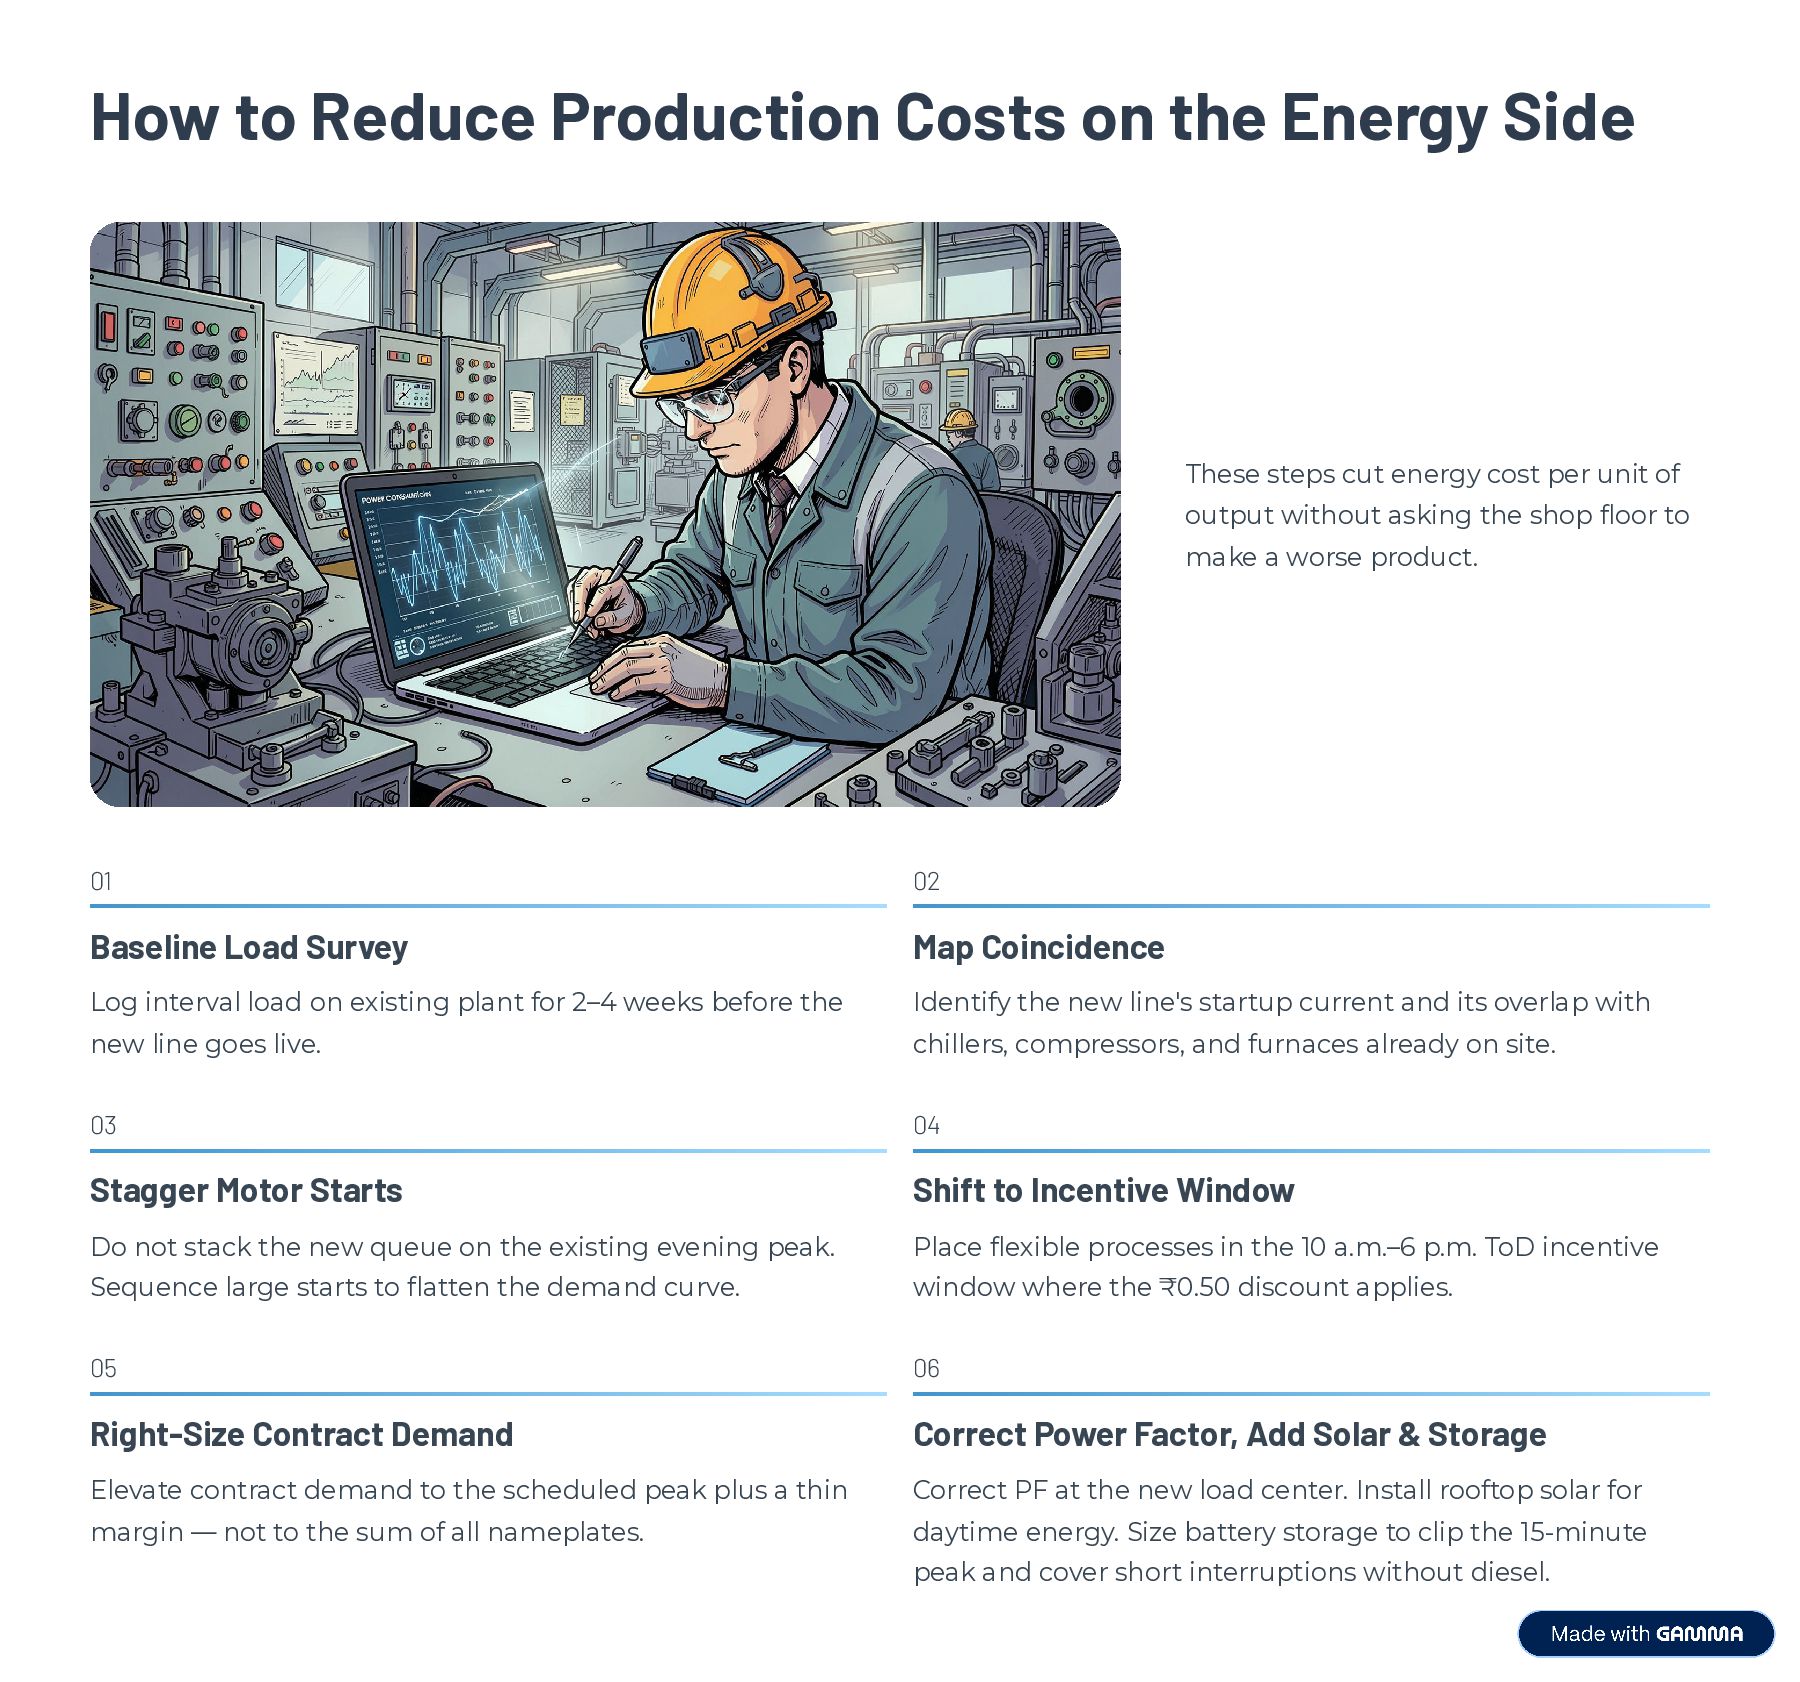
    steps cut energy cost per unit of output without asking the shop floor to make a worse product. 01 02 Baseline Load Survey Map Coincidence Log interval load on existing plant for 2–4 weeks before the Identify the new line's startup current and its overlap with new line goes live. chillers, compressors, and furnaces already on site. 03 04 Stagger Motor Starts Shift to Incentive Window Do not stack the new queue on the existing evening peak. Place flexible processes in the 10 a.m.–6 p.m. ToD incentive Sequence large starts to flatten the demand curve. window where the ₹0.50 discount applies. 05 06 Right-Size Contract Demand Correct Power Factor, Add Solar & Storage Elevate contract demand to the scheduled peak plus a thin Correct PF at the new load center. Install rooftop solar for margin — not to the sum of all nameplates. daytime energy. Size battery storage to clip the 15-minute peak and cover short interruptions without diesel.
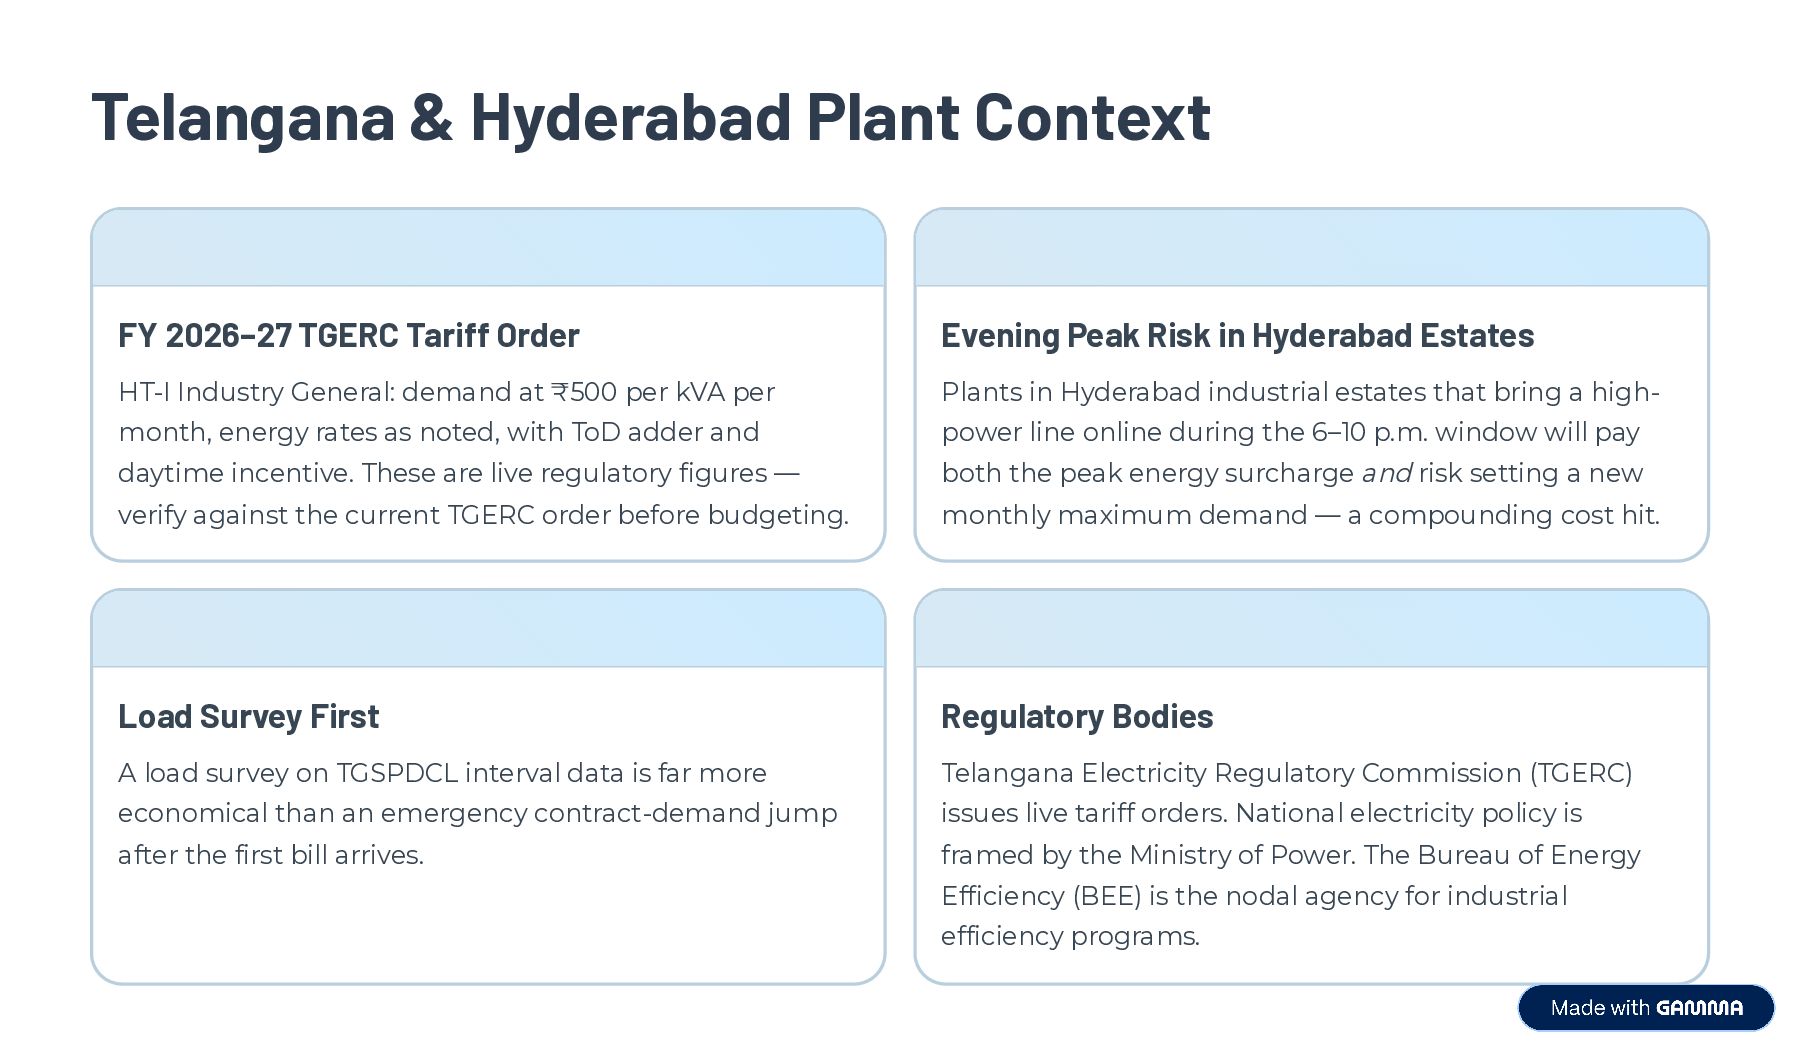
  9. Telangana & Hyderabad Plant Context FY 2026–27 TGERC Tariff Order

    Evening Peak Risk in Hyderabad Estates HT-I Industry General: demand at ₹500 per kVA per Plants in Hyderabad industrial estates that bring a high- month, energy rates as noted, with ToD adder and power line online during the 6–10 p.m. window will pay daytime incentive. These are live regulatory figures — both the peak energy surcharge and risk setting a new verify against the current TGERC order before budgeting. monthly maximum demand — a compounding cost hit. Load Survey First Regulatory Bodies A load survey on TGSPDCL interval data is far more Telangana Electricity Regulatory Commission (TGERC) economical than an emergency contract-demand jump issues live tariff orders. National electricity policy is after the first bill arrives. framed by the Ministry of Power. The Bureau of Energy Efficiency (BEE) is the nodal agency for industrial efficiency programs.
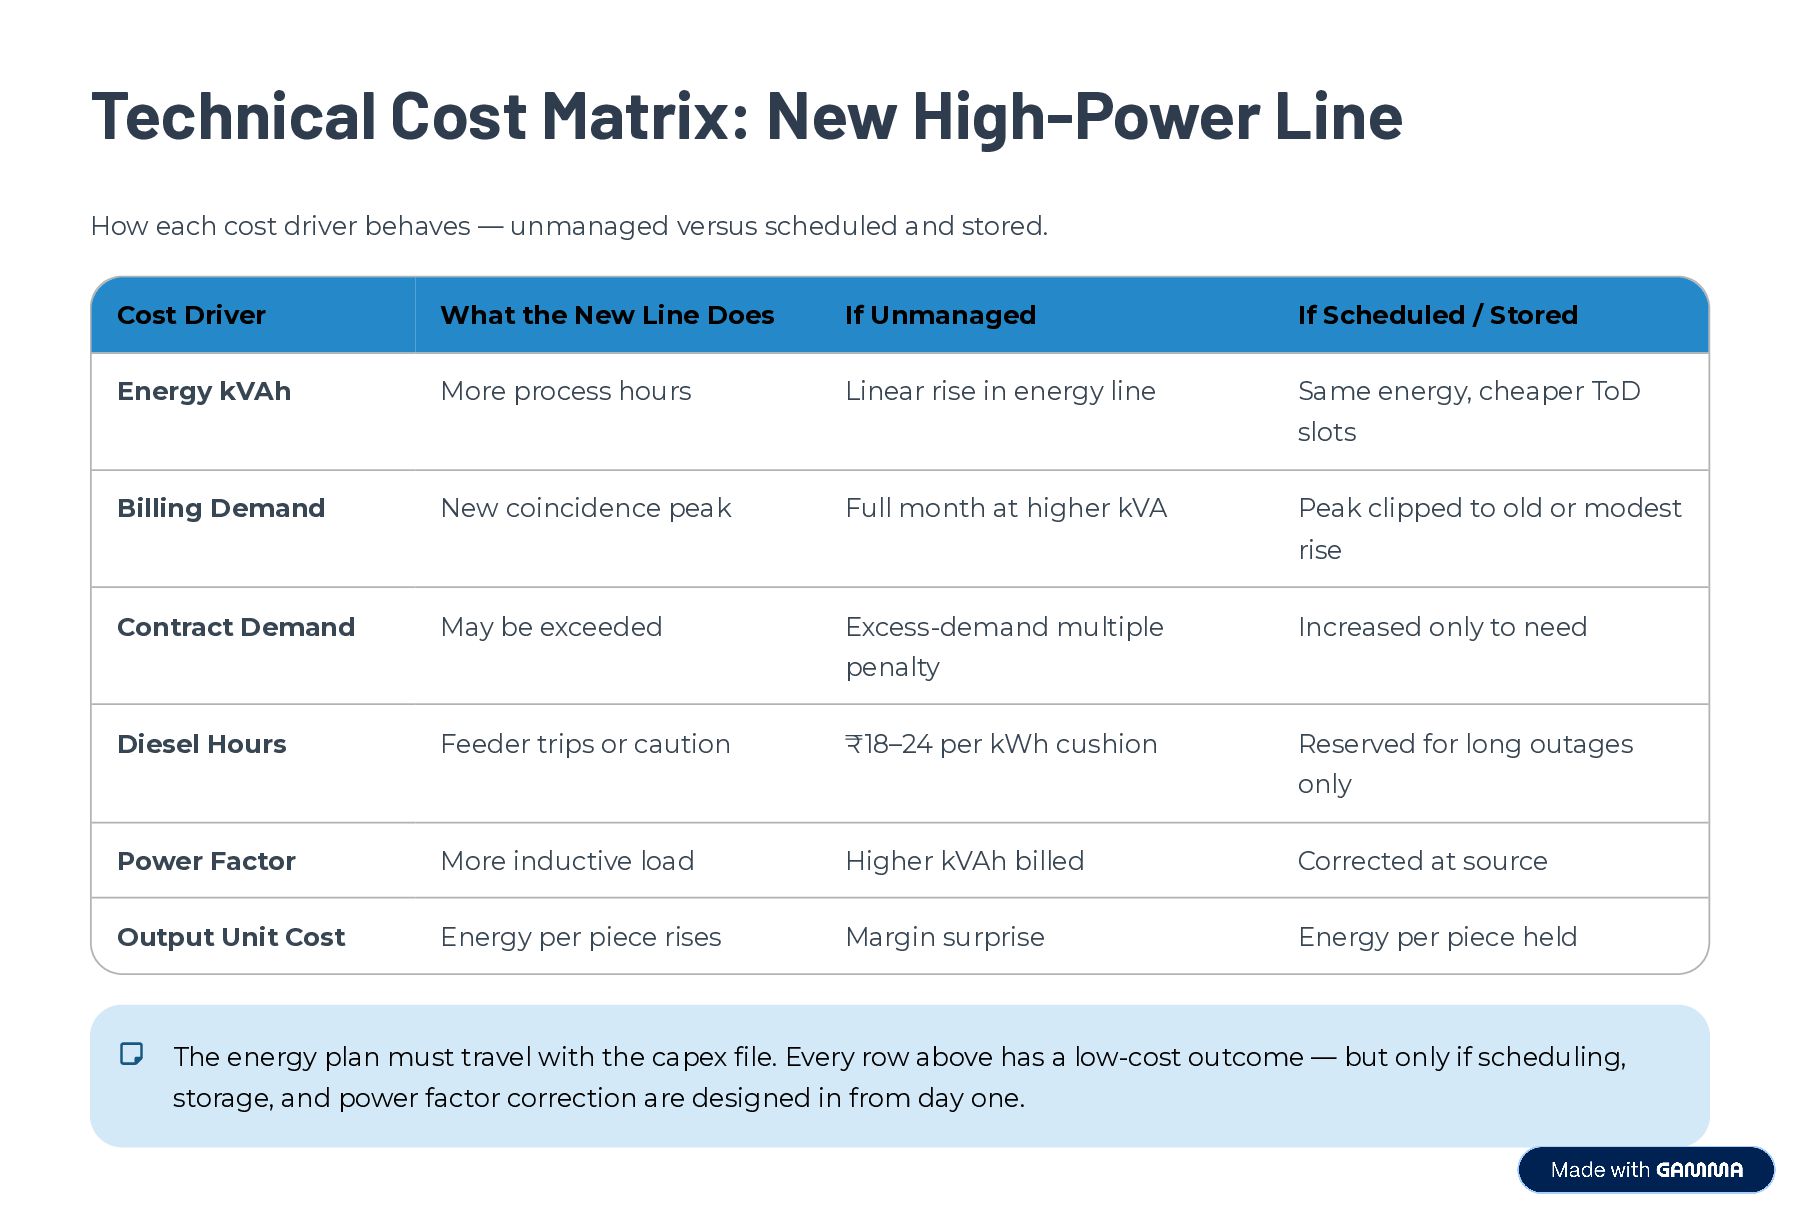
  10. Technical Cost Matrix: New High-Power Line How each cost driver

    behaves — unmanaged versus scheduled and stored. Cost Driver What the New Line Does If Unmanaged If Scheduled / Stored Energy kVAh More process hours Linear rise in energy line Same energy, cheaper ToD slots Billing Demand New coincidence peak Full month at higher kVA Peak clipped to old or modest rise Contract Demand May be exceeded Excess-demand multiple Increased only to need penalty Diesel Hours Feeder trips or caution ₹18–24 per kWh cushion Reserved for long outages only Power Factor More inductive load Higher kVAh billed Corrected at source Output Unit Cost Energy per piece rises Margin surprise Energy per piece held The energy plan must travel with the capex file. Every row above has a low-cost outcome — but only if scheduling, storage, and power factor correction are designed in from day one.