Upgrade to Pro — share decks privately, control downloads, hide ads and more …

Proposal Jam 2026 | VizChitra

Sponsored · Your Podcast. Everywhere. Effortlessly. Share. Educate. Inspire. Entertain. You do you. We'll handle the rest.
Avatar for VizChitra VizChitra
February 02, 2026

Proposal Jam 2026 | VizChitra

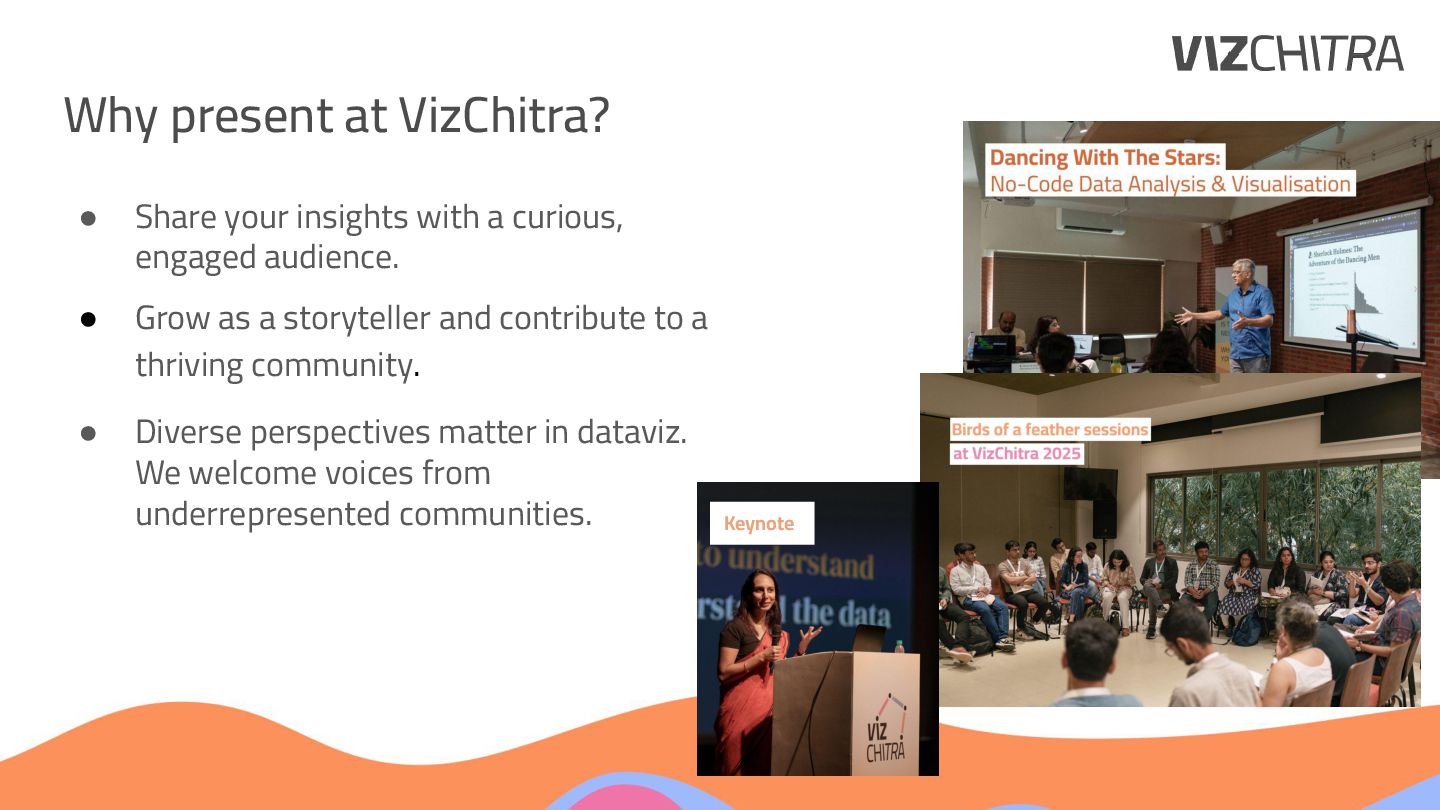
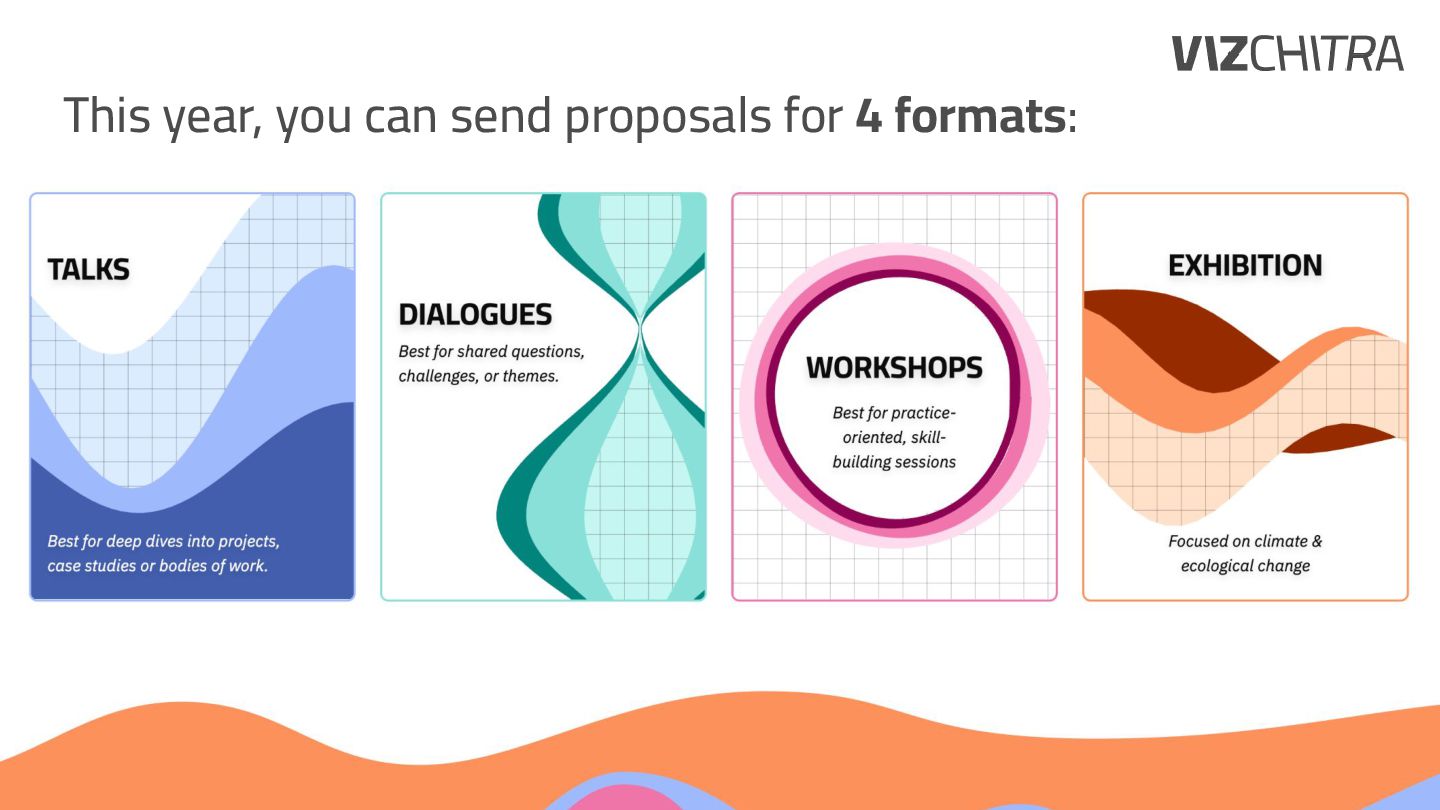
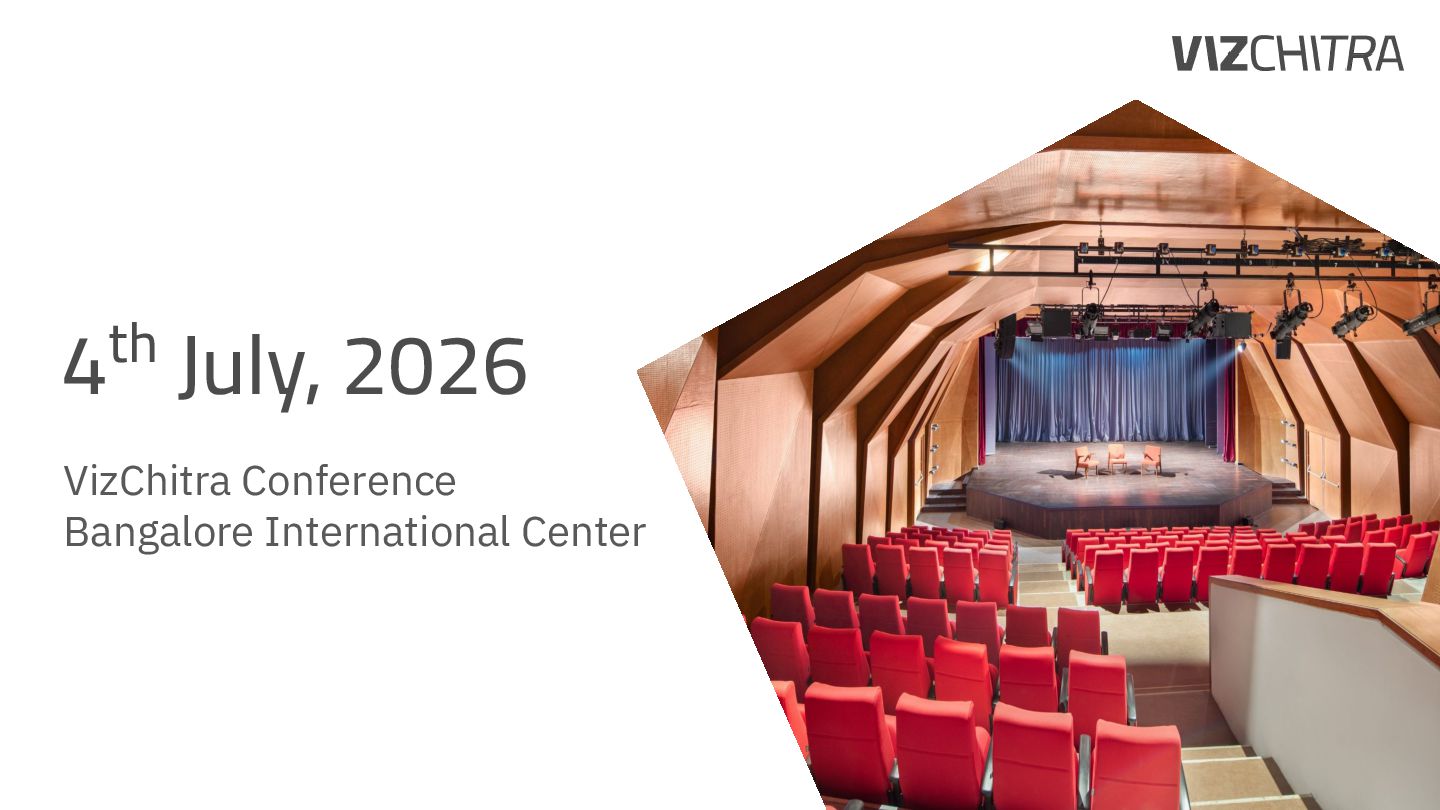
Our annual conference - VizChitra 2026 is set to take place on July 03–04, 2026 in Bangalore . The Call for Proposals and Call for Exhibition is open until February 15th, 2026. We’re looking for talks, workshops, dialogues (facilitated discussions) & exhibition (data art installations) proposals. To help everyone craft a strong proposal and make a submission, or address any queries around submissions, we hosted a Proposal Jam on 31st Jan. You can watch the video on Youtube

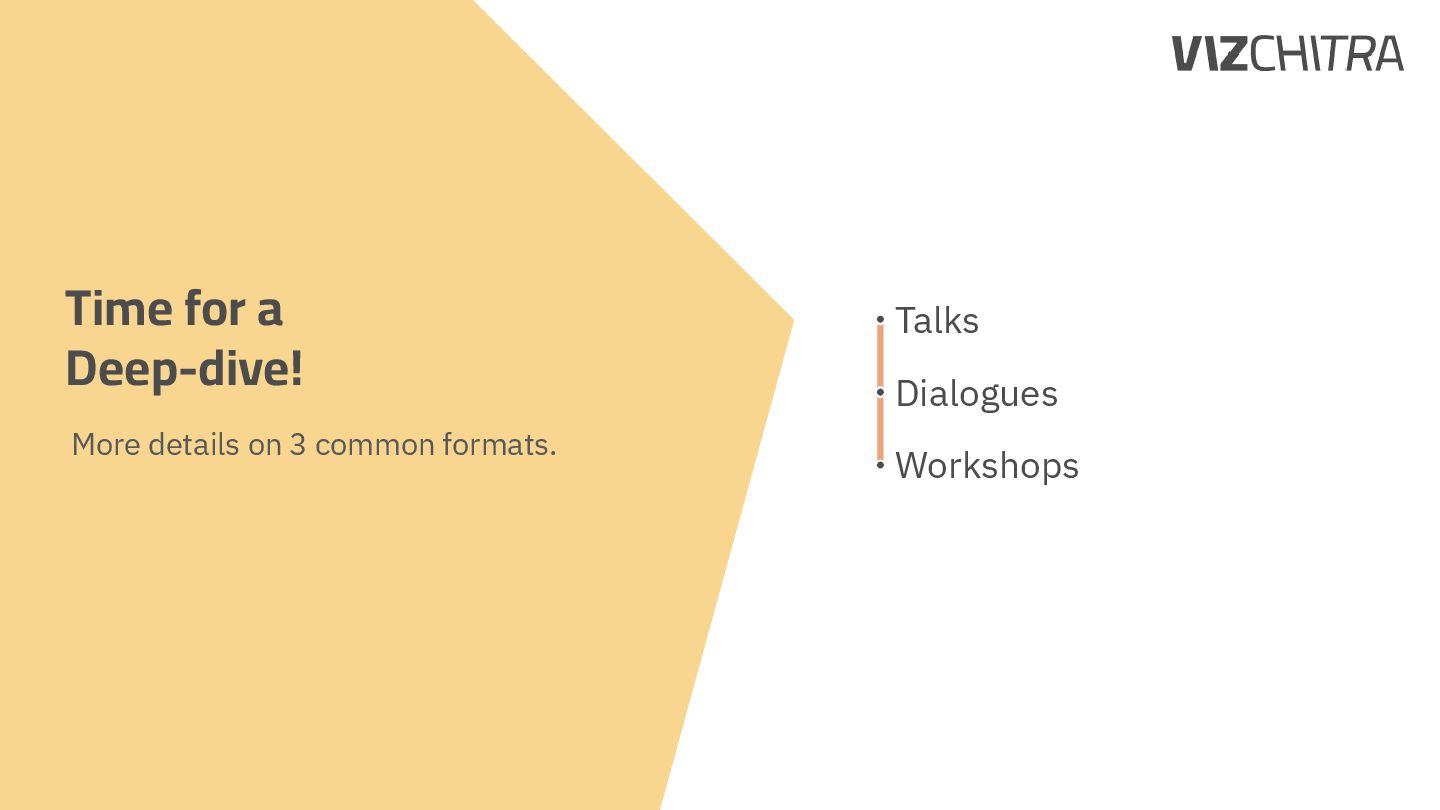
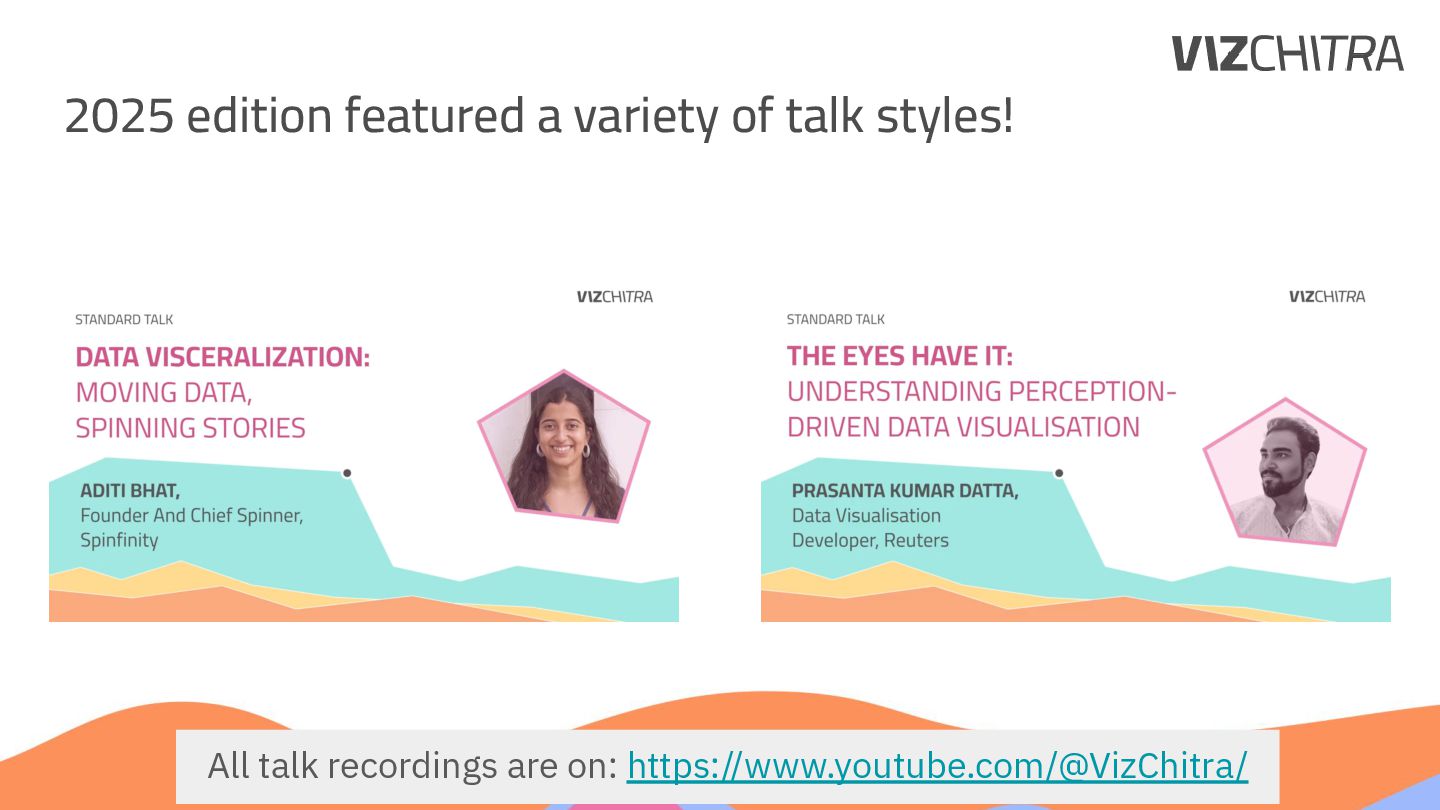
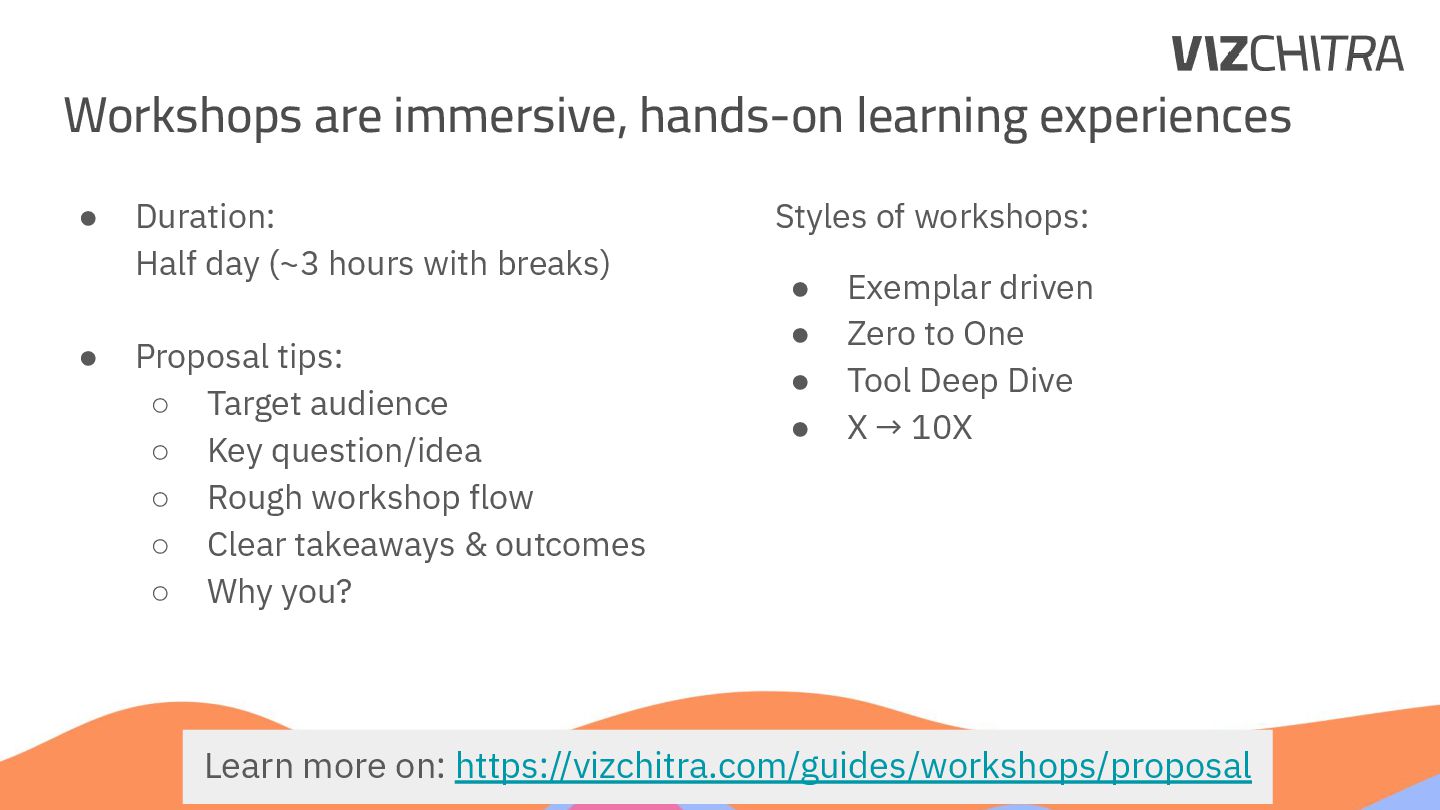
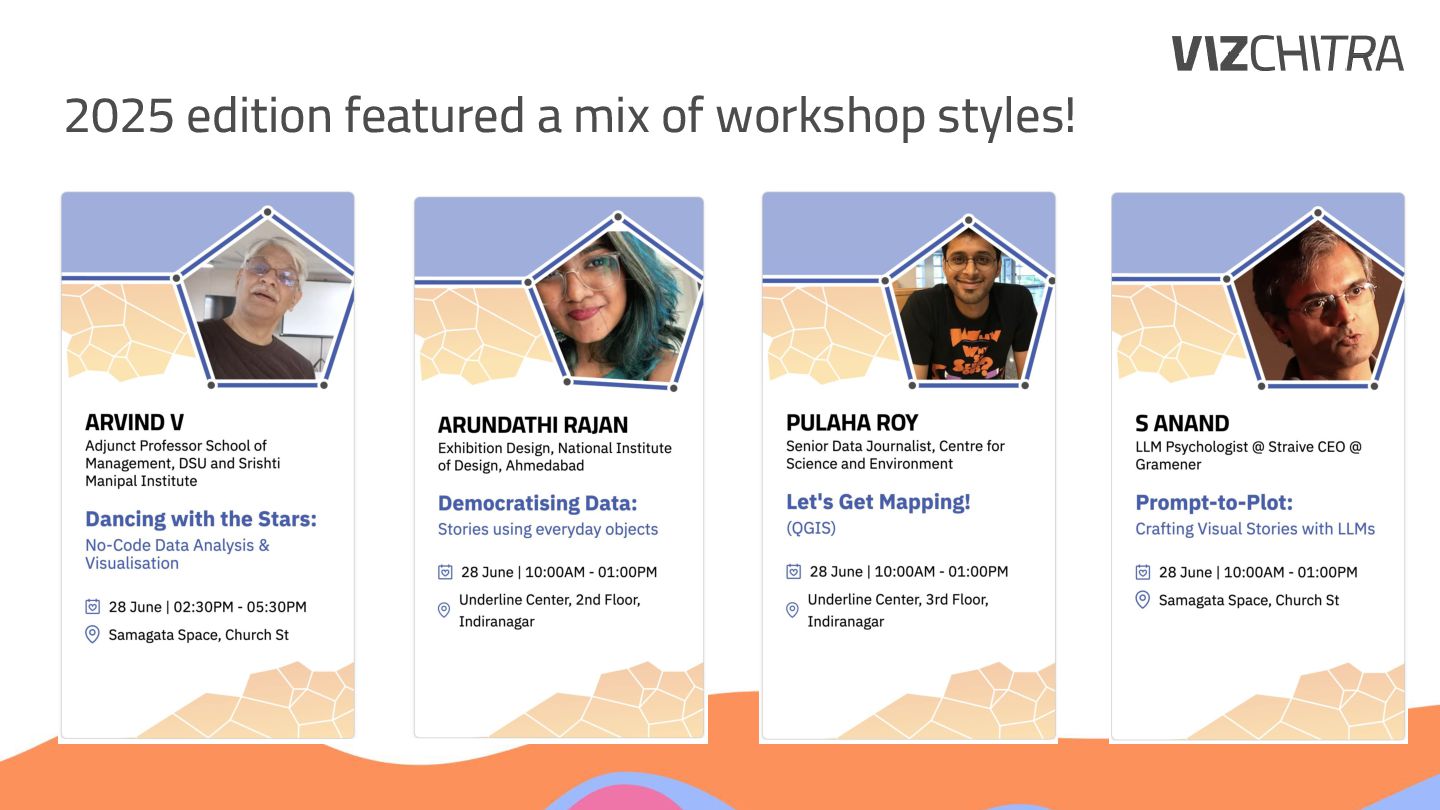
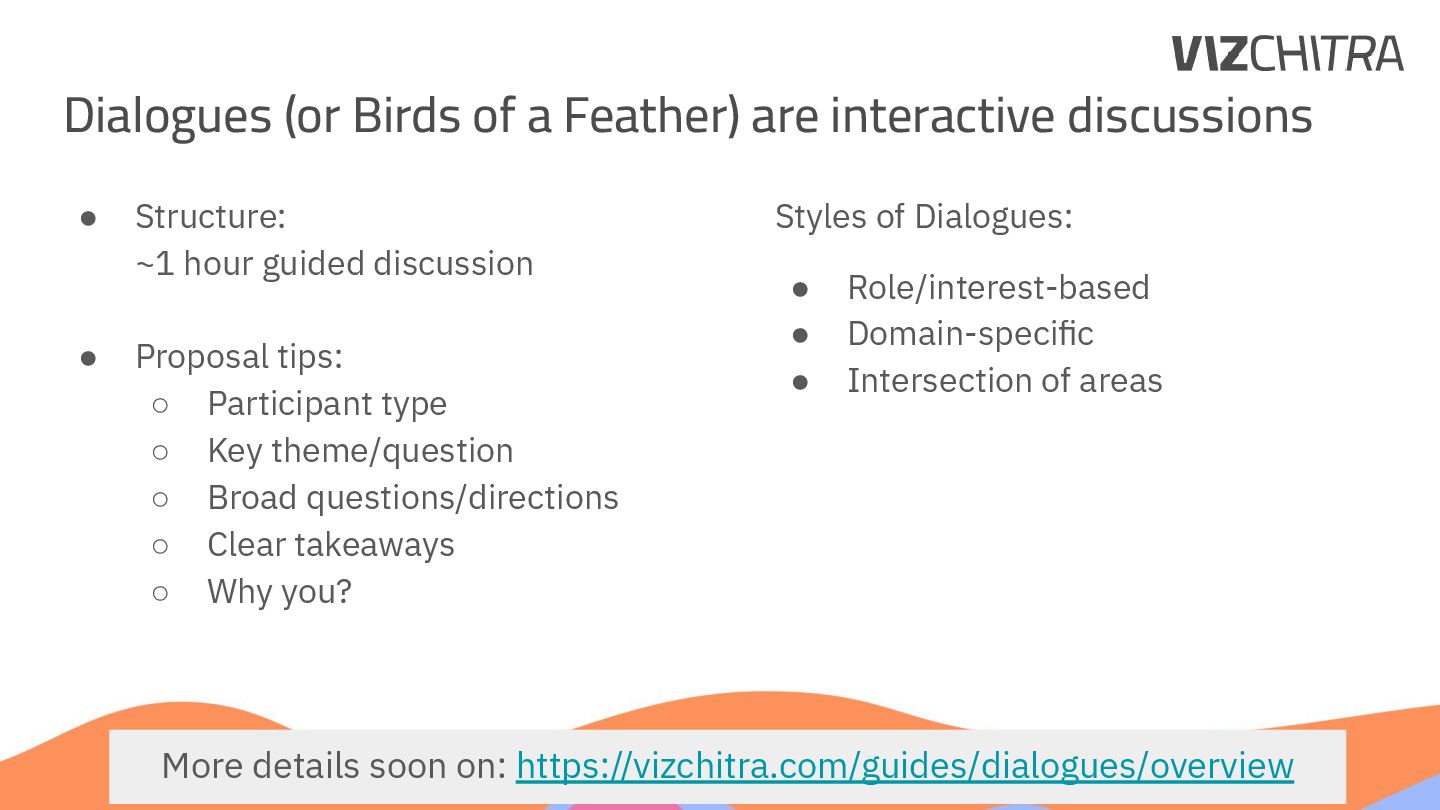
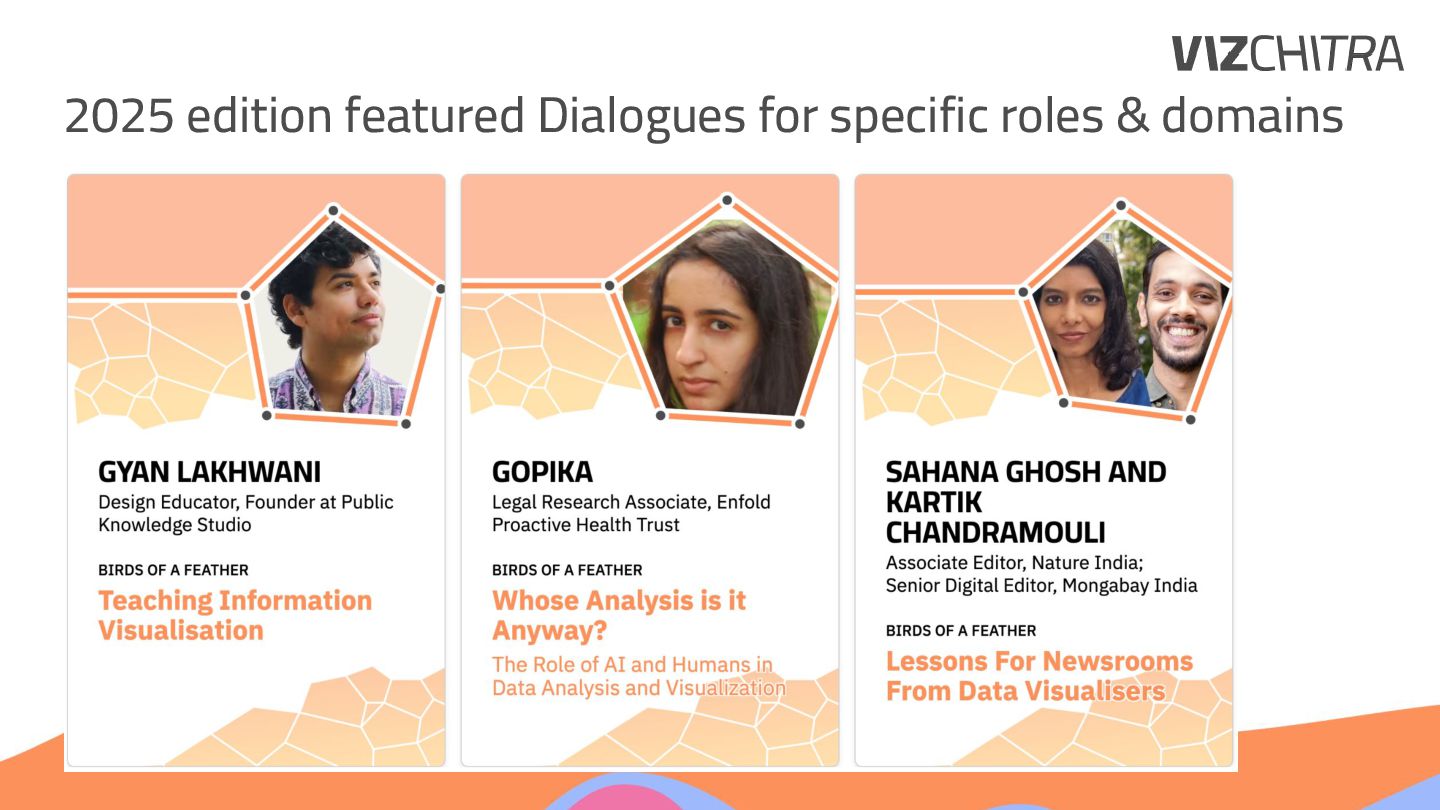
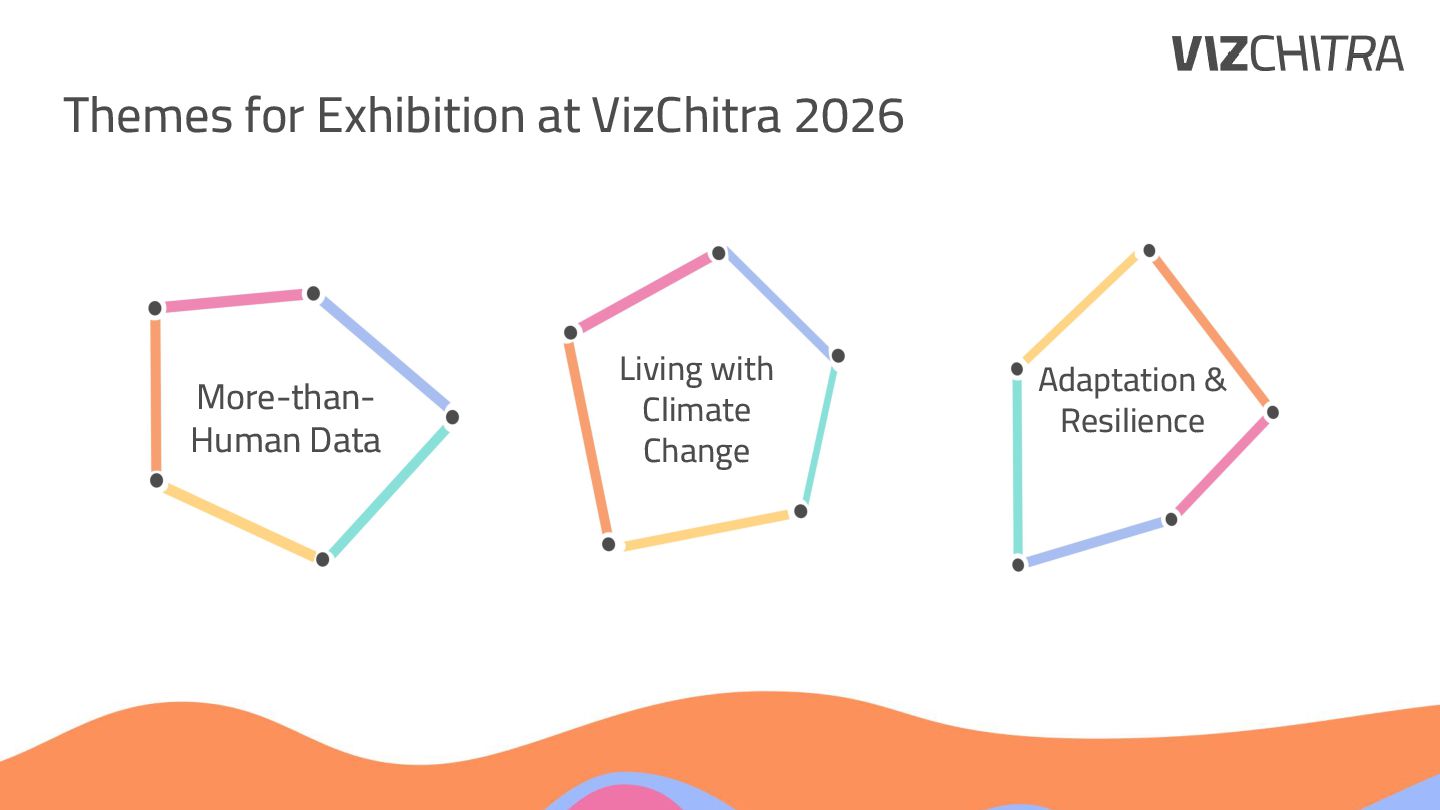
– Explain different formats at VizChitra 2026
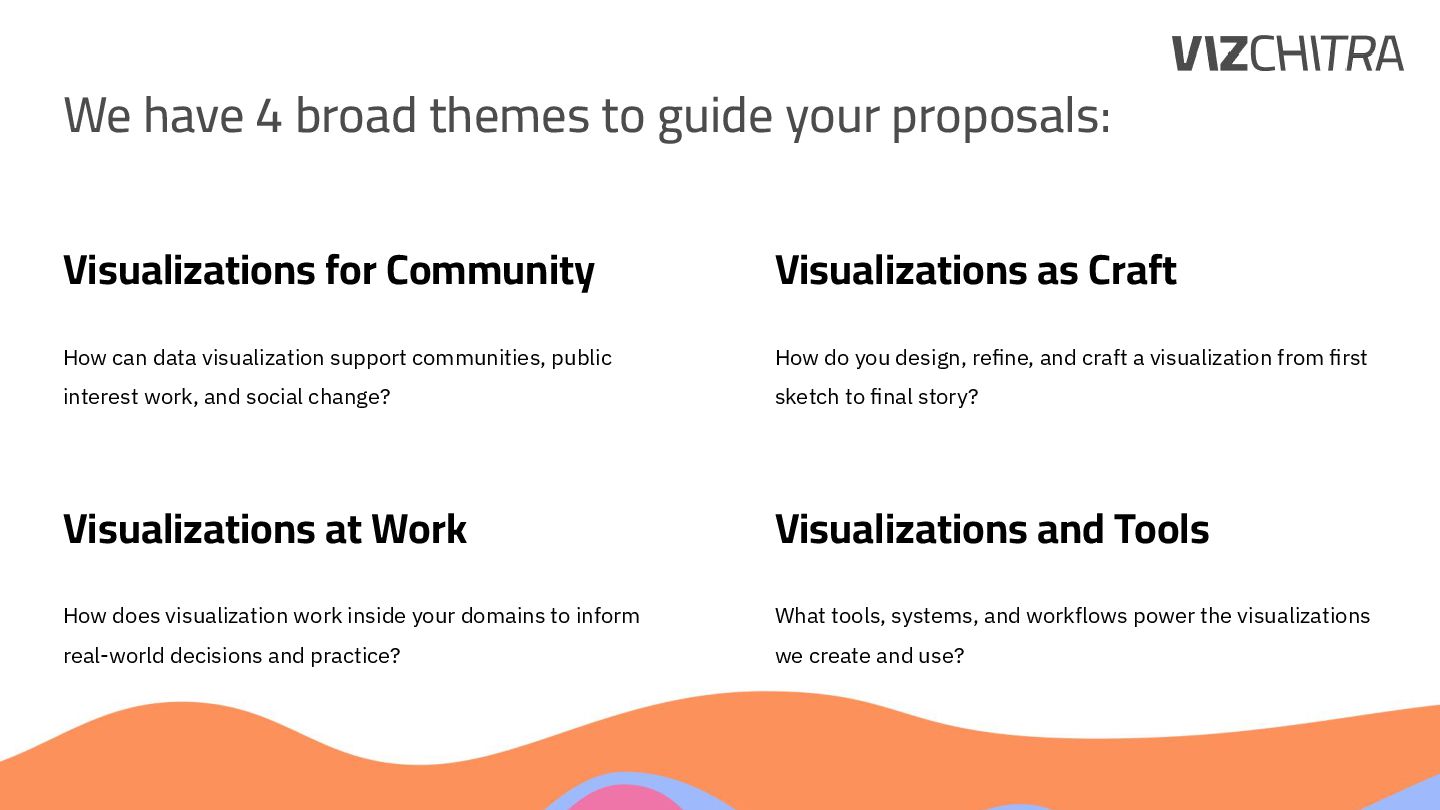
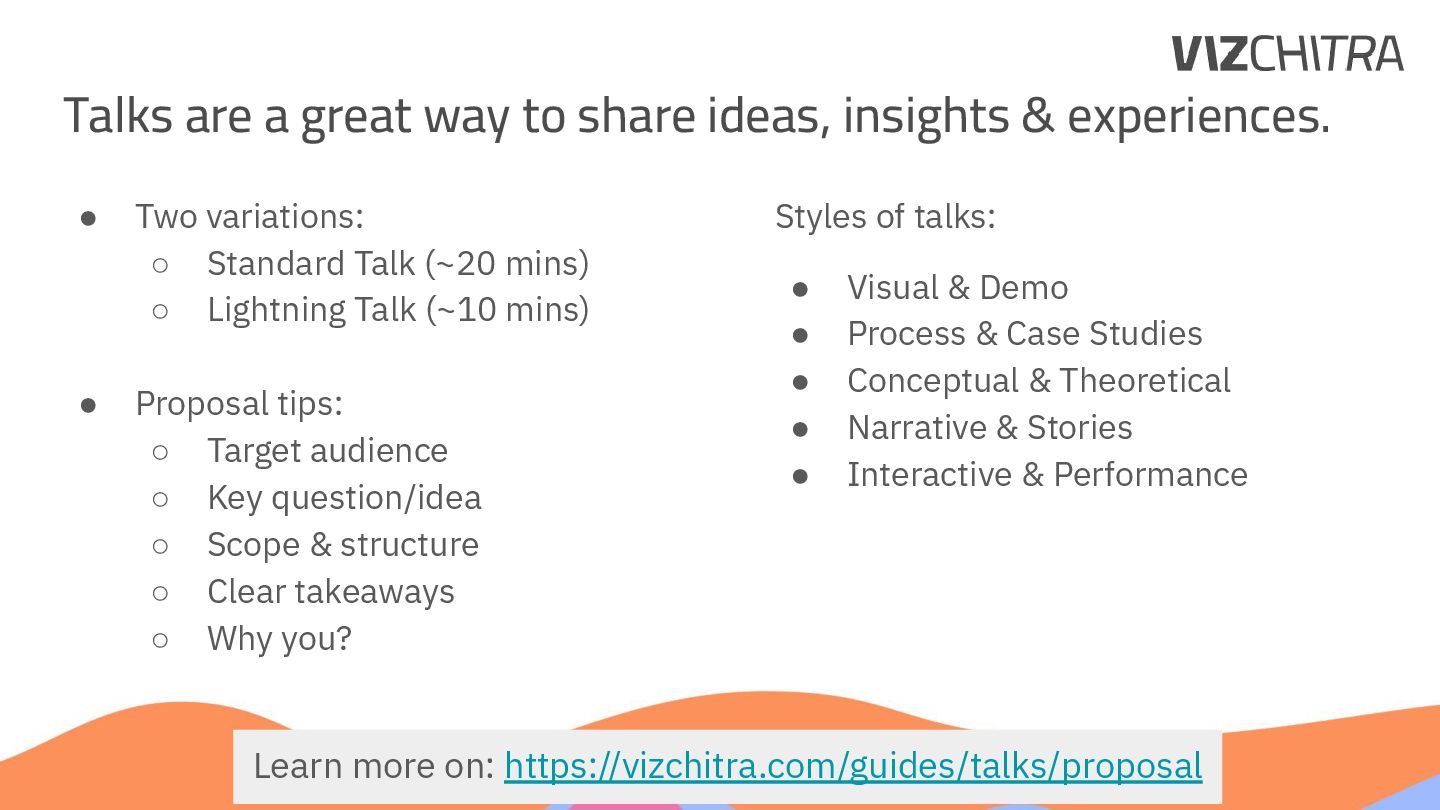
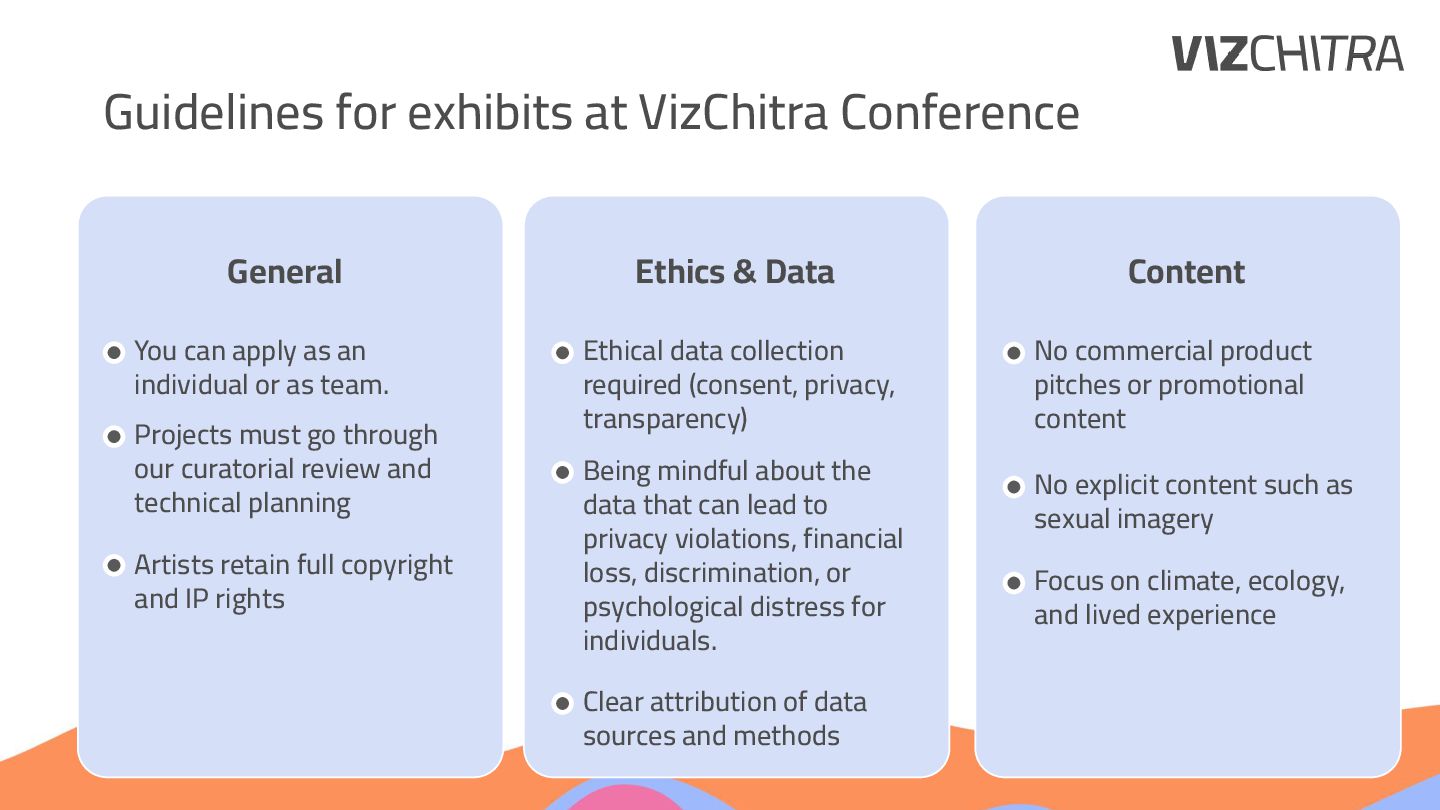
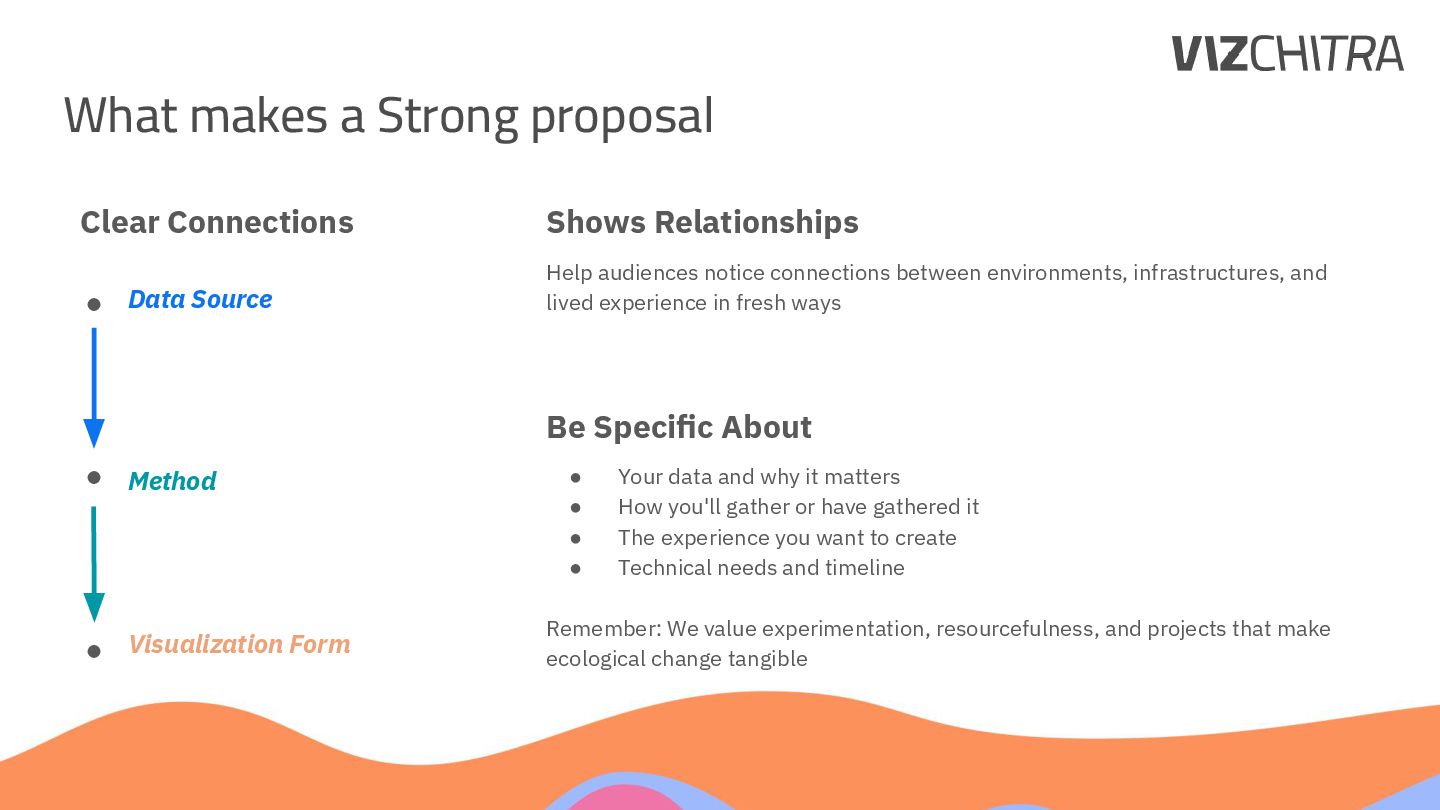
​– Highlight what we look for in proposals
– Jam together to help brainstorm on their pitch
– Share feedback on your ideas (during & after!)

Avatar for VizChitra

VizChitra

February 02, 2026
Tweet

More Decks by VizChitra

Other Decks in Education

Transcript

  1. What are we covering today? • What is VizChitra?
 •

    Why present at VizChitra?
 • What are the themes & formats this year?
 • How to make a proposal stand out?
 • Q&A time!
 • Jam Time! A 20-minute activity

  2. What is VizChitra? “A strong community of interdisciplinary individuals with

    a shared interest in the practice of data visualisation across India.” 

  3. Why present at VizChitra? • Share your insights with a

    curious, engaged audience. • Grow as a storyteller and contribute to a thriving community. • Diverse perspectives matter in dataviz. We welcome voices from underrepresented communities. 
 Keynote
  4. We have 4 broad themes to guide your proposals: Visualizations

    for Community How can data visualization support communities, public interest work, and social change?
 Visualizations as Craft How do you design, refine, and craft a visualization from first sketch to final story?
 Visualizations at Work How does visualization work inside your domains to inform real-world decisions and practice? Visualizations and Tools What tools, systems, and workflows power the visualizations we create and use?
  5. Talks are a great way to share ideas, insights &

    experiences. • Two variations:
 ◦ Standard Talk (~20 mins)
 ◦ Lightning Talk (~10 mins)
 
 • Proposal tips:
 ◦ Target audience
 ◦ Key question/idea
 ◦ Scope & structure
 ◦ Clear takeaways
 ◦ Why you?
 Styles of talks:
 • Visual & Demo
 • Process & Case Studies
 • Conceptual & Theoretical
 • Narrative & Stories
 • Interactive & Performance
 Learn more on: https://vizchitra.com/guides/talks/proposal 

  6. 2025 edition featured a variety of talk styles! All talk

    recordings are on: https://www.youtube.com/@VizChitra/

  7. Styles of workshops:
 • Exemplar driven
 • Zero to One


    • Tool Deep Dive
 • X → 10X
 Workshops are immersive, hands-on learning experiences • Duration:
 Half day (~3 hours with breaks)
 
 • Proposal tips:
 ◦ Target audience
 ◦ Key question/idea
 ◦ Rough workshop flow
 ◦ Clear takeaways & outcomes
 ◦ Why you?
 Learn more on: https://vizchitra.com/guides/workshops/proposal 

  8. Dialogues (or Birds of a Feather) are interactive discussions •

    Structure:
 ~1 hour guided discussion
 
 • Proposal tips:
 ◦ Participant type
 ◦ Key theme/question
 ◦ Broad questions/directions
 ◦ Clear takeaways
 ◦ Why you?
 Styles of Dialogues:
 • Role/interest-based
 • Domain-specific
 • Intersection of areas
 More details soon on: https://vizchitra.com/guides/dialogues/overview 

  9. Themes for Exhibition at VizChitra 2026 More-than- Human Data Living

    with Climate Change Adaptation & Resilience
  10. Guidelines for exhibits at VizChitra Conference 
 Ethics & Data

    Ethical data collection required (consent, privacy, transparency) Being mindful about the data that can lead to privacy violations, financial loss, discrimination, or psychological distress for individuals. Clear attribution of data sources and methods General You can apply as an individual or as team. Projects must go through our curatorial review and technical planning Artists retain full copyright and IP rights Content No commercial product pitches or promotional content No explicit content such as sexual imagery Focus on climate, ecology, and lived experience
  11. What counts as Data? Archives
 Photos, documents, maps, historical records


    Voices
 Interviews, WhatsApp responses, conversations, oral histories
 
Observations
 Field notes, drawings, observation diaries
 Sensors
 Environmental readings, DIY tech, simple monitoring devices
 
 Sounds
 Audio recordings, ambient noise, soundscapes
 Public Sources
 Scraped data, open datasets, government records
 

  12. Interactive Station
 Audience participation. Touch, play, manipulate data.
 
 Projection/Screen-Based


    Moving images. Data unfolding over time.
 What are possible medium of representation? Sculptural/Object-Based
 Data in the material form
 Print Series/Posters
 Sequential viewing. Data across surfaces.
 Participatory Work
 Co-created with the audience. 
 Data drives the audience in activity.
 Sensory Experience
 Seeing, hearing, touching, feel data. engage smell, temperature, texture, light.
 

  13. What makes a Strong proposal Be Specific About
 • Your

    data and why it matters
 • How you'll gather or have gathered it
 • The experience you want to create
 • Technical needs and timeline
 
 Remember: We value experimentation, resourcefulness, and projects that make ecological change tangible
 
 Shows Relationships
 Help audiences notice connections between environments, infrastructures, and lived experience in fresh ways
 
 Data Source
 Method
 Visualization Form
 Clear Connections

  14. We’re excited to see how you represent data in a

    novel form! https://temperaturetextiles.nl/ 
 https://ieeevis.org/year/2024/program/paper_w-future-1007.html 

  15. Q/A