Upgrade to Pro — share decks privately, control downloads, hide ads and more …

HolyJS Moscow 2018: An Introduction to Distributed Tracing

HolyJS Moscow 2018: An Introduction to Distributed Tracing

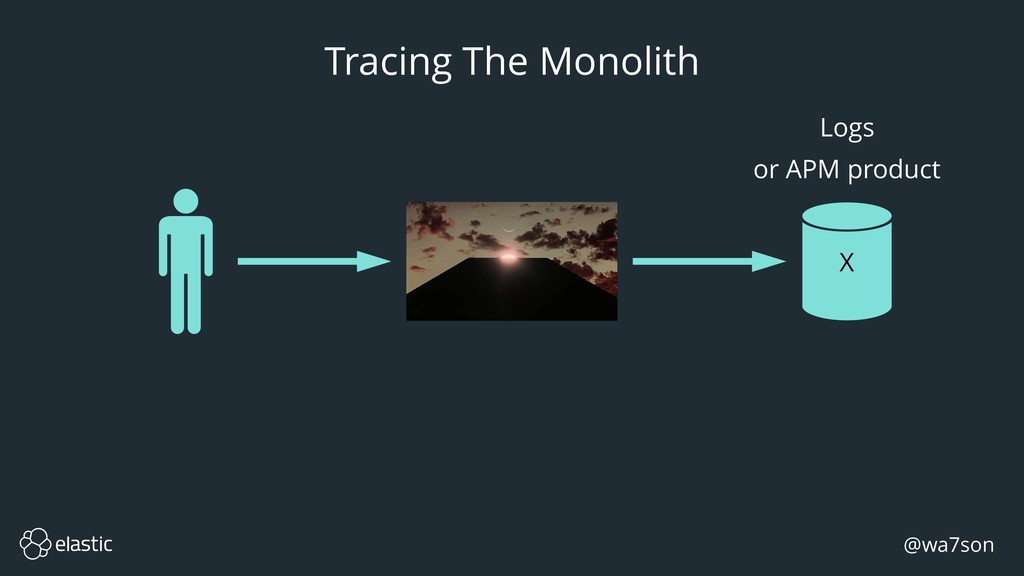
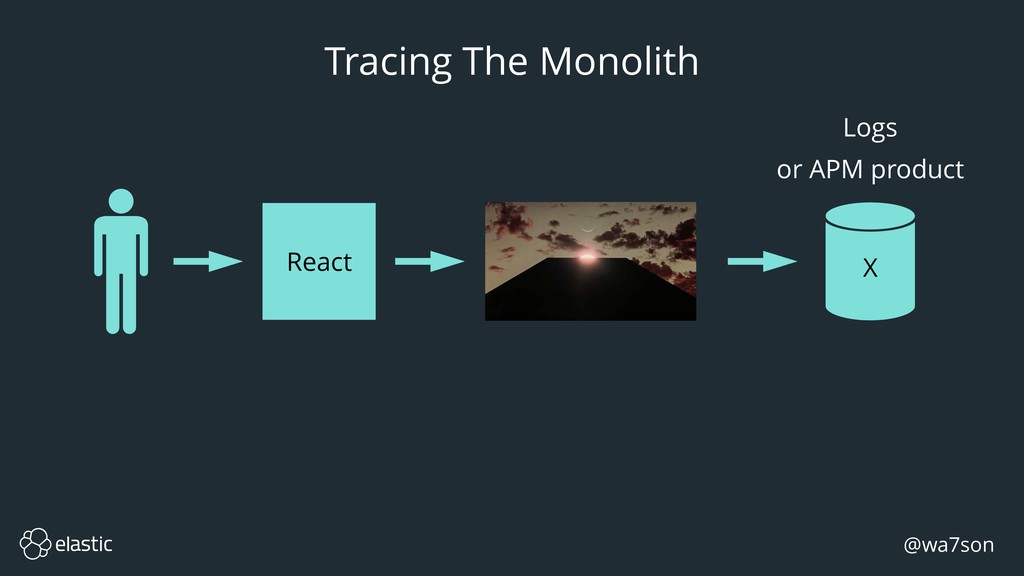
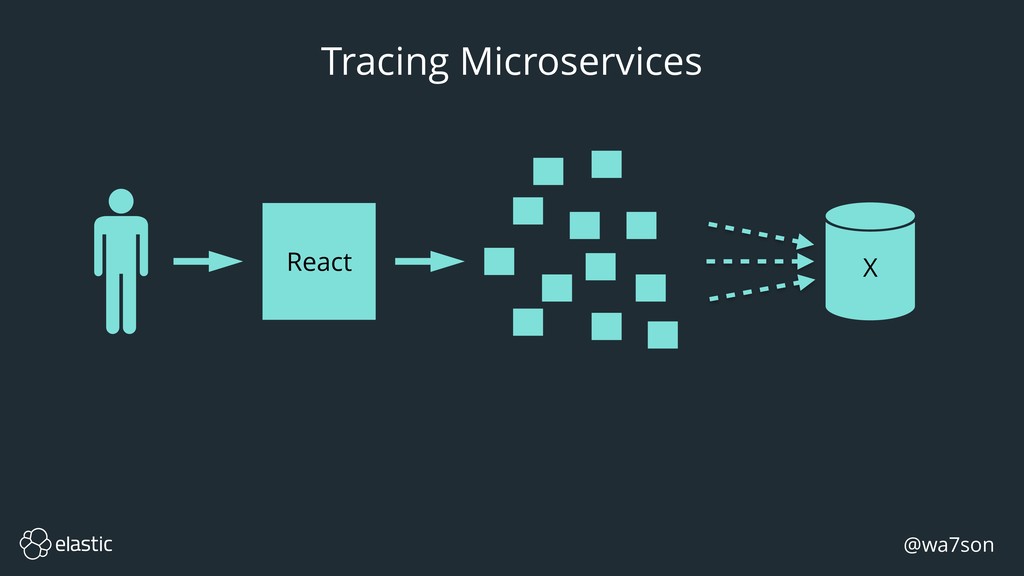
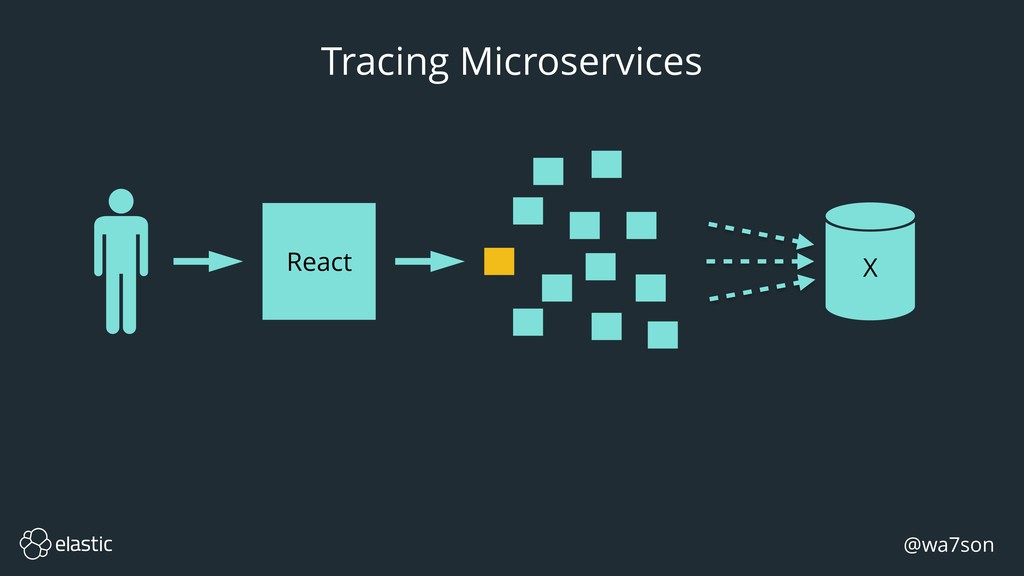
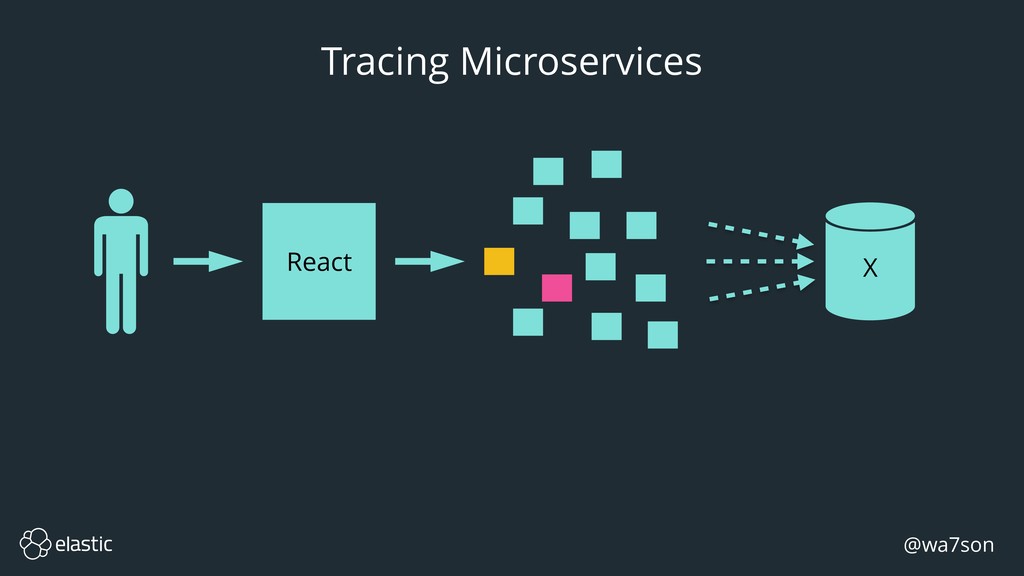
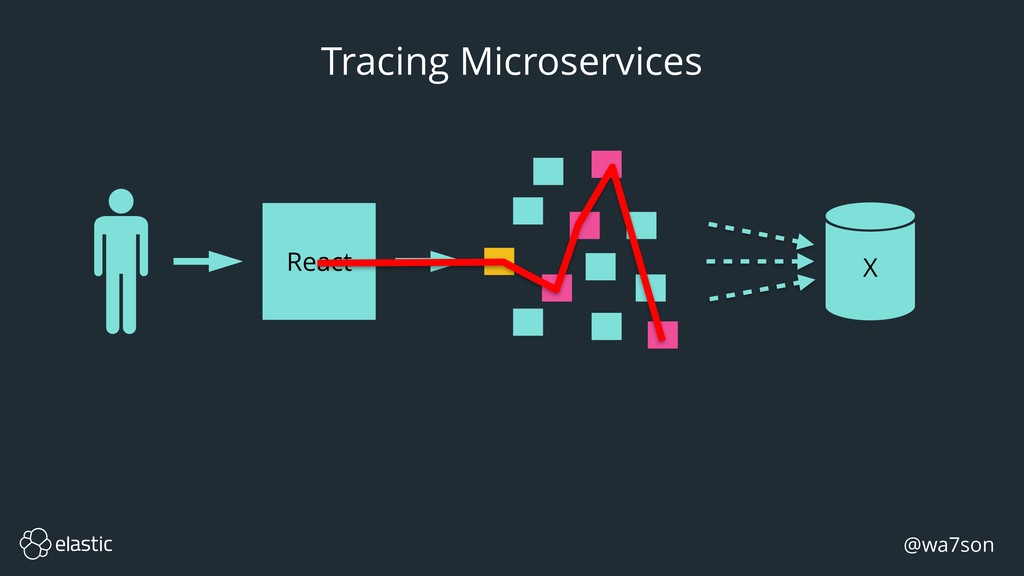
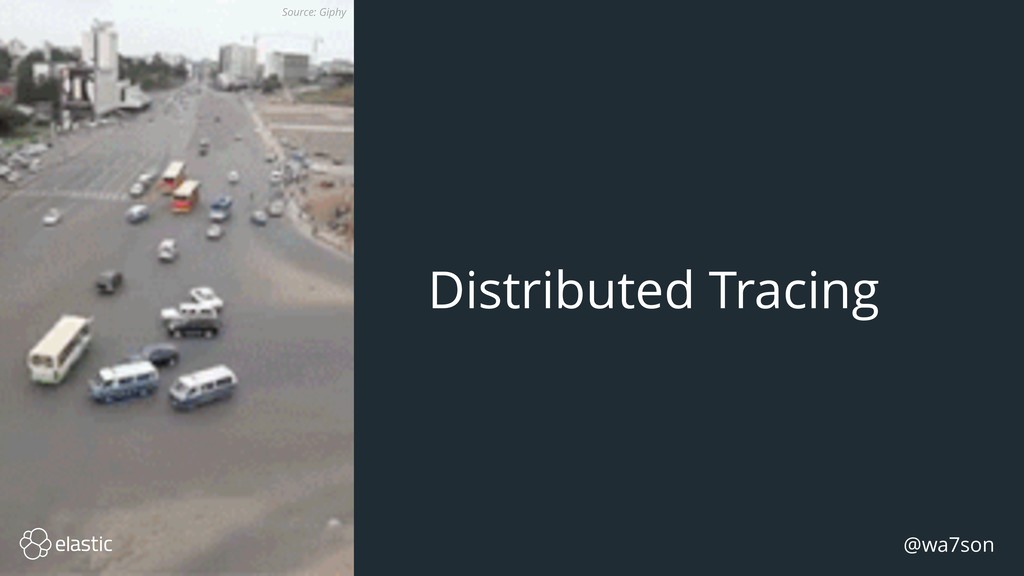
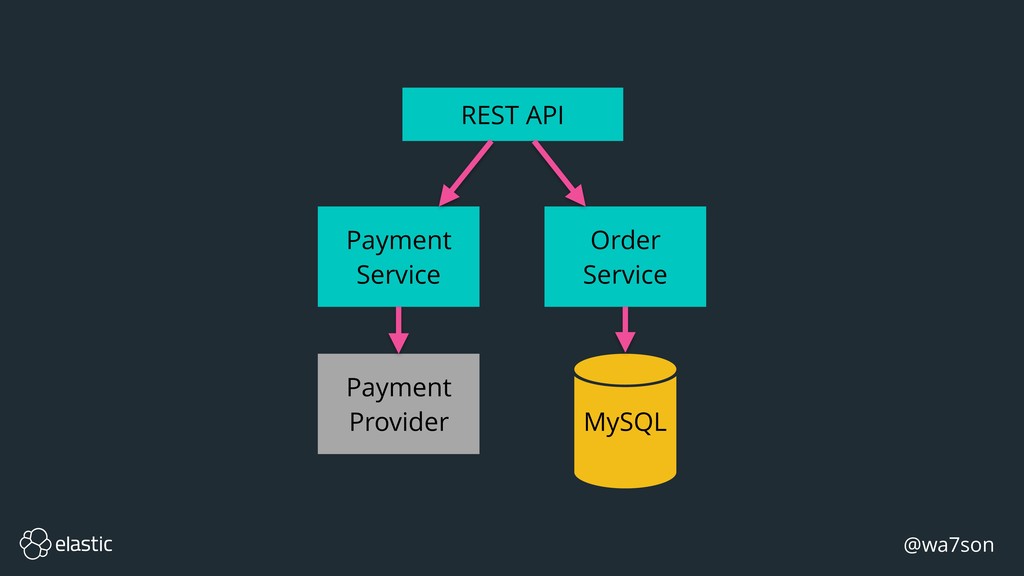
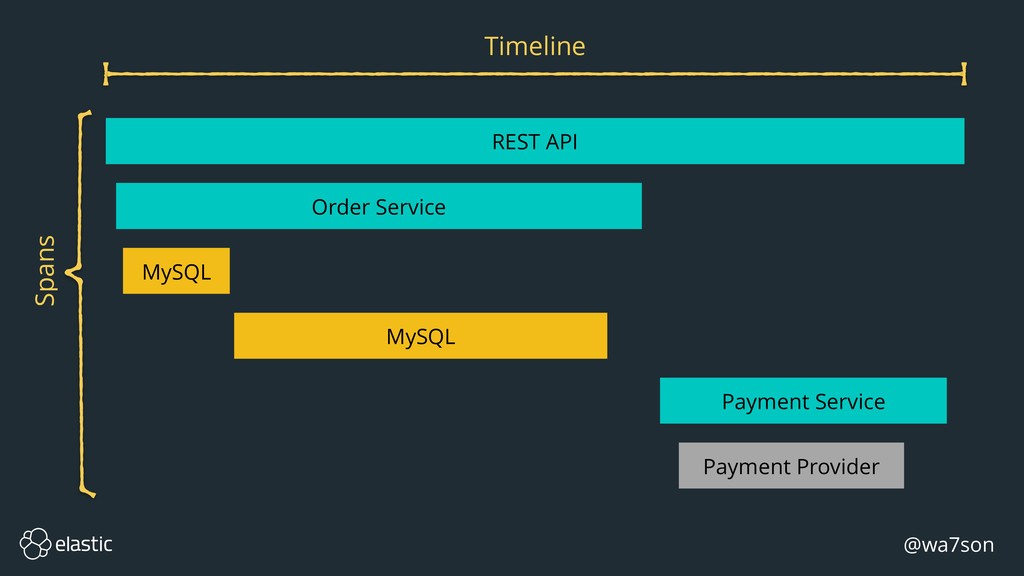
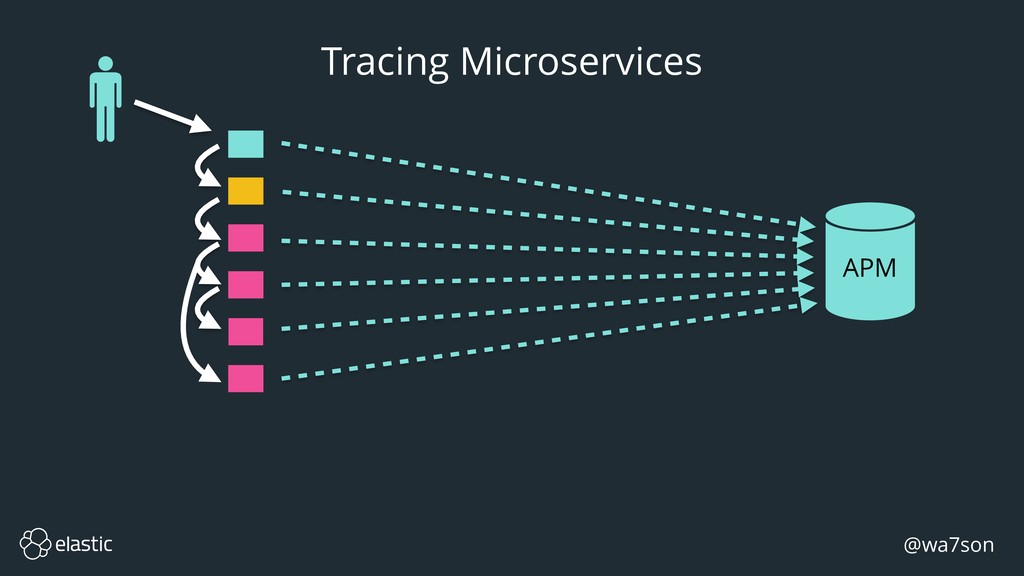
With the rise of single-page web apps and micro service architectures, web applications are becoming increasingly complex. The old tools with which we used to monitor the performance of monolith applications are no longer sufficient. To better understand how data is flowing between the different components of your application and to detect the bottlenecks before it’s too late, you need a new set of tools to monitor the whole stack - enter Distributed Tracing.

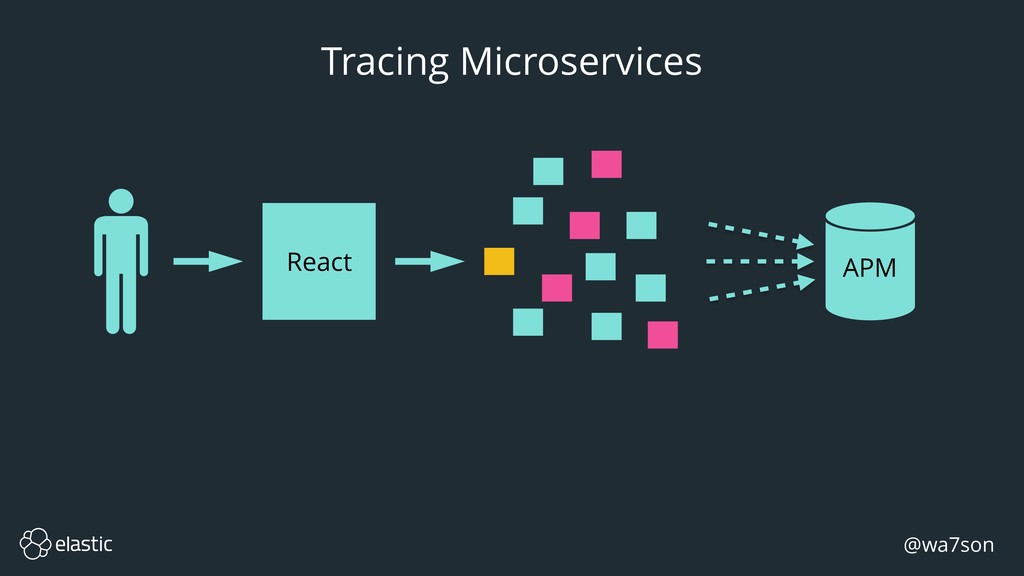
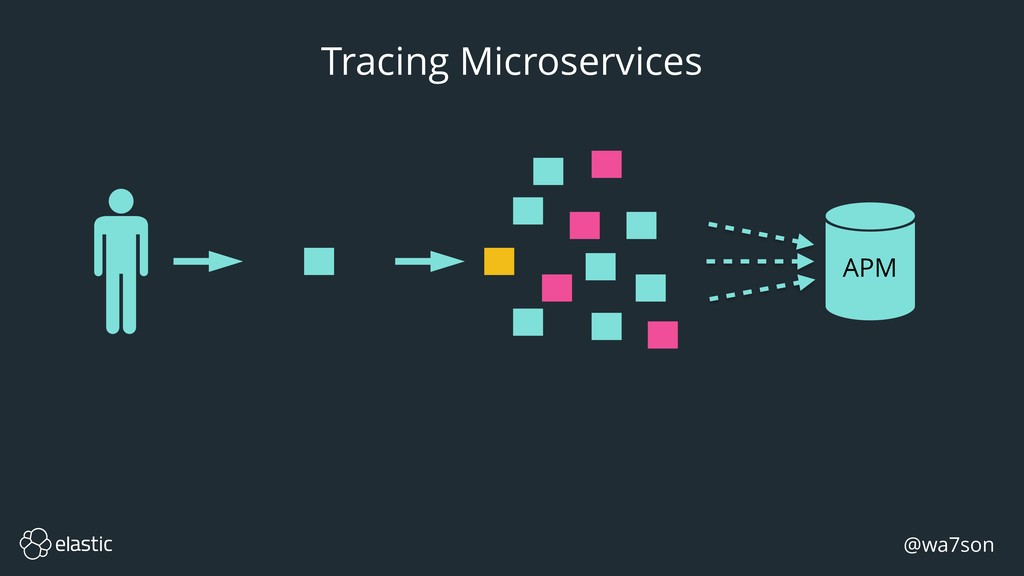
This talk will focus on what Distributed Tracing is, how to roll it out across your infrastructure, and how to use it to gain better insights and fix problems.

This talk aims to give the listener a better understanding of Distributed Tracing and why it’s important. It will focus on the OpenTracing standard developed to make your monitoring solution vendor-neutral, and will use examples from Elastic APM - the newest open source project coming to the Elastic Stack.

Thomas Watson

November 24, 2018
Tweet

More Decks by Thomas Watson

Other Decks in Programming

Transcript

  1. @wa7son Who am I? • Thomas Watson • Open Source

    developer at
 github.com/watson • Principal Software Engineer at Elastic • Elastic APM – Node.js agent • Node.js Core Member • Tweets as @wa7son
  2. @wa7son Tracing glossary “In software engineering, tracing involves a specialized

    use of logging to record information about a program's execution. This information is typically used by programmers for debugging purposes […]” Source: Wikipedia
  3. @wa7son Date: Mon, 29 Oct 2018 16:11:05 GMT Connection: keep-alive

    Content-Length: 0 GET /products HTTP/1.1 Host: www.example.com <magic header>
  4. @wa7son Date: Mon, 29 Oct 2018 16:11:05 GMT Connection: keep-alive

    Content-Length: 0 GET /products HTTP/1.1 Host: www.example.com <magic header>
  5. @wa7son GET /products HTTP/1.1 Host: www.example.com : - - -

    Date: Mon, 29 Oct 2018 16:11:05 GMT Connection: keep-alive Content-Length: 0 00 82c5500f40667e5500e9ae8e9711553c 992631f881f78c3b 01 traceparent
  6. @wa7son GET /products HTTP/1.1 Host: www.example.com : - - -

    Date: Mon, 29 Oct 2018 16:11:05 GMT Connection: keep-alive Content-Length: 0 00 82c5500f40667e5500e9ae8e9711553c 992631f881f78c3b 01 traceparent GET /products HTTP/1.1 Host: www.example.com traceparent: 00-82c5500f40667e5500e9ae8e9711553c-992631f881f78c3b-01 Date: Mon, 29 Oct 2018 16:11:05 GMT Connection: keep-alive Content-Length: 0 Trace Context Working Group DRAFT
  7. @wa7son GET /products HTTP/1.1 Host: www.example.com : - - -

    Date: Mon, 29 Oct 2018 16:11:05 GMT Connection: keep-alive Content-Length: 0 00 82c5500f40667e5500e9ae8e9711553c 992631f881f78c3b 01 traceparent
  8. @wa7son 00 82c5500f40667e5500e9ae8e9711553c 992631f881f78c3b 01 Version Trace ID 1 byte

    8 bits 128 bit random number 64 bit random number Parent Span ID Trace Flags traceparent
  9. @wa7son 00 82c5500f40667e5500e9ae8e9711553c 992631f881f78c3b 01 Version Trace ID Parent Span

    ID Trace Flags 1 byte 8 bits 128 bit random number 64 bit random number DRAFT Trace Flags Recorded — 0b00000001 traceparent
  10. @wa7son GET /products HTTP/1.1 Host: www.example.com traceparent: 00-82c5500f40667e5500e9ae8e9711553c-992631f881f78c3b-01 Date: Mon,

    29 Oct 2018 16:11:05 GMT Connection: keep-alive Content-Length: 0 : <vendorname1=opaqueValue1>,<vendorname2=opaqueValue2>,… tracestate DRAFT
  11. @wa7son Bootstrapping the Trace in Browsers Initial HTTP request HTML

    page with APM initialization 1. Generate trace id 2. Start server span 3. Generate span ID for initial HTTP request on behalf of the browser 4. Render HTML template 5. Respond to request + End server span Browser Server
  12. @wa7son const Html = ({ body, transaction }) => `

    <!DOCTYPE html> <html> <head> </head> <body> <script src="/path/to/elastic-apm-js-base.umd.min.js"></script> <script> elasticApm.init({ pageLoadTraceId: '${transaction.traceId}', pageLoadSpanId: '${transaction.ensureParentId()}', pageLoadSampled: ${transaction.sampled} }) </script> <div>${body}</div> </body> </html> `
  13. @wa7son const Html = ({ body, transaction }) => `

    <!DOCTYPE html> <html> <head> </head> <body> <script src="/path/to/elastic-apm-js-base.umd.min.js"></script> <script> elasticApm.init({ pageLoadTraceId: '${transaction.traceId}', pageLoadSpanId: '${transaction.ensureParentId()}', pageLoadSampled: ${transaction.sampled} }) </script> <div>${body}</div> </body> </html> `
  14. @wa7son const opentracing = require('opentracing') const tracer = new opentracing.Tracer()

    const span = tracer.startSpan('some work') // Do some work span.finish()
  15. @wa7son // Start a new (parentless) root Span: const parent

    = Tracer.startSpan('DoWork') // Start a new (child) Span: const child = Tracer.startSpan('load-from-db', { childOf: parent.context() }) // Start a new async (FollowsFrom) Span: const child = Tracer.startSpan('async-cache-write', { references: [ opentracing.followsFrom(parent.context()) ] })
  16. @wa7son const headersCarrier = {} // "Serialize" Span Context into

    headersCarrier tracer.inject( clientSpan.context(), Tracer.FORMAT_HTTP_HEADERS, headersCarrier ) // Add tracing headers to headers of outgoing request Object.assign(outboundHTTPReq.headers, headersCarrier)
  17. @wa7son // "De-serialize" Span Context from inbound HTTP request headers

    const headersCarrier = inboundHTTPReq.headers const wireCtx = tracer.extract( Tracer.FORMAT_HTTP_HEADERS, headersCarrier ) const serverSpan = tracer.startSpan('...', { childOf: wireCtx })
  18. @wa7son const { Tracer } = require('elastic-apm-node/opentracing') const tracer =

    new Tracer({ serviceName: 'my-awesome-service', serverUrl: 'https://example.com:8200' }) const opentracing = require('opentracing') opentracing.initGlobalTracer(tracer) // then later... const tracer = opentracing.globalTracer() !
  19. @wa7son const { Tracer } = require('my-custom-tracer') const tracer =

    new Tracer() const express = require('express') const expressOpenTracing = require('express-opentracing') const app = express() app.use(expressOpenTracing({ tracer })) // ...
  20. @wa7son Checklist • Does it support the languages we’re using

    (Node.js, Python, Java etc)? • Does it support “serverless” infrastructures (e.g. AWS Lambda)? • Does it support the databases we’re using? • Does it support the inner-service transports we’re using (HTTP, Kafka etc)? • Does it support Real User Monitoring (RUM) for the platforms we’re using (e.g. JavaScript, React Native)? • If the answer isn’t yes to all of the above, does it allow us to extend it easily? • Can we access the raw trace data? • Can we correlate the trace data with other data sources (logs, metrics etc)?
  21. @wa7son Recommendations •Don’t try to instrument everything in the beginning

    •Instrument important services first •Breaking up a monolith: •Add instrumentation to the monolith first if possible •Make instrumentation part of the process of breaking out new microservices