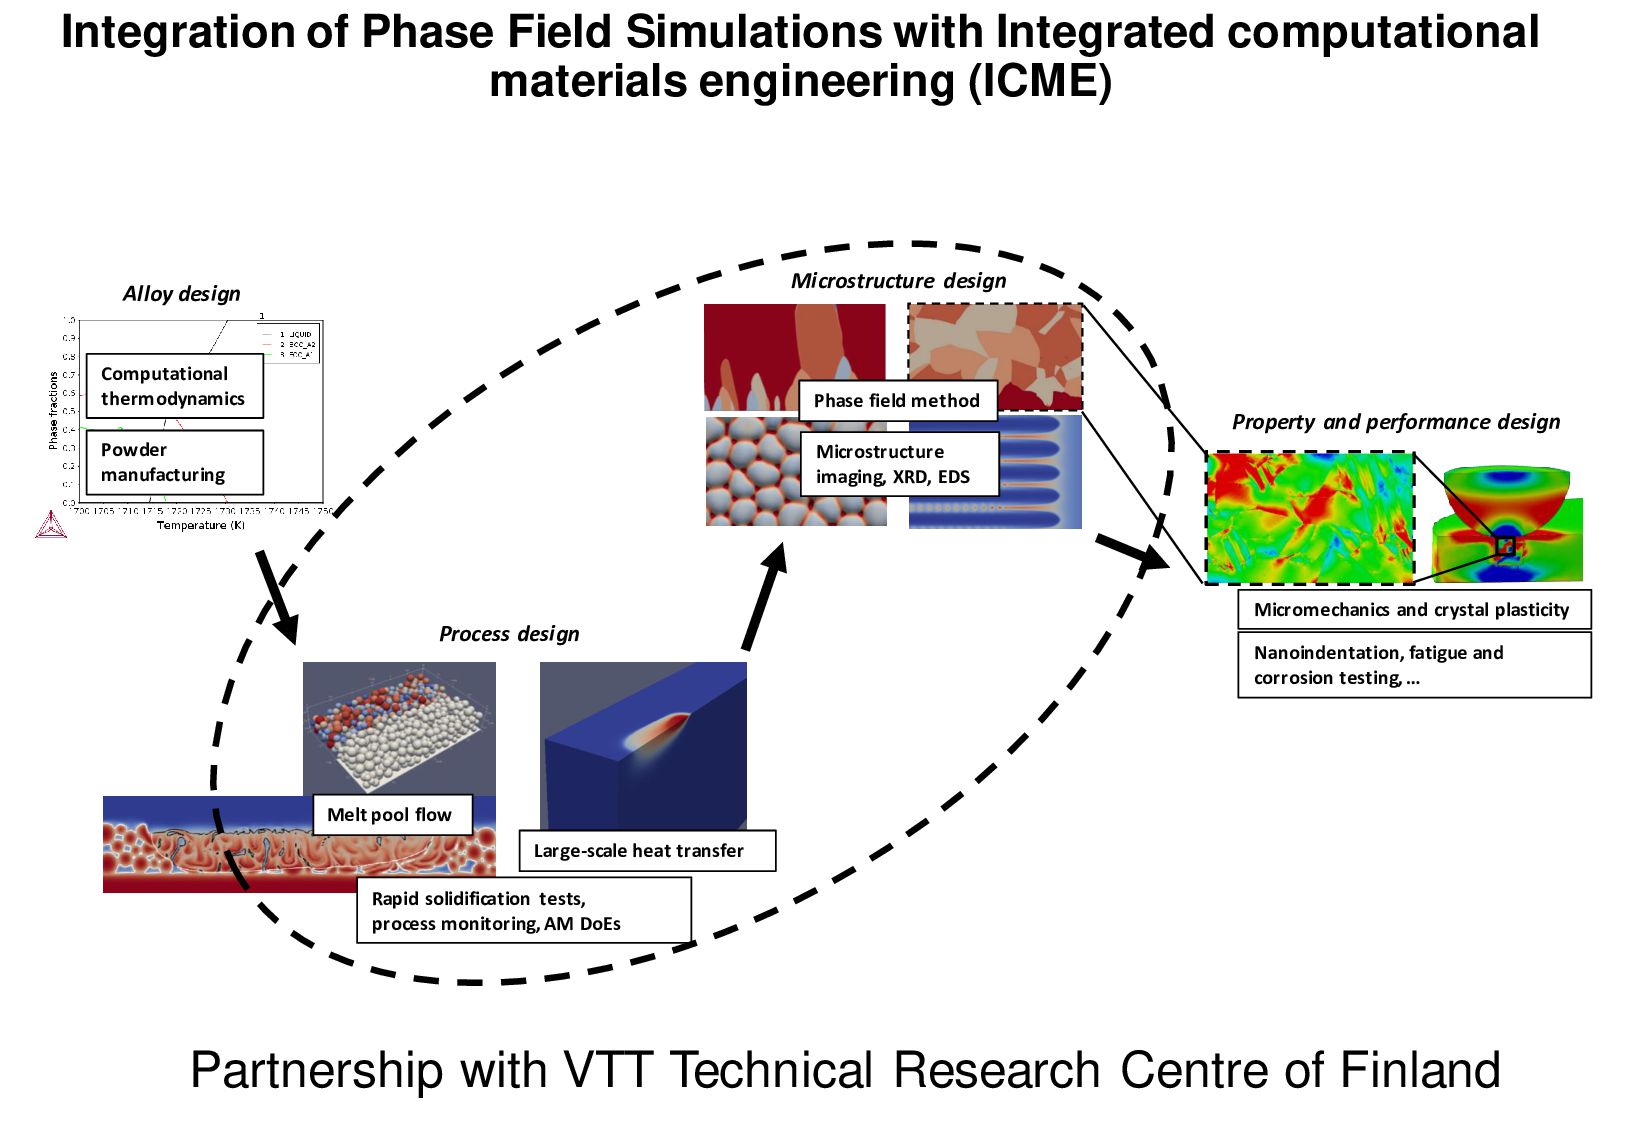
Process design Computational thermodynamics Property and performance design Phase field method Micromechanics and crystal plasticity Integration of Phase Field Simulations with Integrated computational materials engineering (ICME) Powder manufacturing Microstructure imaging, XRD, EDS Nanoindentation, fatigue and corrosion testing, … Rapid solidification tests, process monitoring, AM DoEs Partnership with VTT Technical Research Centre of Finland
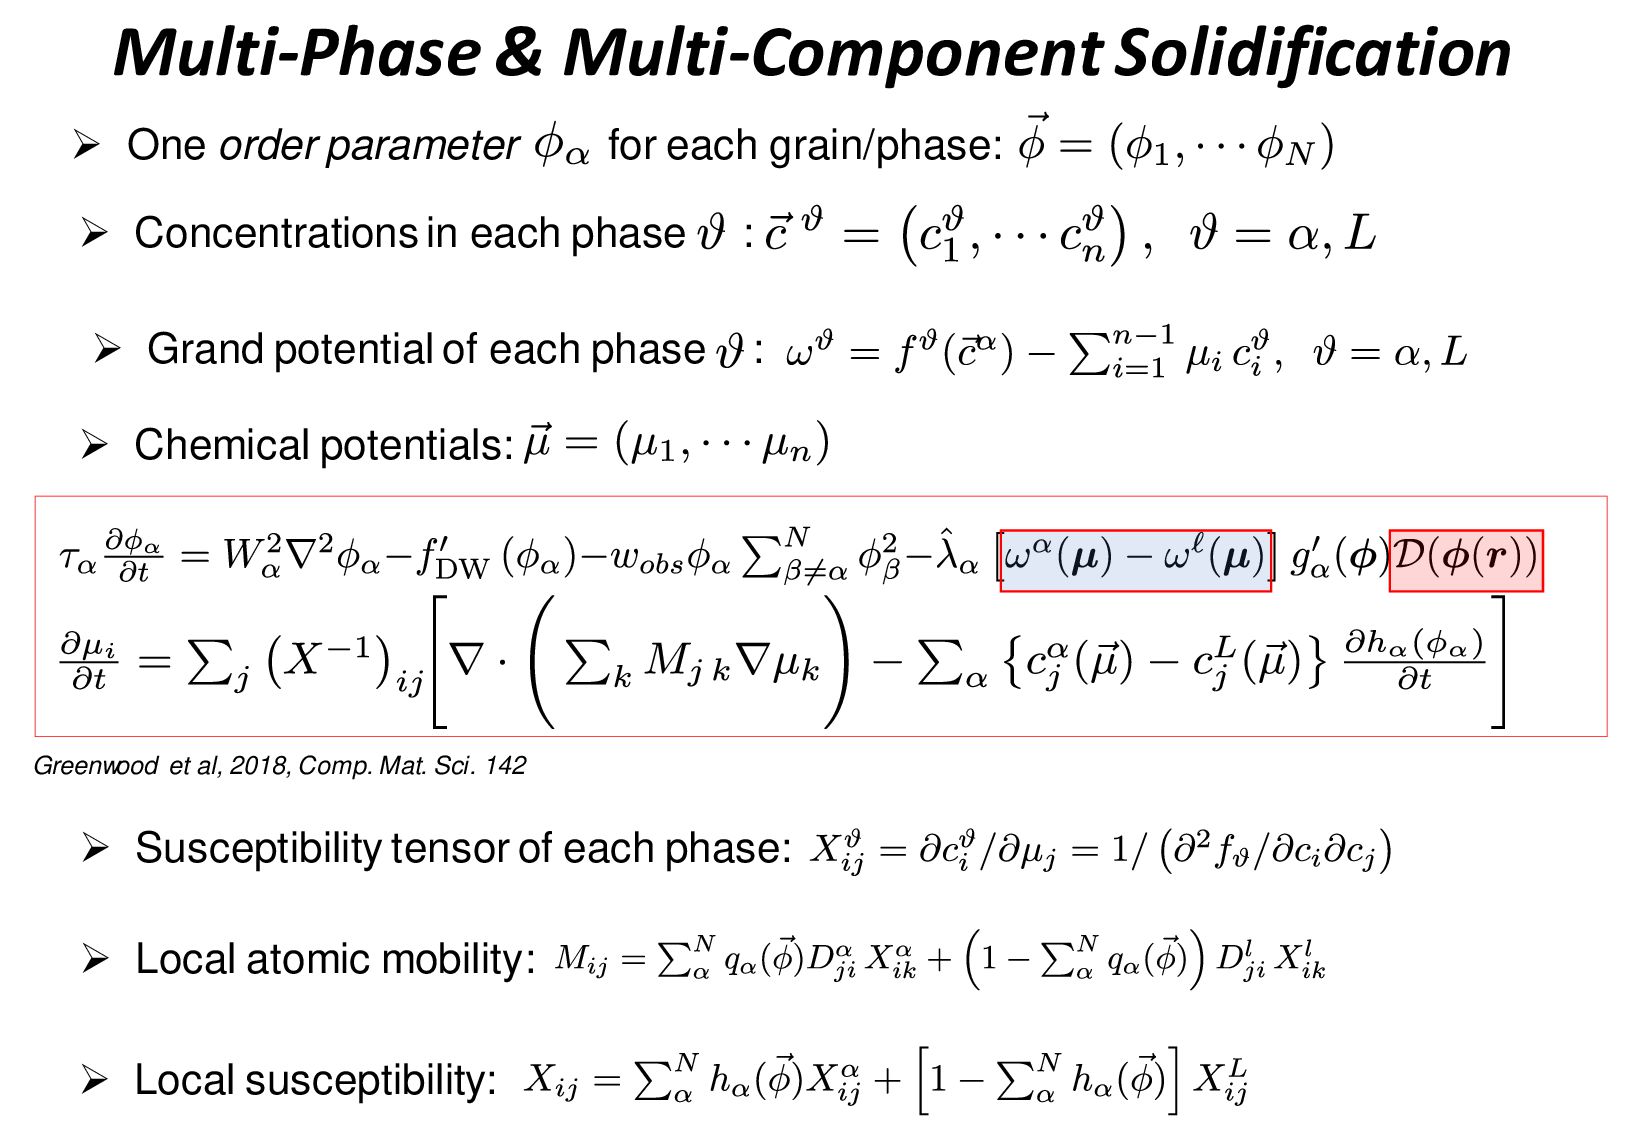
parameter for each grain/phase: ➢ Concentrations in each phase : ➢ Grand potential of each phase : ➢ Local atomic mobility: ➢ Susceptibility tensor of each phase: ➢ Local susceptibility: Greenwood et al, 2018, Comp. Mat. Sci. 142
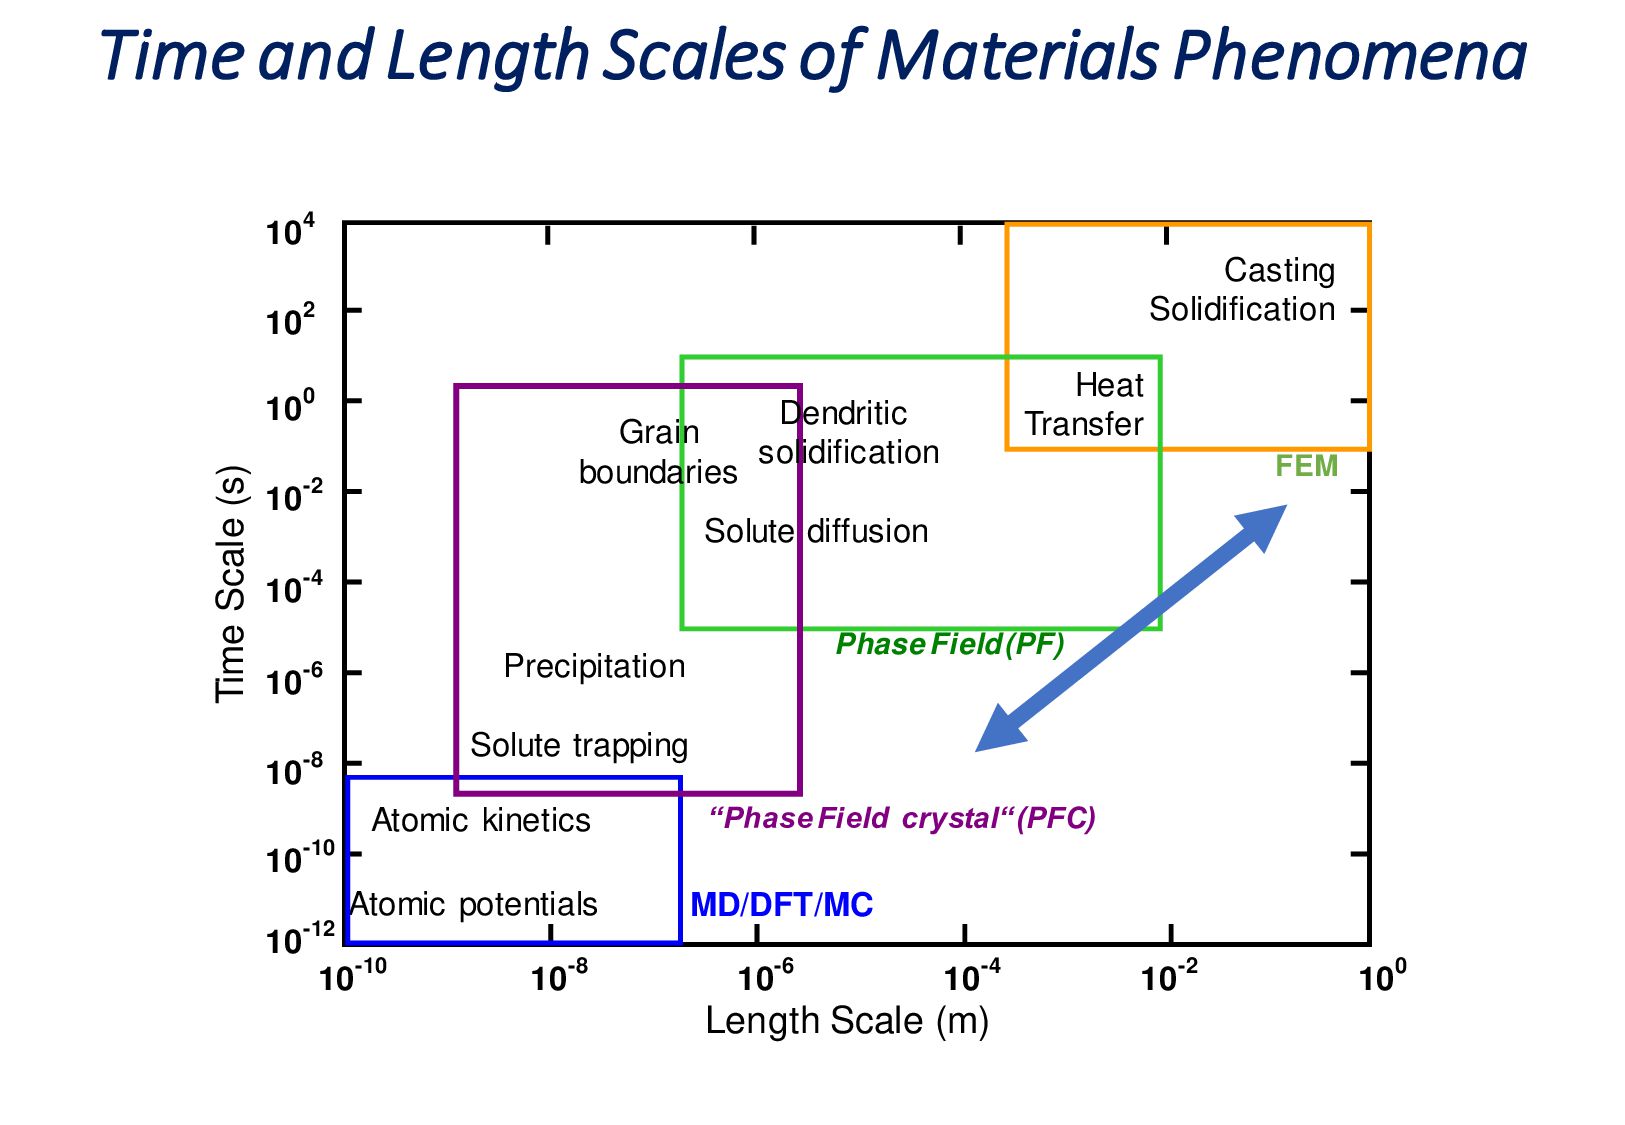
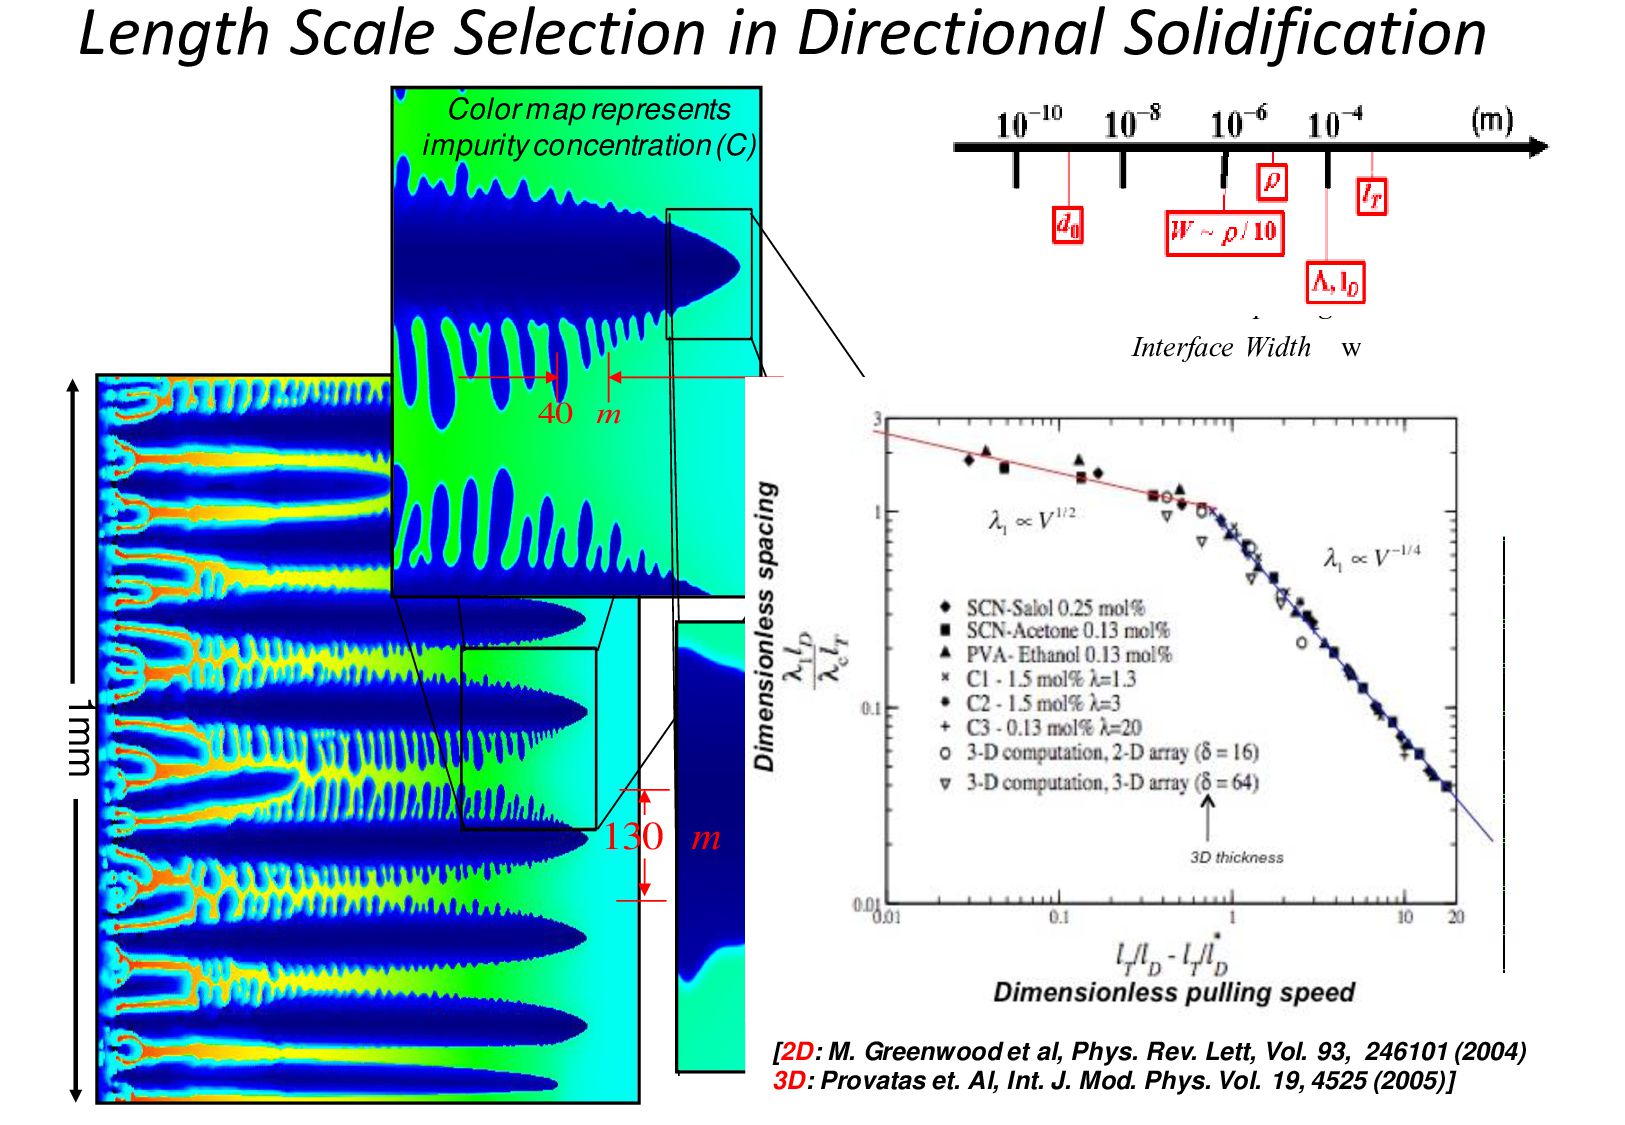
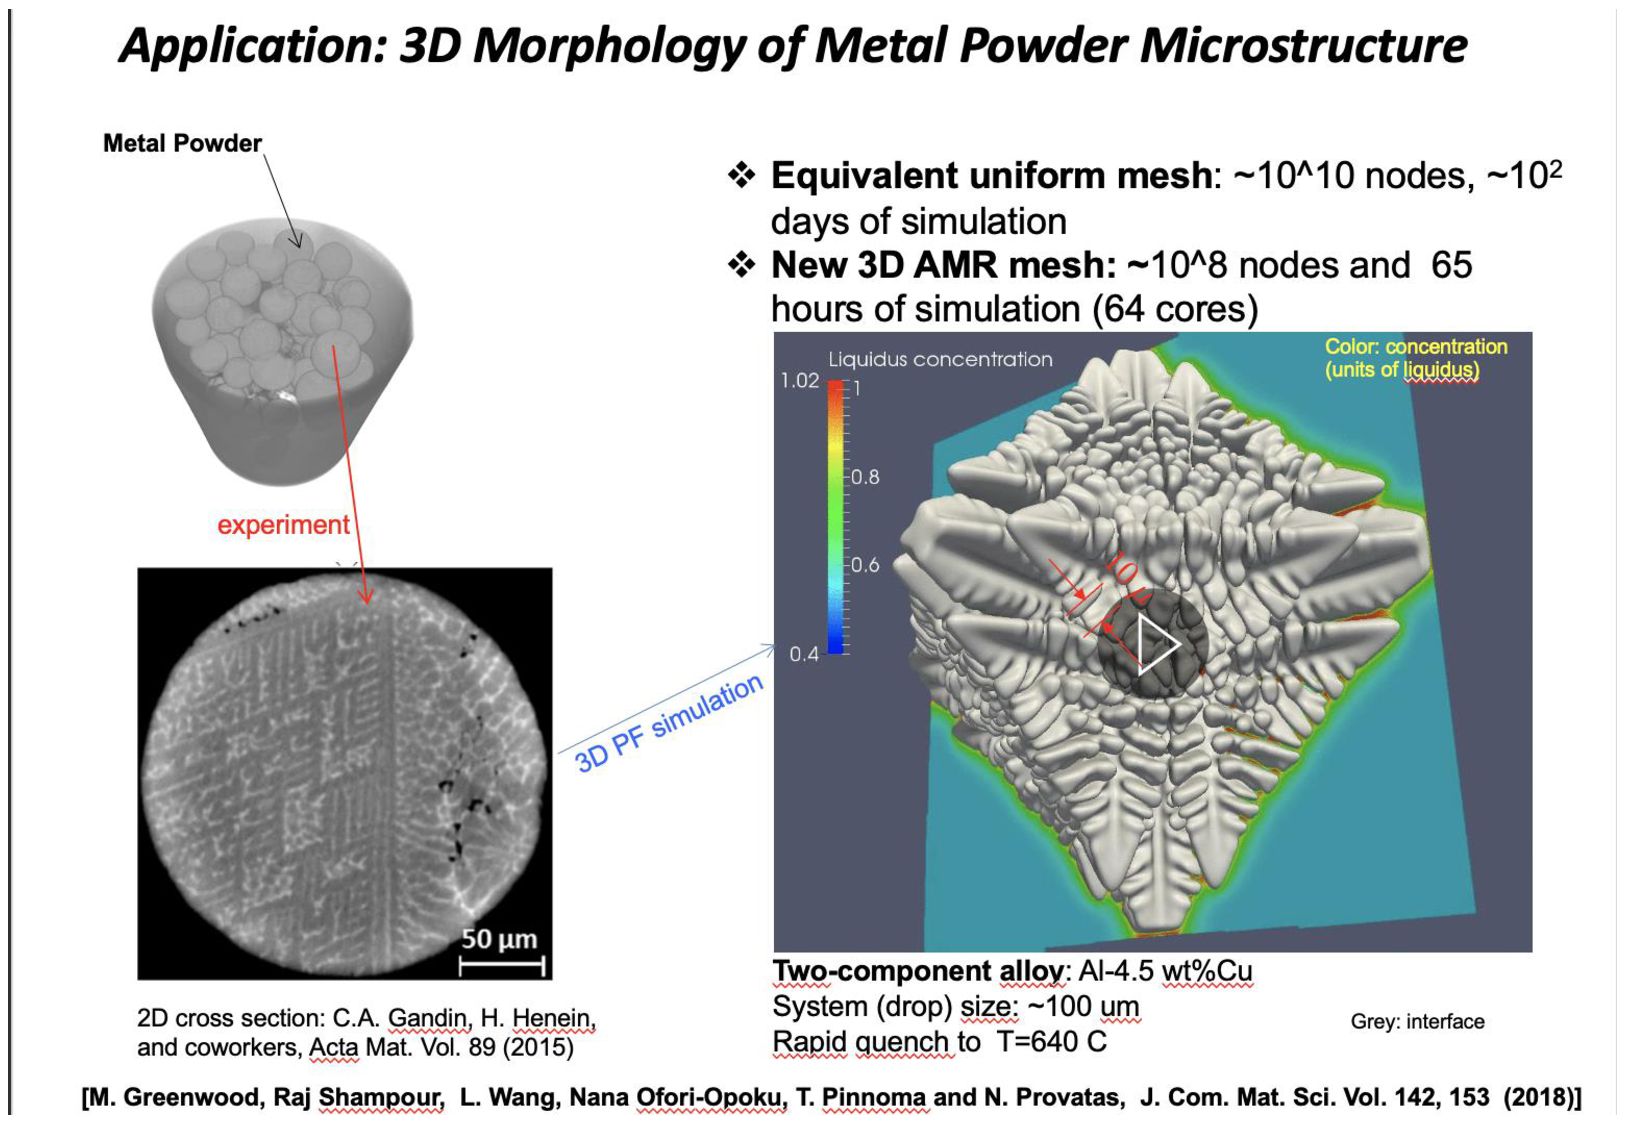
~102 -103nm Dendrite Spacing » L Interface Width » w capillary length = d o dendrite radius = r Length Scale Selection in Directional Solidification [2D: M. Greenwood et al, Phys. Rev. Lett, Vol. 93, 246101 (2004) 3D: Provatas et. Al, Int. J. Mod. Phys. Vol. 19, 4525 (2005)]
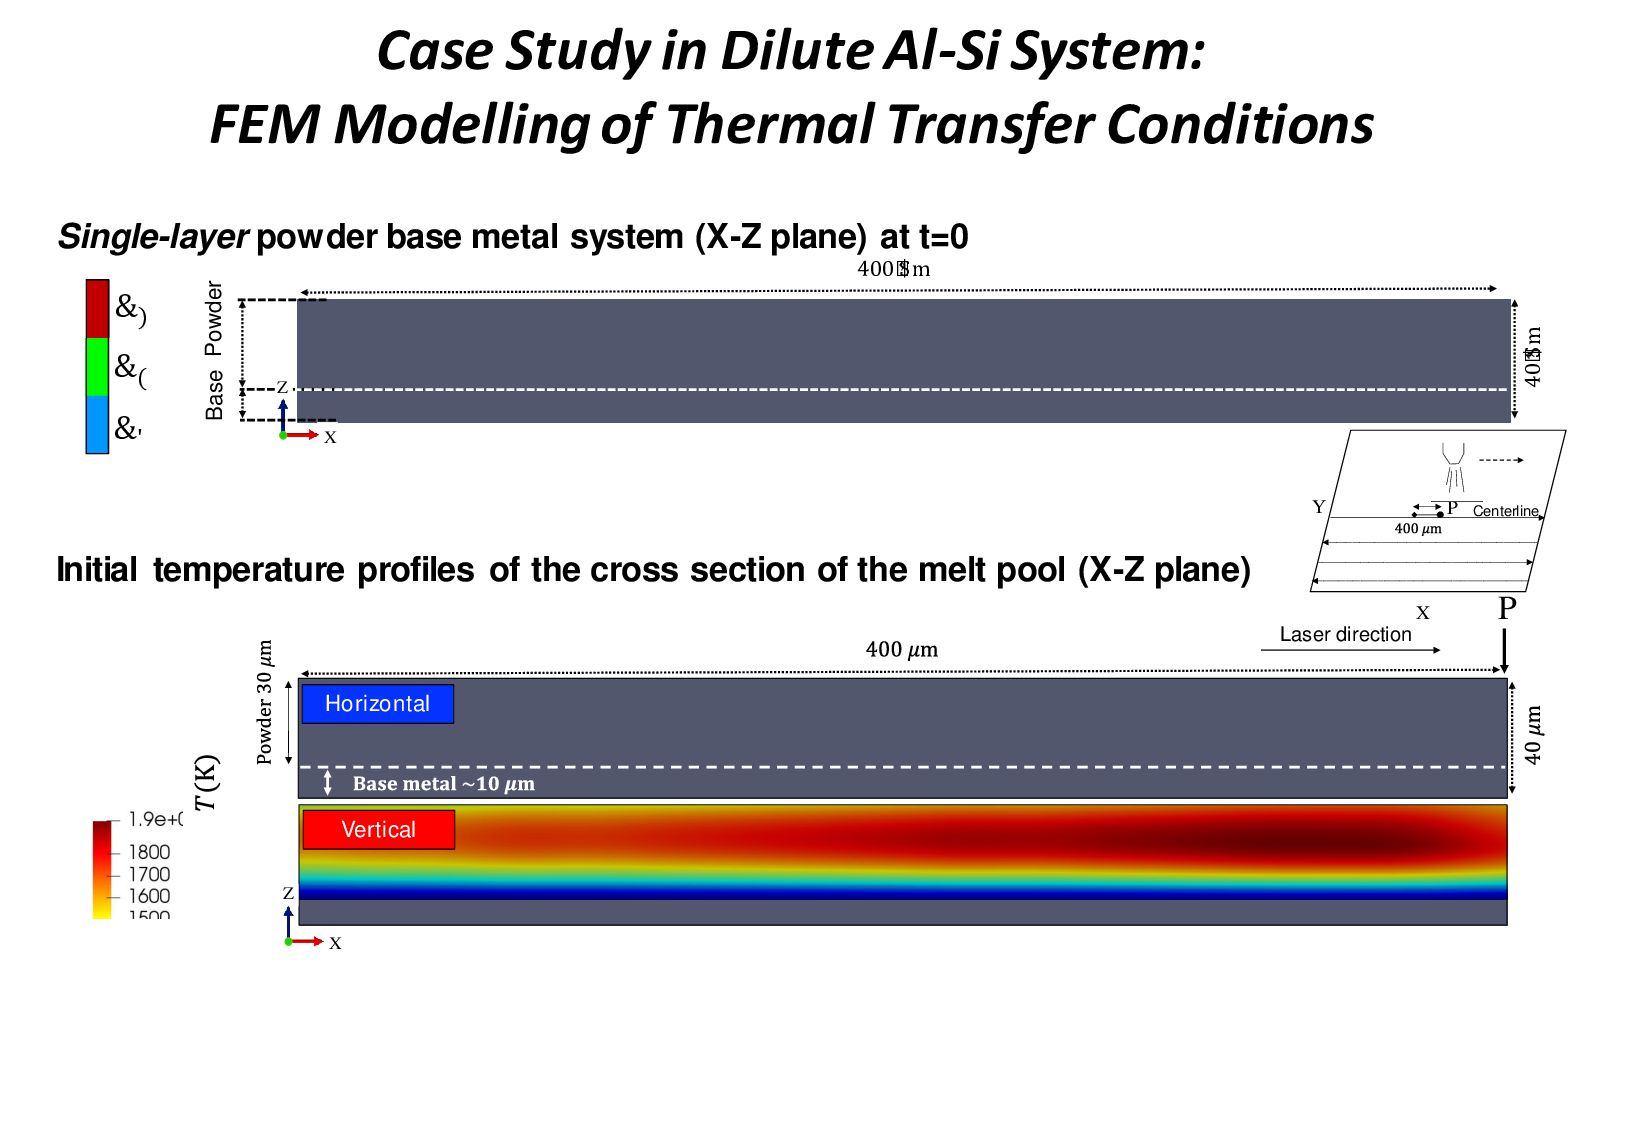
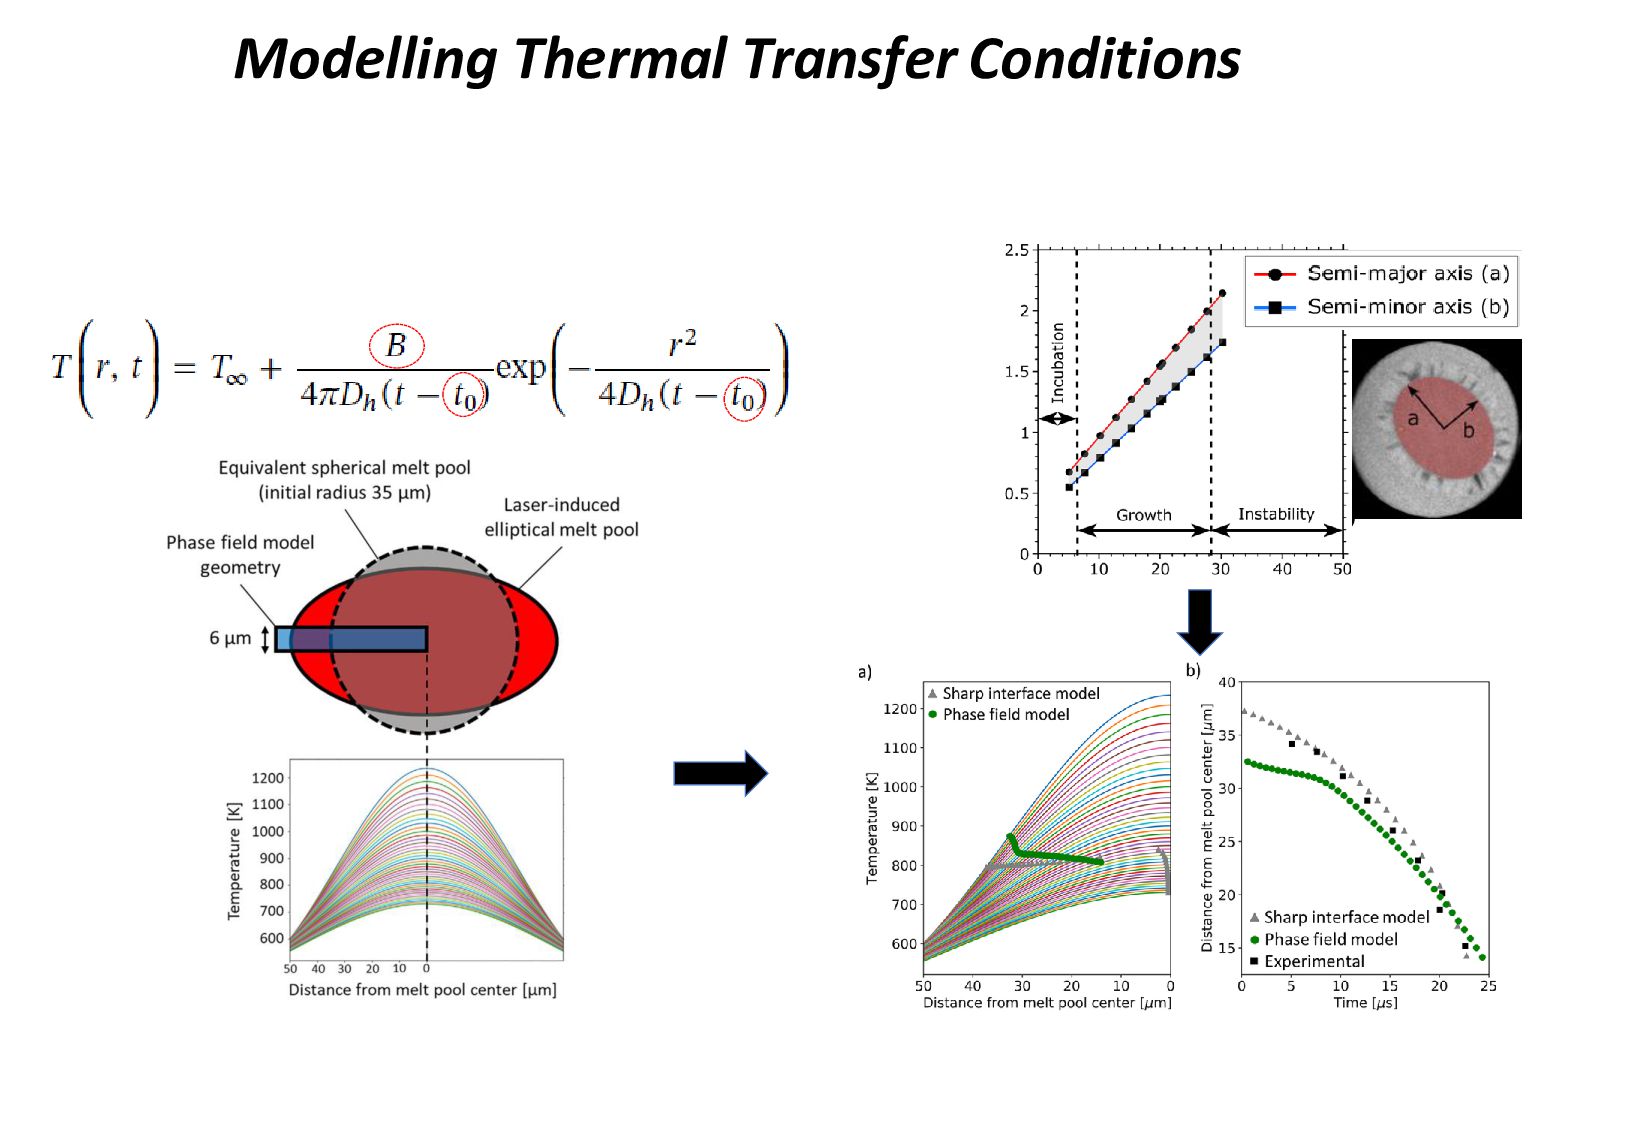
Result 8.0e+00 4 3 6 .0e-04 2 1 5 400 $m Powder 40 $m Base X Y X Z &' &( &) 1.9e+03 1800 1600 Field_30 800 1200 1.9e+03 1800 1400 1000 Horizontal X Y X Z P Vertical Laser direction P X Y Unsteady Heat Transfer in Semi-infinite So Solidification process of the coating layer during a ther operation is an unsteady heat transfer problem. As we d earlier, thermal spray process deposits thin layer of coat materials on surface for protection and thermal resistant as shown. The heated, molten materials will attach to th and cool down rapidly. The cooling process is importan the accumulation of residual thermal stresses in the coa solid liquid Coating with density , latent heat of fusion: hsf Substrate, k, Centerline 1600 Field_30 1200 1.9e+03 1800 1400 1000 Horizontal X Y X Z P Vertical Laser direction P X Y Unsteady Heat Transfer in Semi-infinite Solids Solidification process of the coating layer during a thermal spray operation is an unsteady heat transfer problem. As we discuss earlier, thermal spray process deposits thin layer of coating materials on surface for protection and thermal resistant purposes as shown. The heated, molten materials will attach to the substra and cool down rapidly. The cooling process is important to preve the accumulation of residual thermal stresses in the coating layer. S(t) solid liquid Coating with density , latent heat of fusion: hsf Substrate, k, Centerline Initial temperature profiles of the cross section of the melt pool (X-Z plane) 1.9e+03 1600 Field_30 1200 1.9e+03 1800 1400 1000 Horizontal X Y X Z P Vertical Laser direction P X Y Unsteady Heat Transfer in Semi-infinite Solids Solidification process of the coating layer during a thermal spray operation is an unsteady heat transfer problem. As we discuss earlier, thermal spray process deposits thin layer of coating materials on surface for protection and thermal resistant purposes, as shown. The heated, molten materials will attach to the substrate and cool down rapidly. The cooling process is important to prevent the accumulation of residual thermal stresses in the coating layer. S(t) solid liquid Coating with density , latent heat of fusion: hsf Substrate, k, Centerline Case Study in Dilute Al-Si System: FEM Modelling of Thermal Transfer Conditions
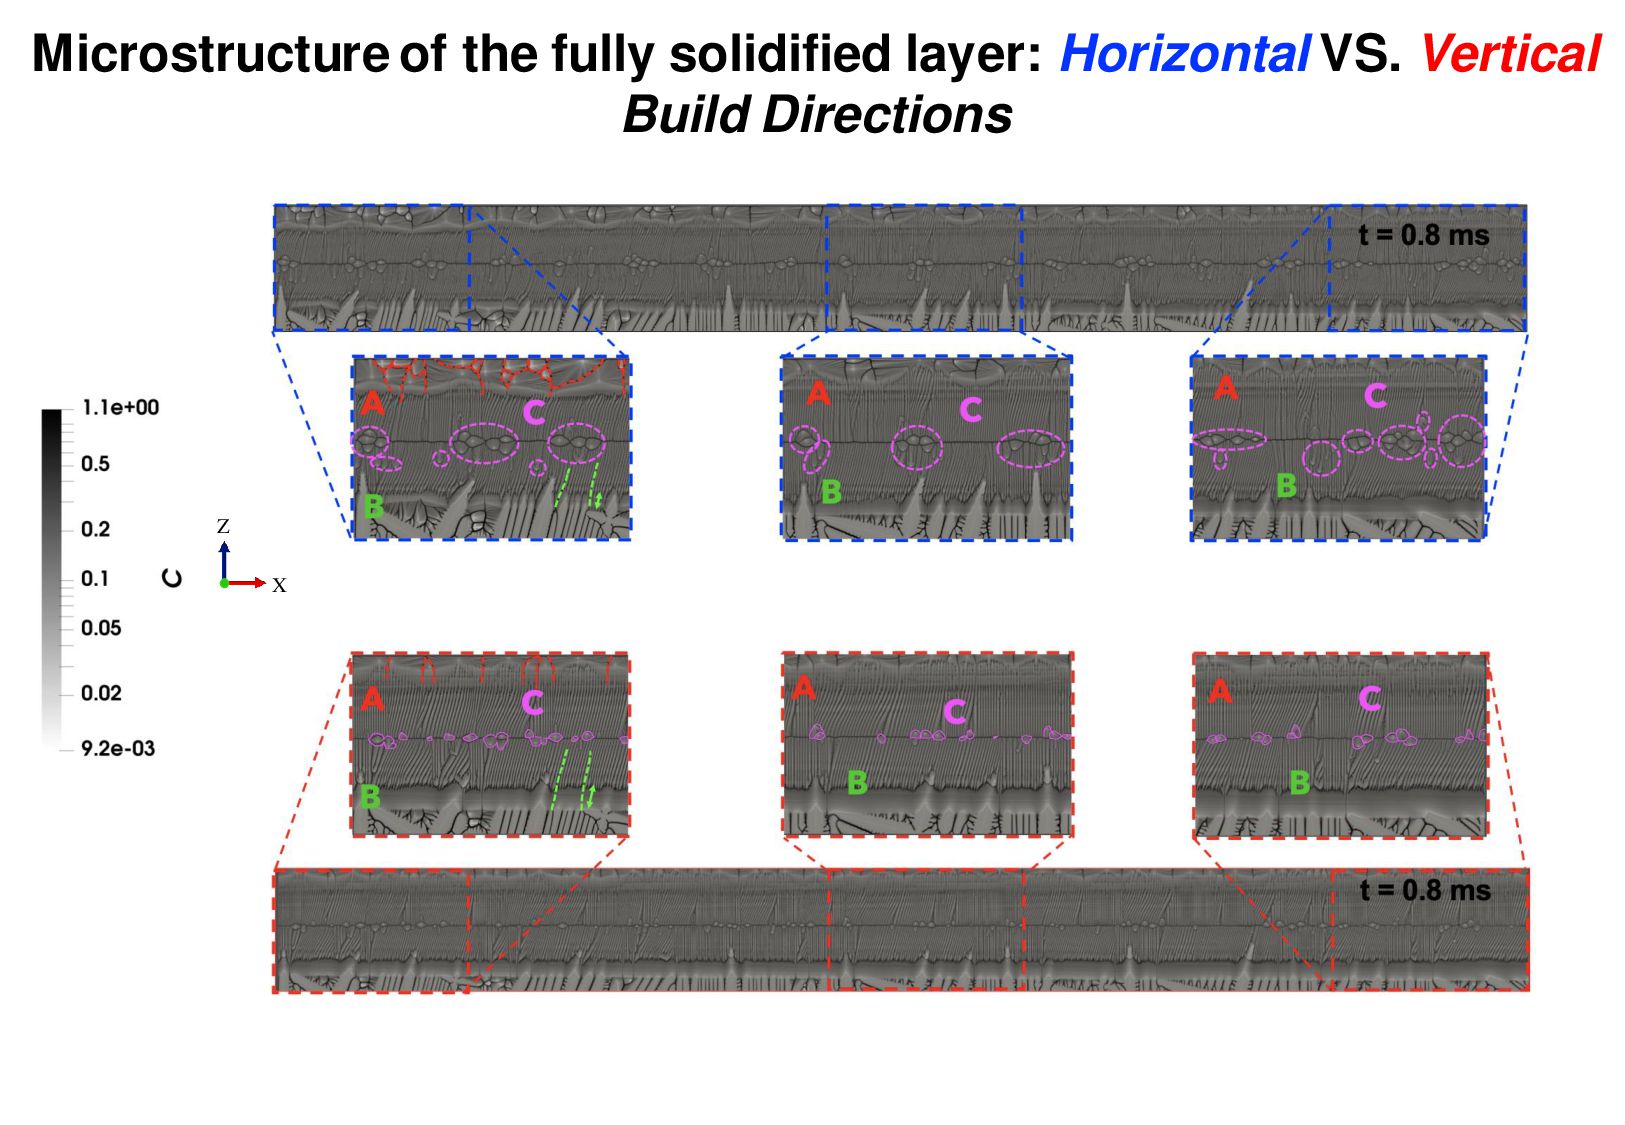
0.02 Field_4 0.1 0.2 1.1e+00 0.5 0.05 B B C A A A A B Increasing nucleation density × 10$ %s 1.1e+00 0.5 t =5.0 t =8.0 X X 9 2e-03 0.02 Field_4 0.1 0.2 1.1e+00 0.5 0.05 B B C A A A A B Increasing nucleation density × 10$ %s t = 0.5 ms 1.1e+00 0.5 t =5.0 t =8.0 X Y X Z 9 2e-03 0.02 Field_4 0.1 0.2 1.1e+00 0.5 0.05 B B C A A A A B Increasing nucleation density × 10$ %s t = 0.8 ms Microstructure Evolution in Horizontal Build Sample
Directions 9 2e-03 0.02 Field_4 0.1 0.2 1.1e+00 0.5 0.05 t =5.0 t =8.0 X Y X Z B B (c) 9 2e-03 0.02 Field_4 0.1 0.2 1.1e+00 0.5 0.05 B B C A A A A B Increasing nucleation density × 10$ %s 1.1e+00 0.5 t =5 t =8 X Y X Z 9 2e-03 0.02 Field_4 0.1 0.2 1.1e+00 0.5 0.05 B B C A A A A B Increasing nucleation density × 10
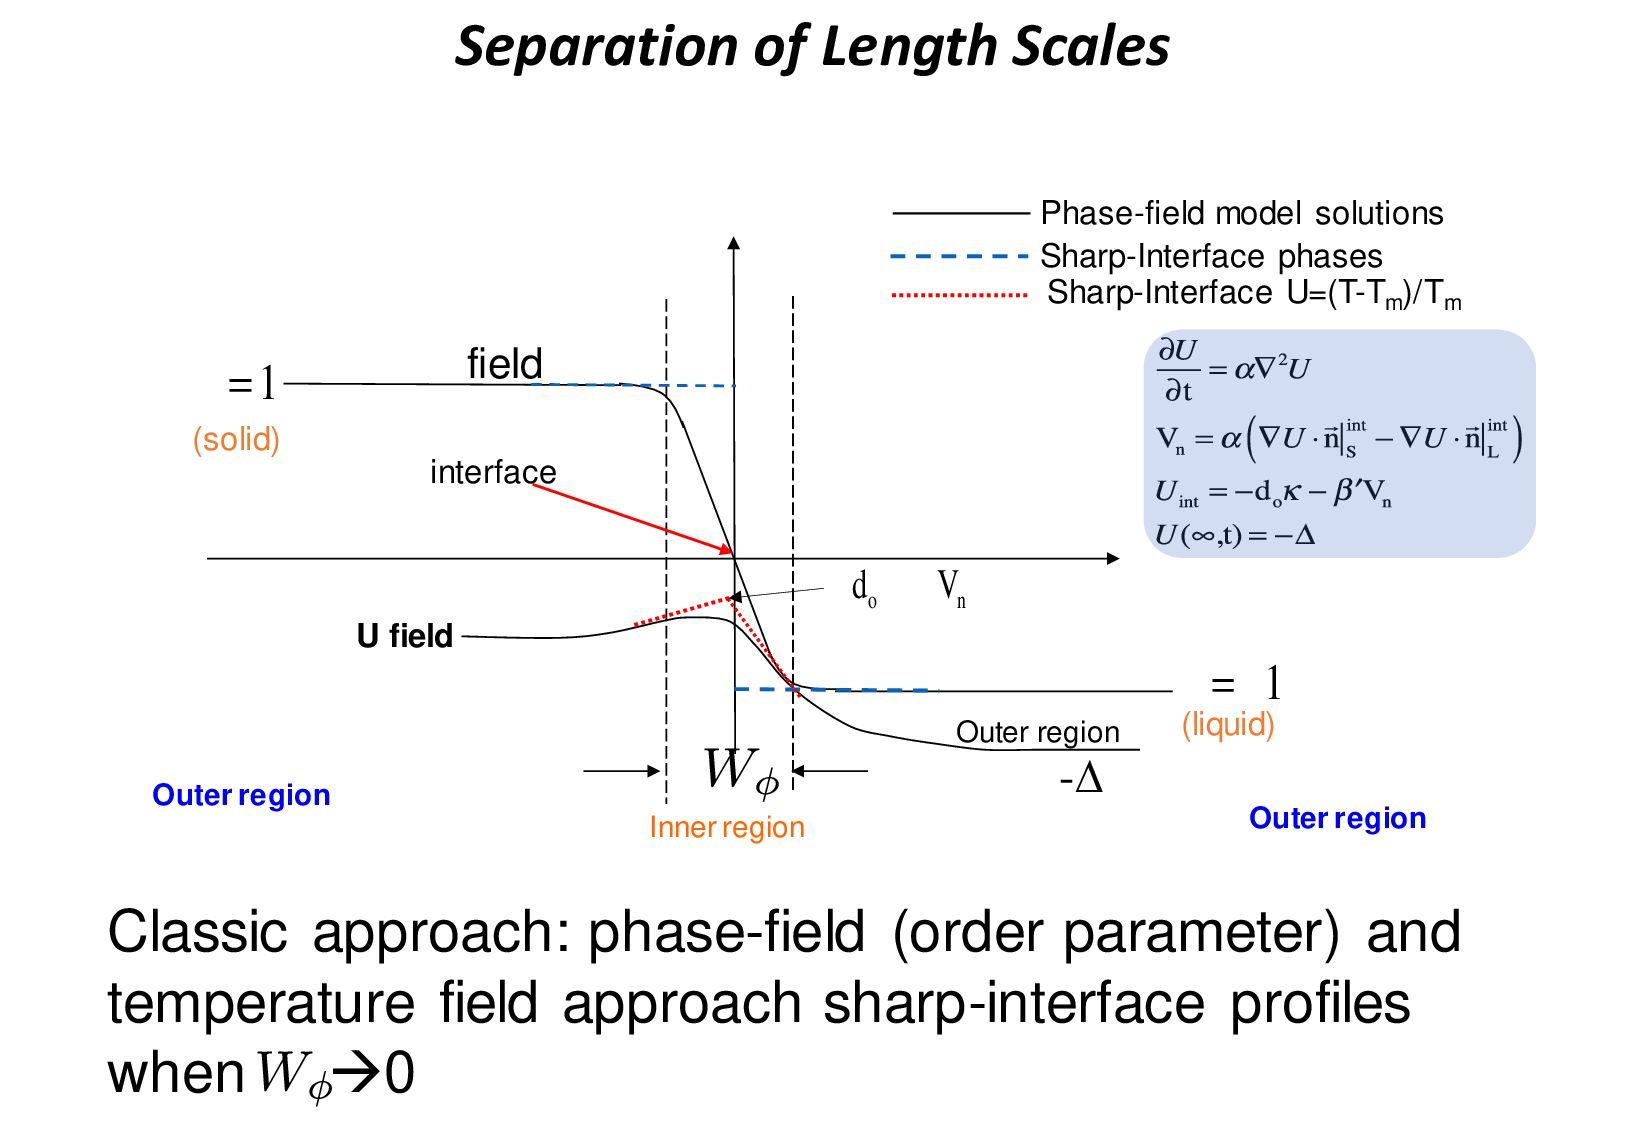
-1 Phase-field model solutions U field Sharp-Interface phases interface Outer region Outer region Inner region Classic approach: phase-field (order parameter) and temperature field approach sharp-interface profiles when →0 f =1 (liquid) -d o k -bV n Sharp-Interface U=(T-Tm )/Tm Outer region
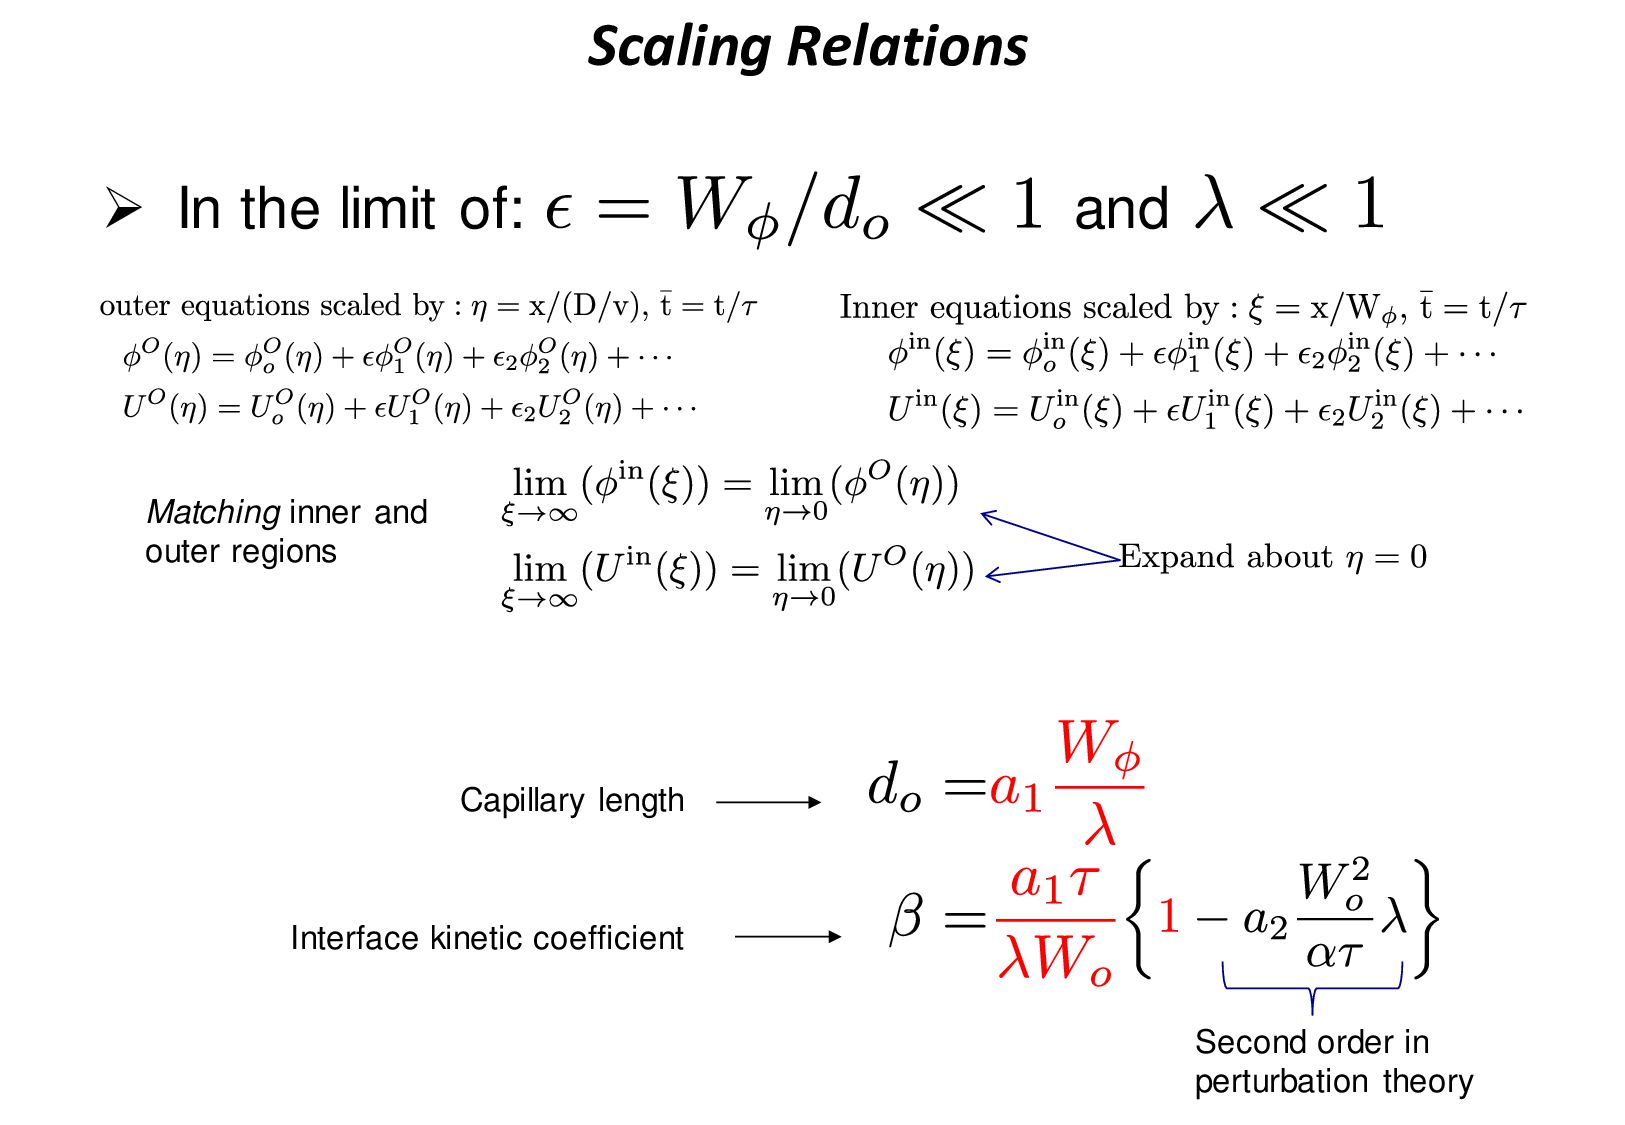
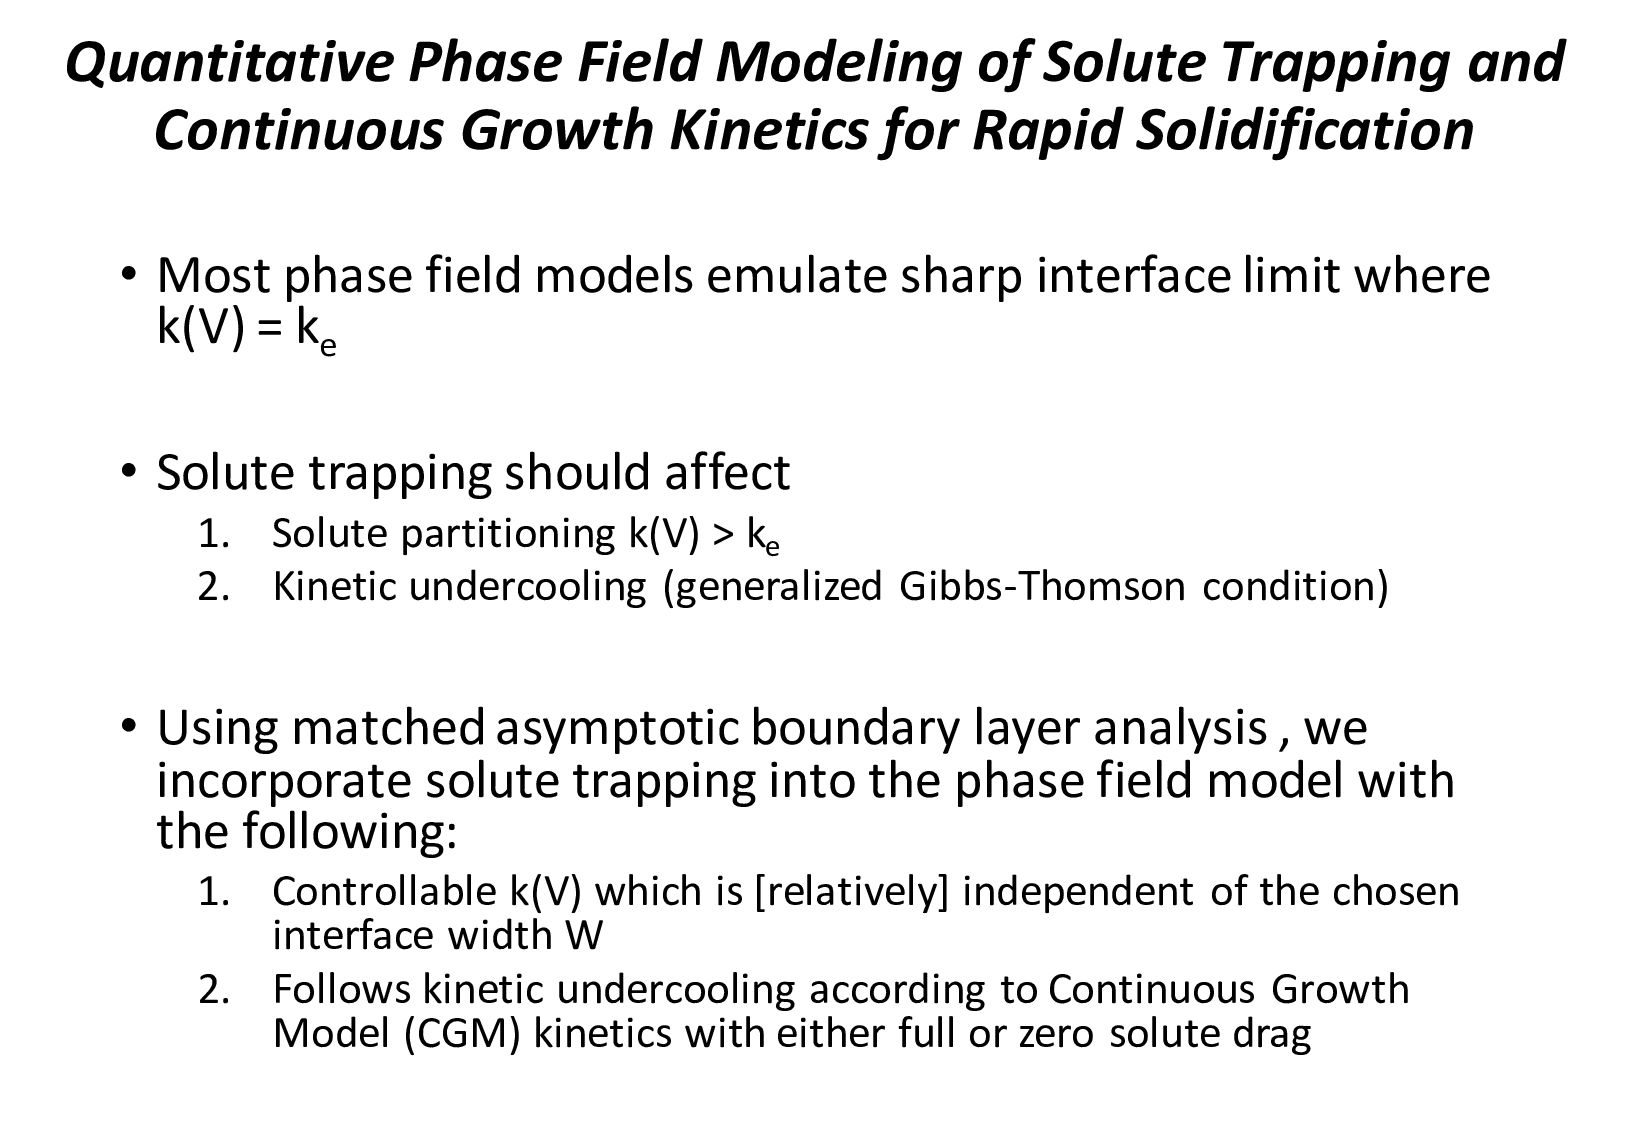
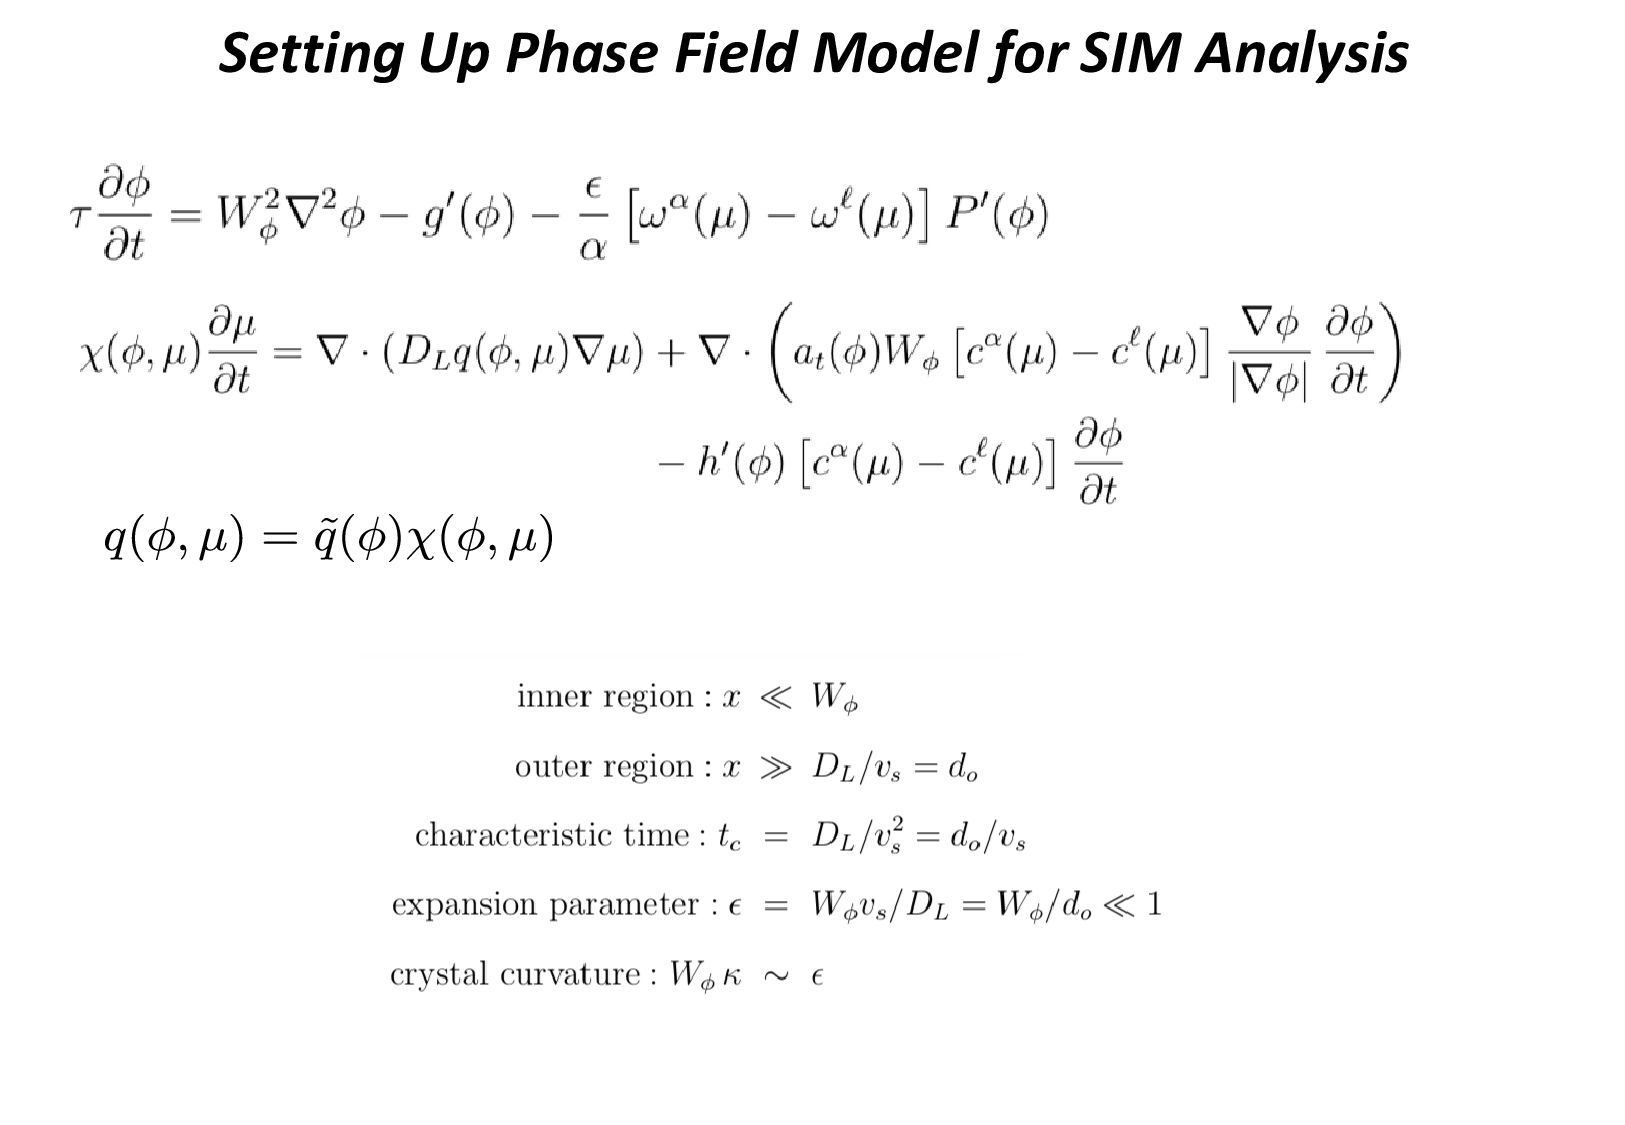
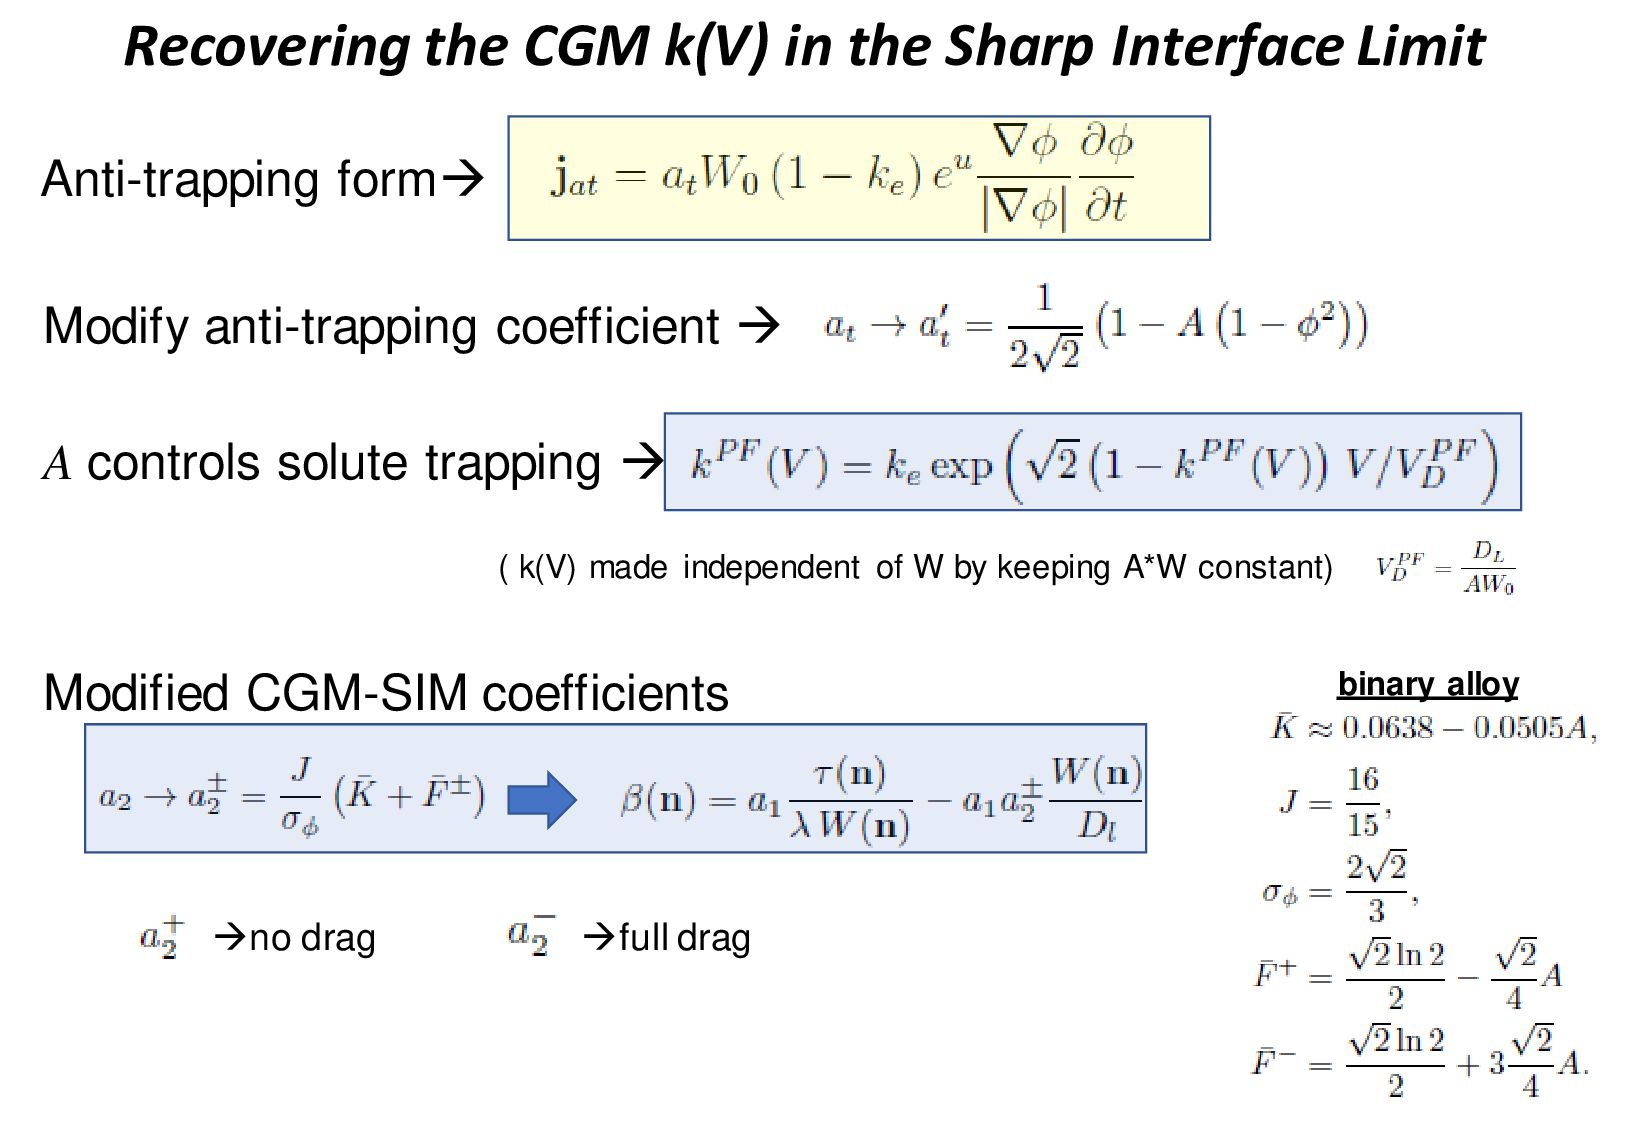
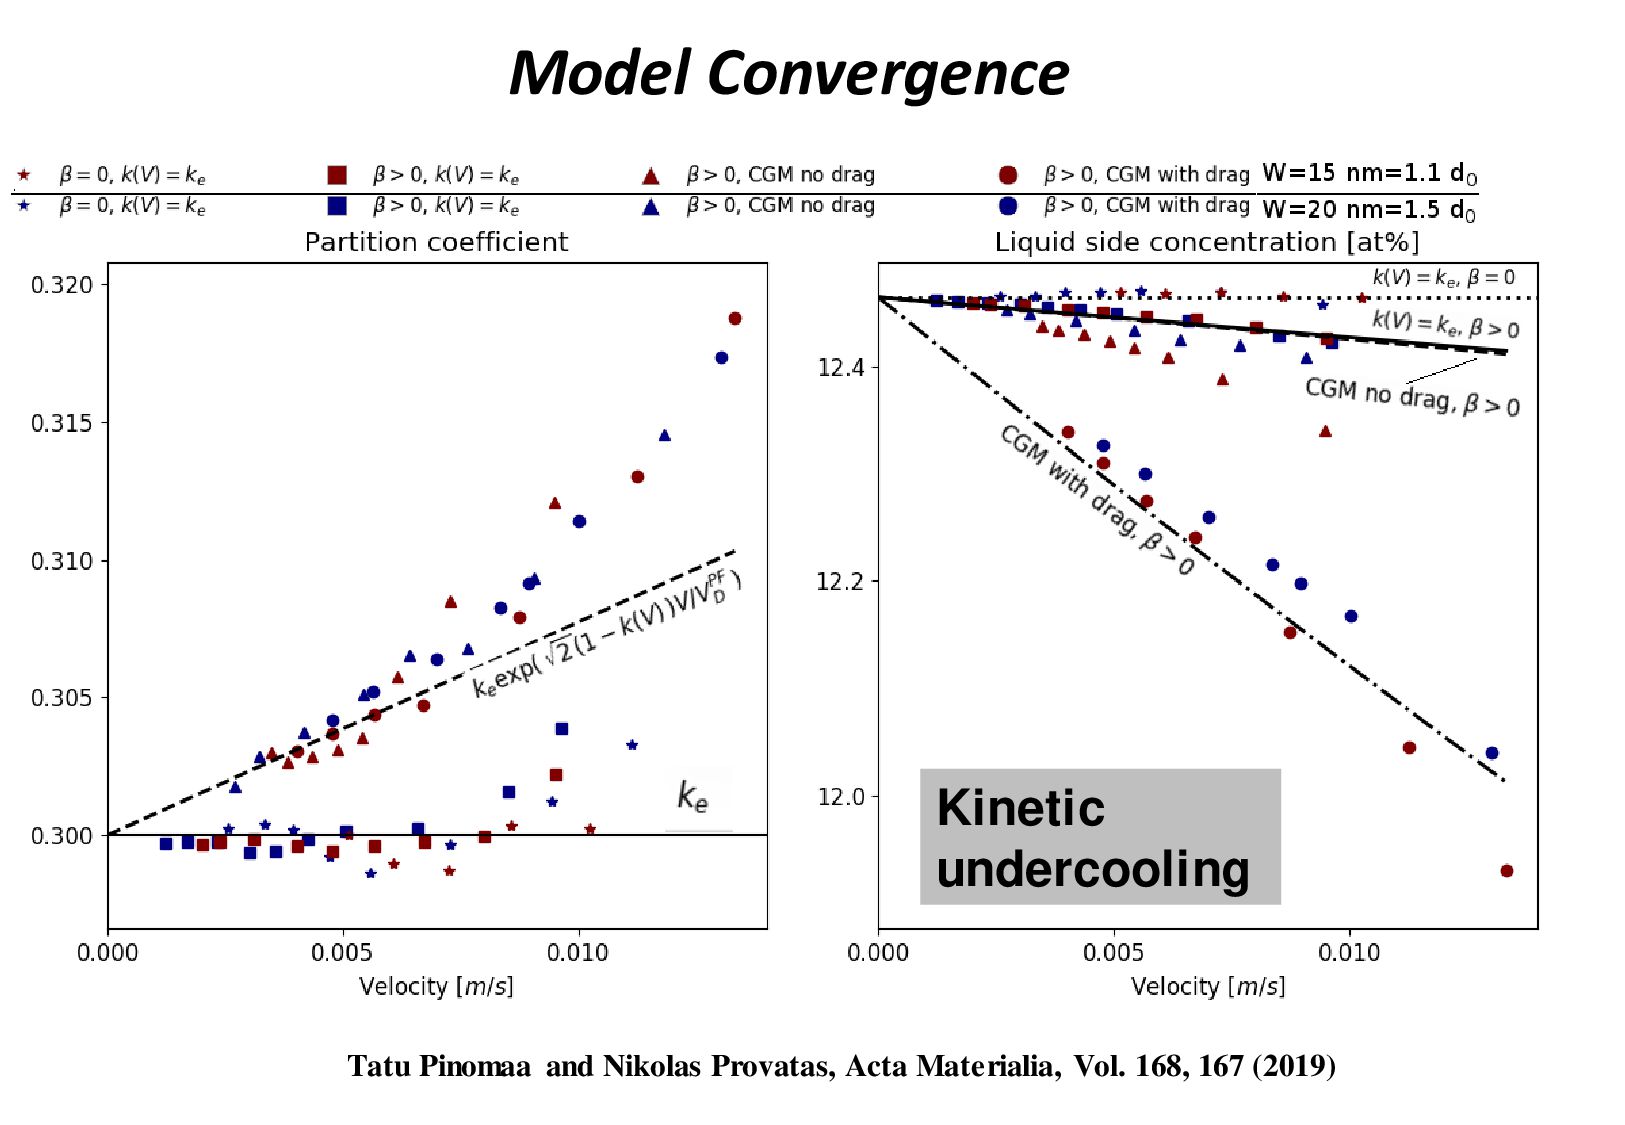
Kinetics for Rapid Solidification • Most phase field models emulate sharp interface limit where k(V) = ke • Solute trapping should affect 1. Solute partitioning k(V) > ke 2. Kinetic undercooling (generalized Gibbs-Thomson condition) • Using matched asymptotic boundary layer analysis , we incorporate solute trapping into the phase field model with the following: 1. Controllable k(V) which is [relatively] independent of the chosen interface width W 2. Follows kinetic undercooling according to Continuous Growth Model (CGM) kinetics with either full or zero solute drag
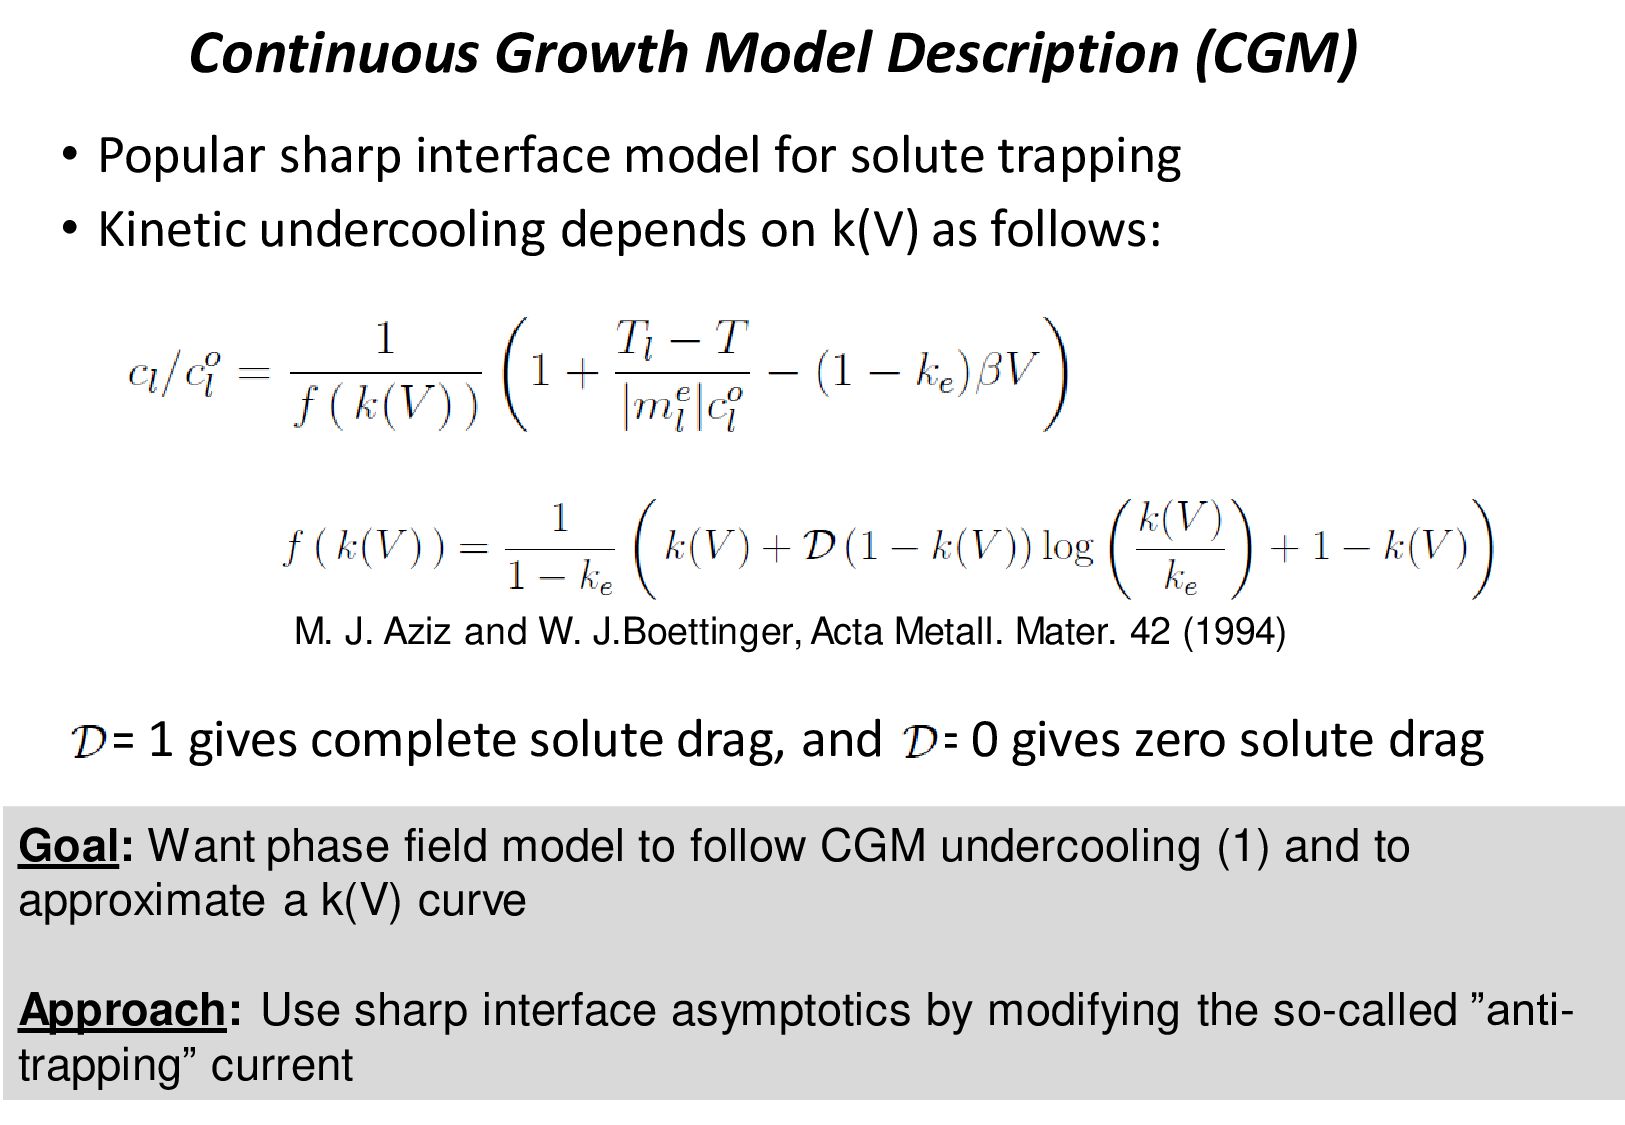
for solute trapping • Kinetic undercooling depends on k(V) as follows: = 1 gives complete solute drag, and = 0 gives zero solute drag Goal: Want phase field model to follow CGM undercooling (1) and to approximate a k(V) curve Approach: Use sharp interface asymptotics by modifying the so-called ”anti- trapping” current M. J. Aziz and W. J.Boettinger, Acta Metall. Mater. 42 (1994)
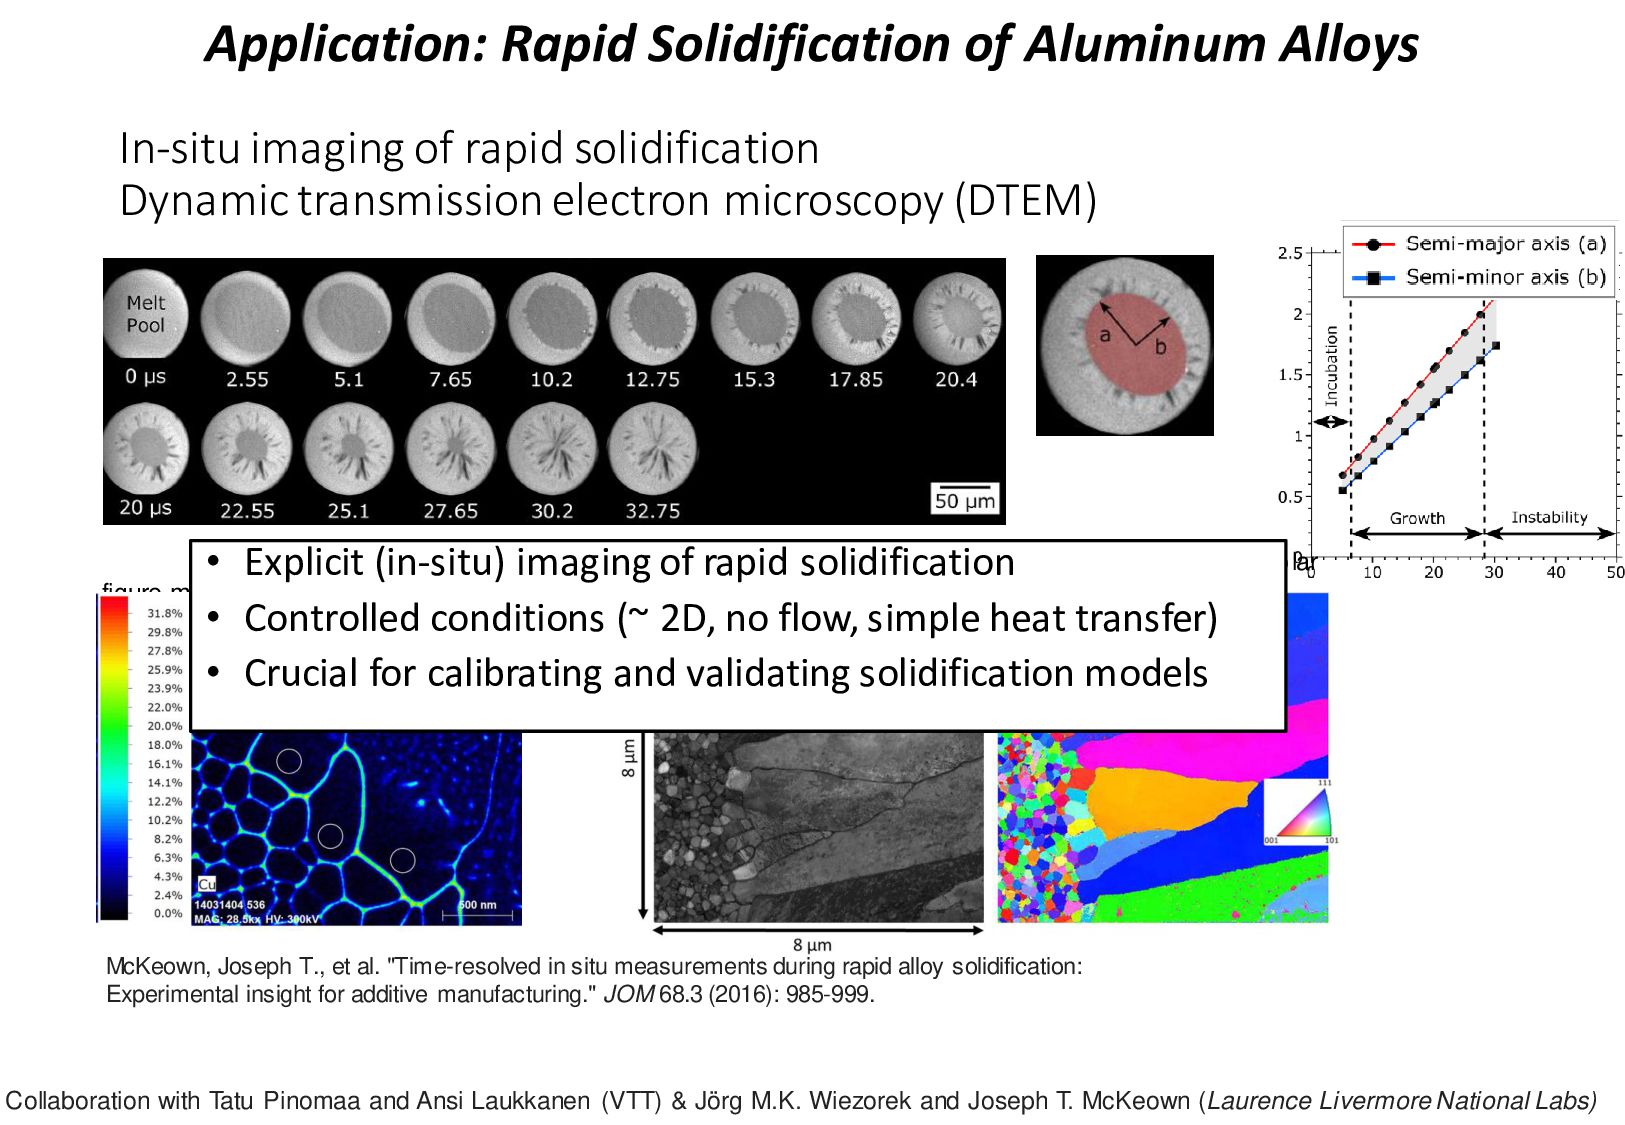
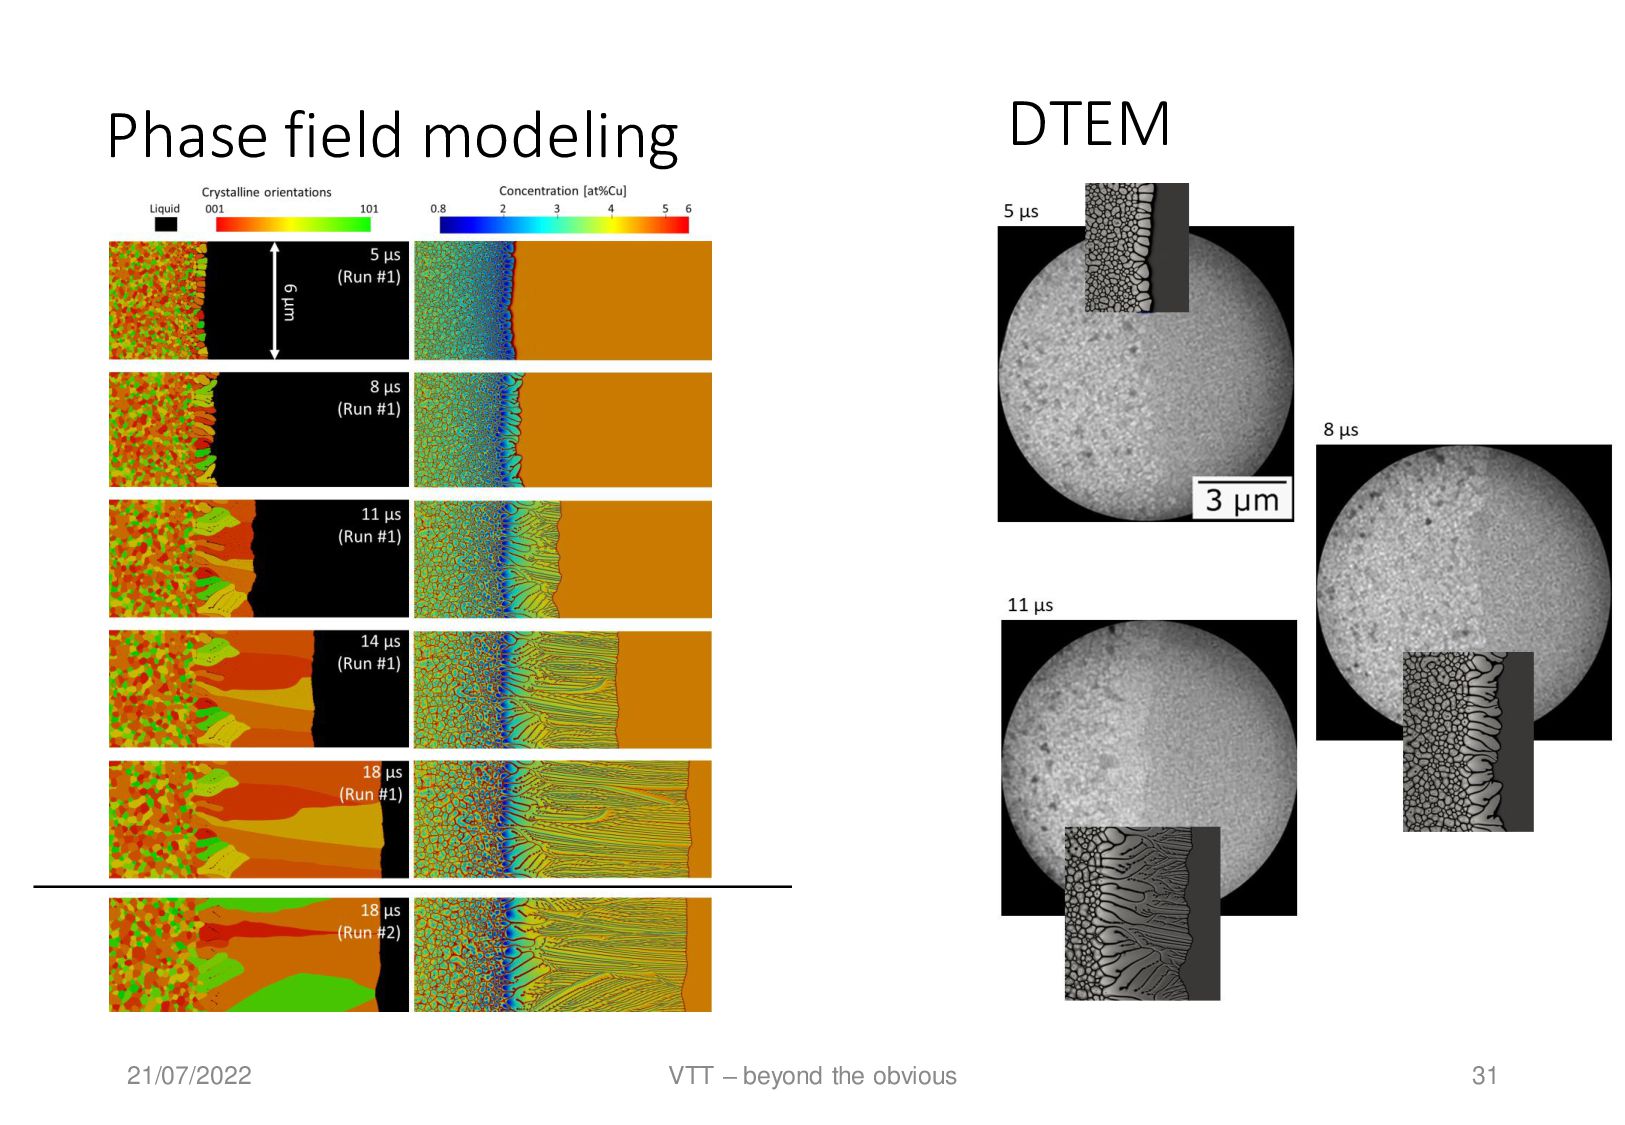
Copper concentration (EDXS) STEM image quality map Inverse polar figure map McKeown, Joseph T., et al. "Time-resolved in situ measurements during rapid alloy solidification: Experimental insight for additive manufacturing." JOM 68.3 (2016): 985-999. • Explicit (in-situ) imaging of rapid solidification • Controlled conditions (~ 2D, no flow, simple heat transfer) • Crucial for calibrating and validating solidification models Application: Rapid Solidification of Aluminum Alloys Collaboration with Tatu Pinomaa and Ansi Laukkanen (VTT) & Jörg M.K. Wiezorek and Joseph T. McKeown (Laurence Livermore National Labs)