Upgrade to Pro — share decks privately, control downloads, hide ads and more …

US Election Web Monitor

US Election Web Monitor

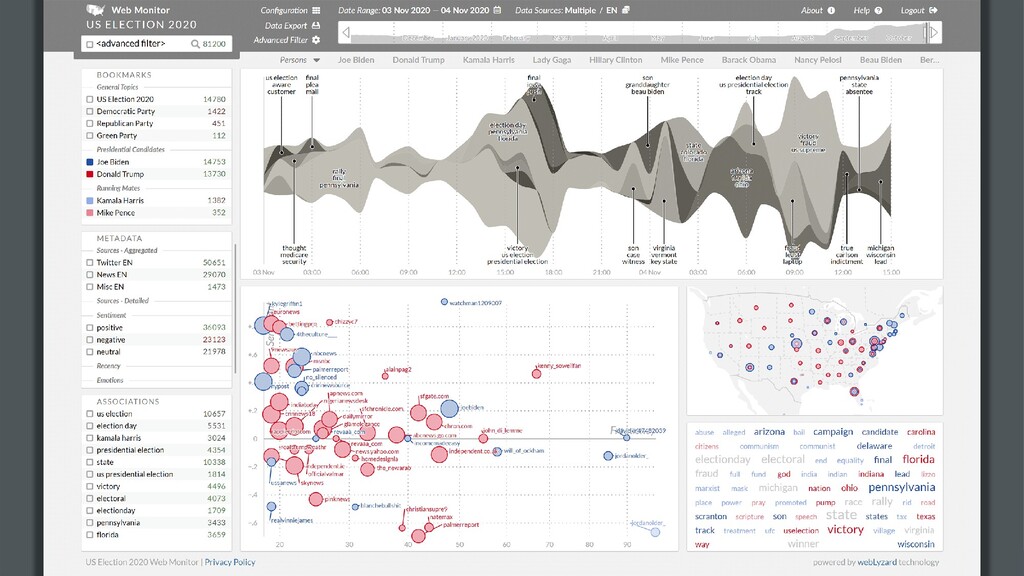
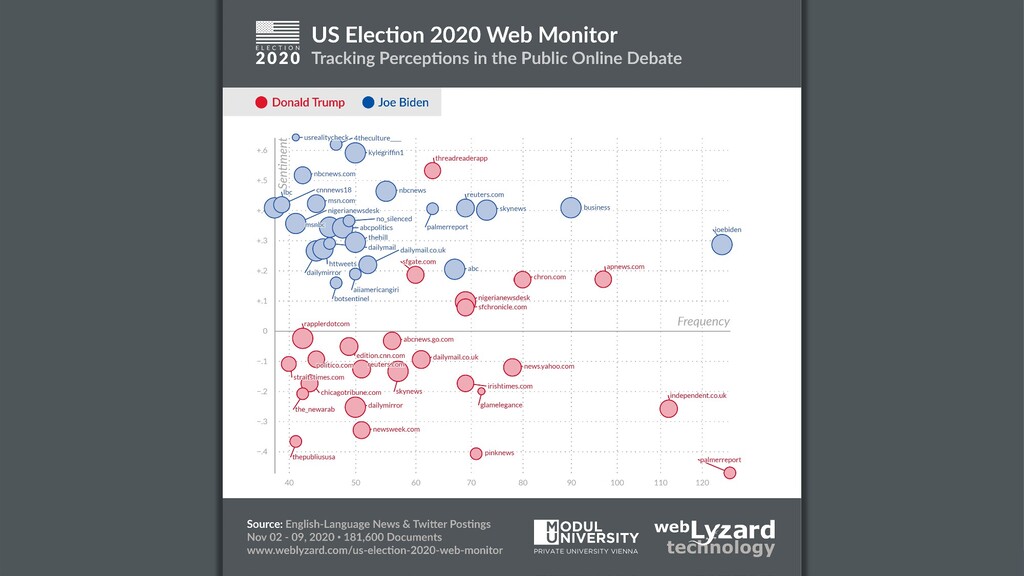
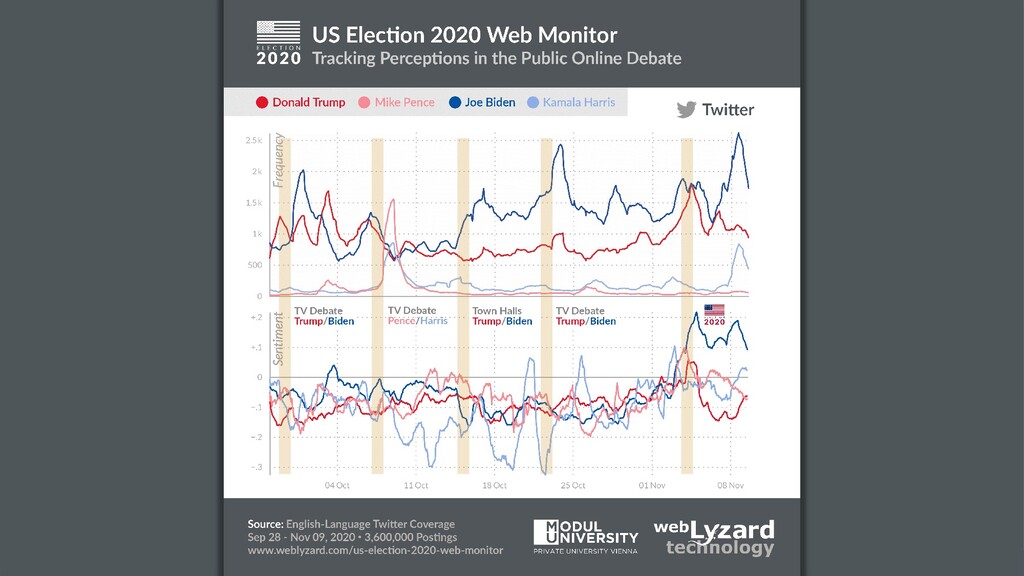
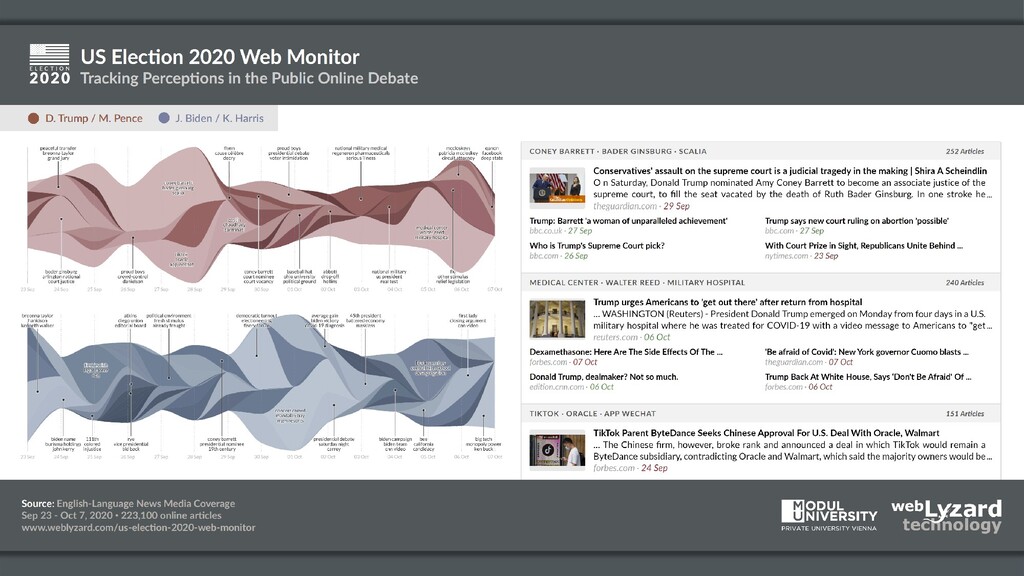
The US Election 2020 Web Monitor is a freely available Web intelligence platform to analyze the public debate and track the candidates’ performance on the campaign trail.

www.weblyzard.com/us-election-2020-web-monitor

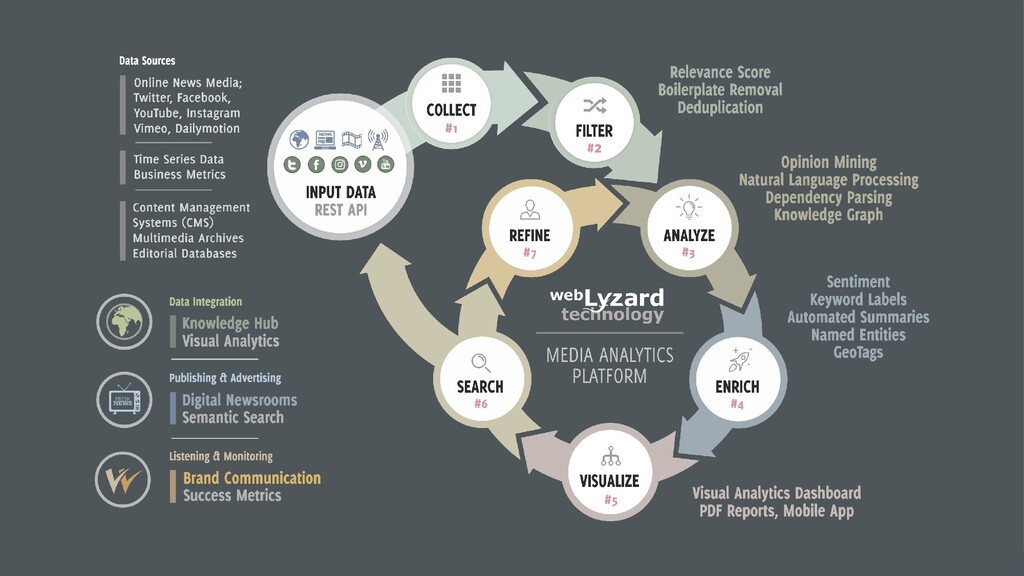
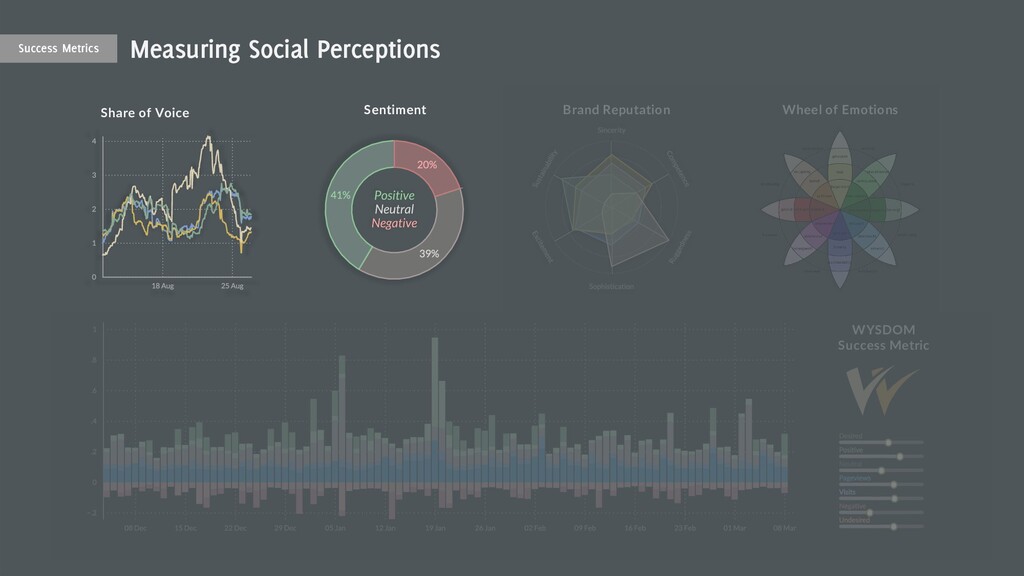
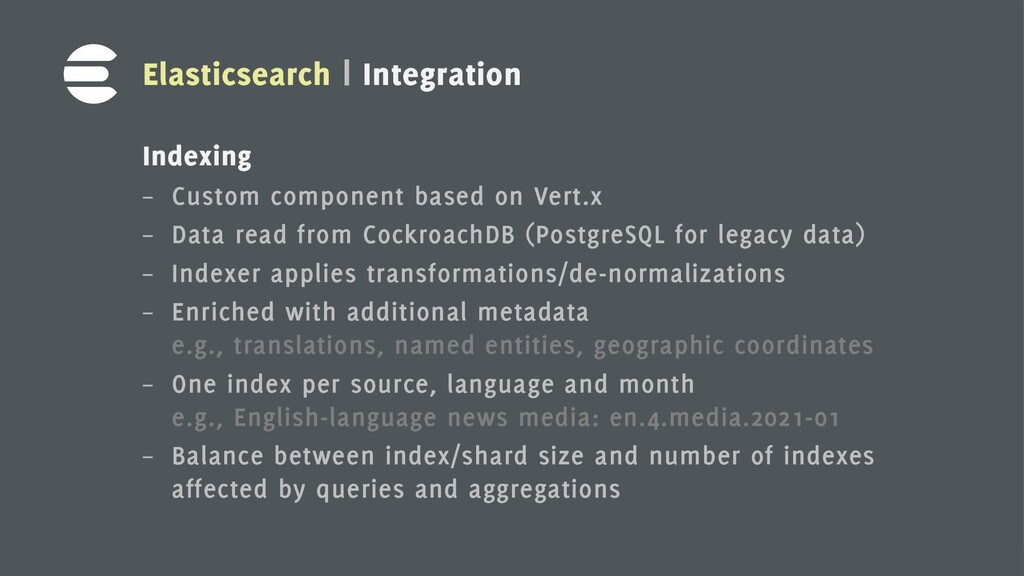
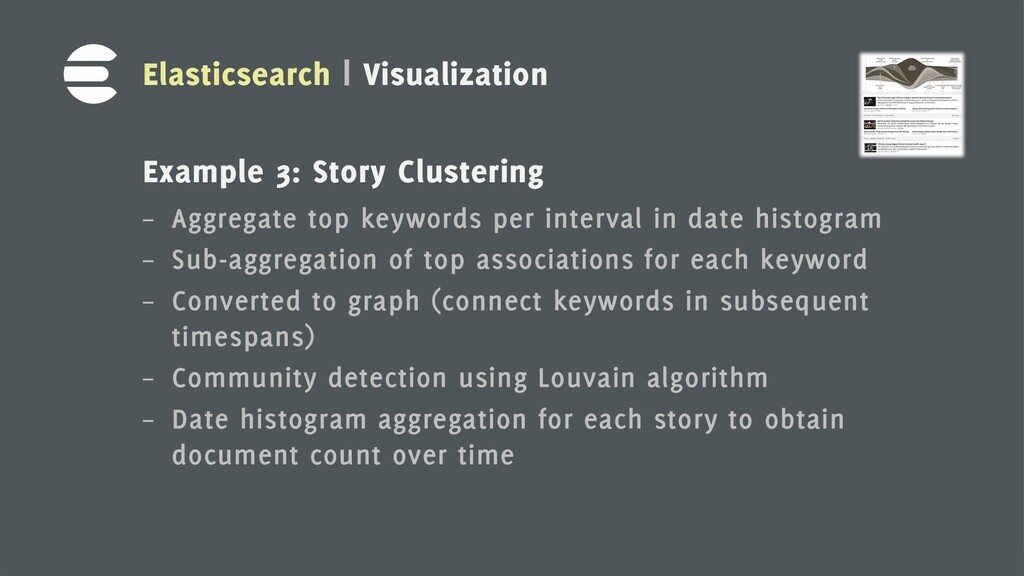
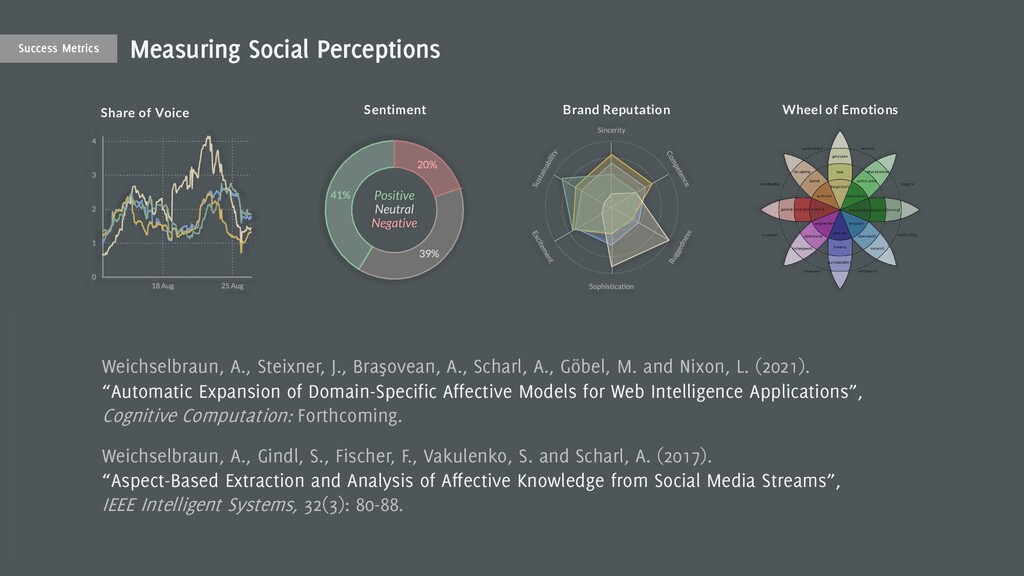
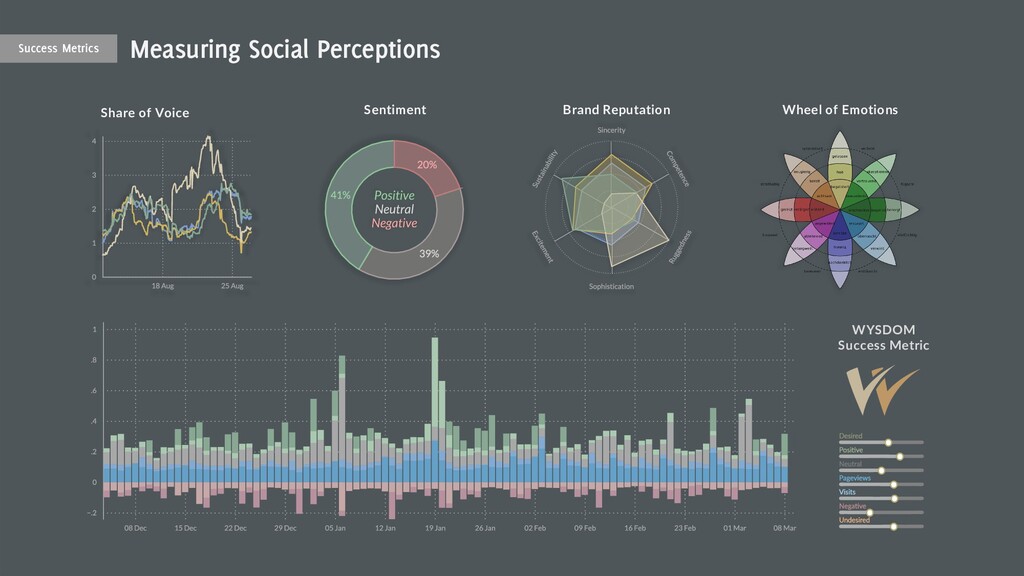
Its Elasticsearch-powered visual analytics dashboard is an advanced information exploration system to automatically identify opinion leaders, and to classify online coverage along multiple metadata dimensions - e.g., by topic or geographic location. The system is continuously updated with live content feeds, reflecting social perceptions and events that impact the coverage.

webLyzard technology
PRO

January 21, 2021
Tweet

More Decks by webLyzard technology

Other Decks in Technology

Transcript

  1. 1
    US Election 2020
    Web Monitor
    us2020.weblyzard.com
    Arno Scharl, Alexander Hubmann-Haidvogel
    webLyzard technology ▪ Modul University Vienna
    www.weblyzard.com/us-election-2020-web-monitor

    View Slide

  2. 2

    View Slide

  3. 3
    Sentiment
    Share of Voice Brand Reputation
    Measuring Social Perceptions
    Success Metrics
    WYSDOM
    Success Metric
    Wheel of Emotions

    View Slide

  4. 4
    2004
    Scharl, A. and Weichselbraun, A. (2008). “An Automated Approach to
    Investigating the Online Media Coverage of US Presidential Elections”,
    Journal of Information Technology & Politics, 5(1): 121-132.

    View Slide

  5. 5
    2008

    View Slide

  6. 6

    View Slide

  7. 7

    View Slide

  8. 8

    View Slide

  9. 9

    View Slide

  10. 10

    View Slide

  11. 11

    View Slide

  12. 12

    View Slide

  13. 13 Elasticsearch | Integration
    History
    - Started with PostgreSQL/Tsearch2
    - Switched to Apache Lucene in 2009
    - Adopted Elasticsearch early 2014
    Current Cluster
    - 5 (soon 7) physical machines – XEON E5, 40 cores, 256GB RAM
    - 3 x 2TB M.2 NVMe Samsung 960 Pro in striped LVM
    - Multiple Elasticsearch nodes per machine
    4 data nodes, separate master nodes,
    one coordinating-only node per machine
    - Docker containers, overlay network, discovery using DNS

    View Slide

  14. 14 Elasticsearch | Integration
    Indexing
    – Custom component based on Vert.x
    – Data read from CockroachDB (PostgreSQL for legacy data)
    – Indexer applies transformations/de-normalizations
    – Enriched with additional metadata
    e.g., translations, named entities, geographic coordinates
    – One index per source, language and month
    e.g., English-language news media: en.4.media.2021-01
    – Balance between index/shard size and number of indexes
    affected by queries and aggregations

    View Slide

  15. 15 Elasticsearch | Visualization
    Example 1: Geographic Map
    – Hashgrid aggregation for extracted locations
    – User-selectable precision
    – Aggregate average document sentiment
    Example 2: Word Tree
    – Inner hits on search query
    – Filtered for sentences matching the query
    – Maintaining document-level sorting

    View Slide

  16. 16 Elasticsearch | Visualization
    Example 3: Story Clustering
    – Aggregate top keywords per interval in date histogram
    – Sub-aggregation of top associations for each keyword
    – Converted to graph (connect keywords in subsequent
    timespans)
    – Community detection using Louvain algorithm
    – Date histogram aggregation for each story to obtain
    document count over time

    View Slide

  17. 17
    Sentiment
    Share of Voice Brand Reputation
    Measuring Social Perceptions
    Success Metrics
    WYSDOM
    Success Metric
    Wheel of Emotions
    Weichselbraun, A., Steixner, J., Braşovean, A., Scharl, A., Göbel, M. and Nixon, L. (2021).
    “Automatic Expansion of Domain-Specific Affective Models for Web Intelligence Applications”,
    Cognitive Computation: Forthcoming.
    Weichselbraun, A., Gindl, S., Fischer, F., Vakulenko, S. and Scharl, A. (2017).
    “Aspect-Based Extraction and Analysis of Affective Knowledge from Social Media Streams”,
    IEEE Intelligent Systems, 32(3): 80-88.

    View Slide

  18. 18
    Sentiment
    Share of Voice Brand Reputation
    WYSDOM
    Success Metric
    Wheel of Emotions
    Measuring Social Perceptions
    Success Metrics

    View Slide

  19. 19
    Innovation R&D Funding – Selected Research Projects

    View Slide

  20. 20 Newsletter
    www.weblyzard.com/newsletter
    Technology Showcases
    www.weblyzard.com/showcases
    E-Mail
    [email protected]
    @
    SlideShare
    slideshare.com/weblyzard
    SpeakerDeck
    speakerdeck.com/weblyzard
    YouTube
    youtube.com/+weblyzard
    Twitter
    @weblyzard
    Facebook
    facebook.com/weblyzard
    LinkedIn
    www.linkedin.com/company/
    weblyzard-technology

    View Slide