Upgrade to Pro — share decks privately, control downloads, hide ads and more …

Breaking Fitts's Law

Breaking Fitts's Law

Abhishek Nandakumar

December 11, 2012
Tweet

More Decks by Abhishek Nandakumar

Other Decks in Research

Transcript

  1. Breaking Fitts’s Law

    View Slide

  2. Is it faster to click on
    targets at the edge of
    the screen?

    View Slide

  3. 1680 x 1080

    View Slide

  4. View Slide

  5. View Slide

  6. Bounding line simulates edge of screen

    View Slide

  7. Bounding line simulates edge of screen

    View Slide

  8. View Slide

  9. View Slide

  10. View Slide

  11. View Slide

  12. Theoretical Underpinnings:
    Targets at the edge of the screen
    effectively have infinite width

    View Slide

  13. W = ∞

    View Slide

  14. W

    View Slide

  15. Are movement times lower while
    selecting targets at the edge of the screen
    than predicted by Fitts’ law?
    Objectified Question

    View Slide

  16. Does the magnitude of effect vary based
    on target size?
    Additional Questions

    View Slide

  17. Bounded mouse movements will be
    faster than Fitts’ Law would predict.
    Hypothesis 1

    View Slide

  18. Bounded mouse movements will be
    faster than identical unbounded
    movements.
    Hypothesis 2

    View Slide

  19. Simulate the edge of the screen with a
    ‘bounding box.’
    Participants perform an identical set of
    pointing tasks with a bounding box and
    without one.
    Design

    View Slide

  20. Addressing Potential Confounds
    Screen Resolution Consistent at 1680x1080
    Subject Distance from Screen Same chair height and distance from monitor
    Type of Mouse Use of identical Dell optical mouse
    Use of Trackpad Mandated use of Trackpad
    Order of Trials Randomized trials to eliminate order effects
    Device LCD with identical calibration and constrast
    Starting Position Always in the center of the screen

    View Slide

  21. Methodology
    1680x1080 Resolution
    22” Display
    2 Foot distance from Display
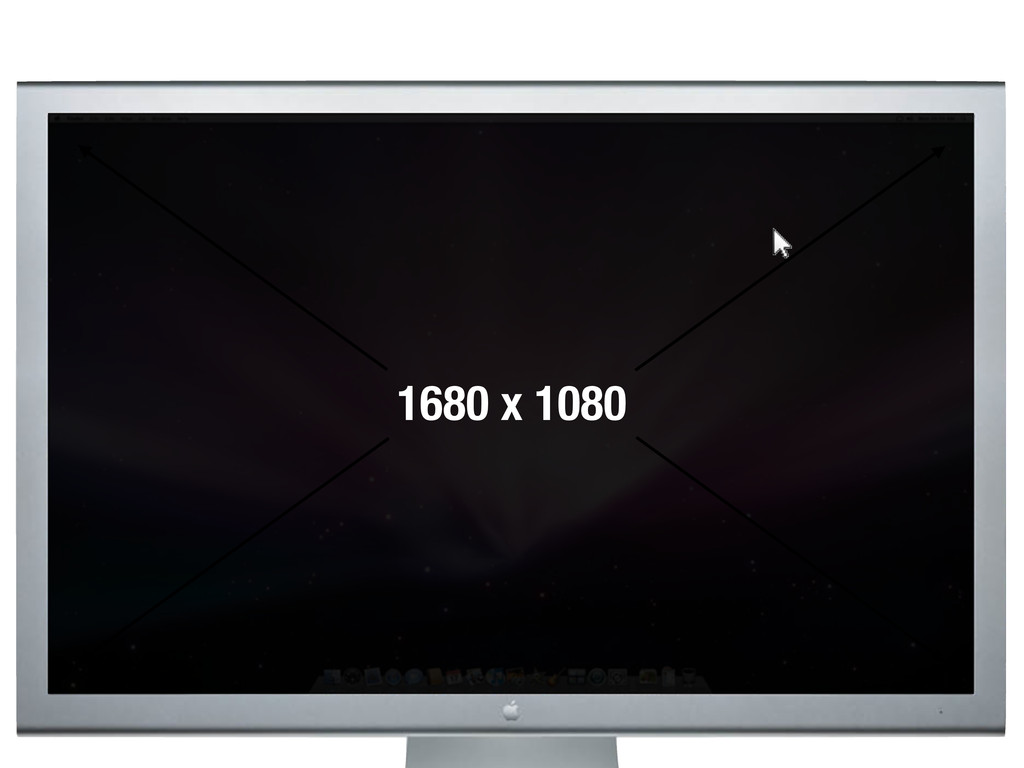
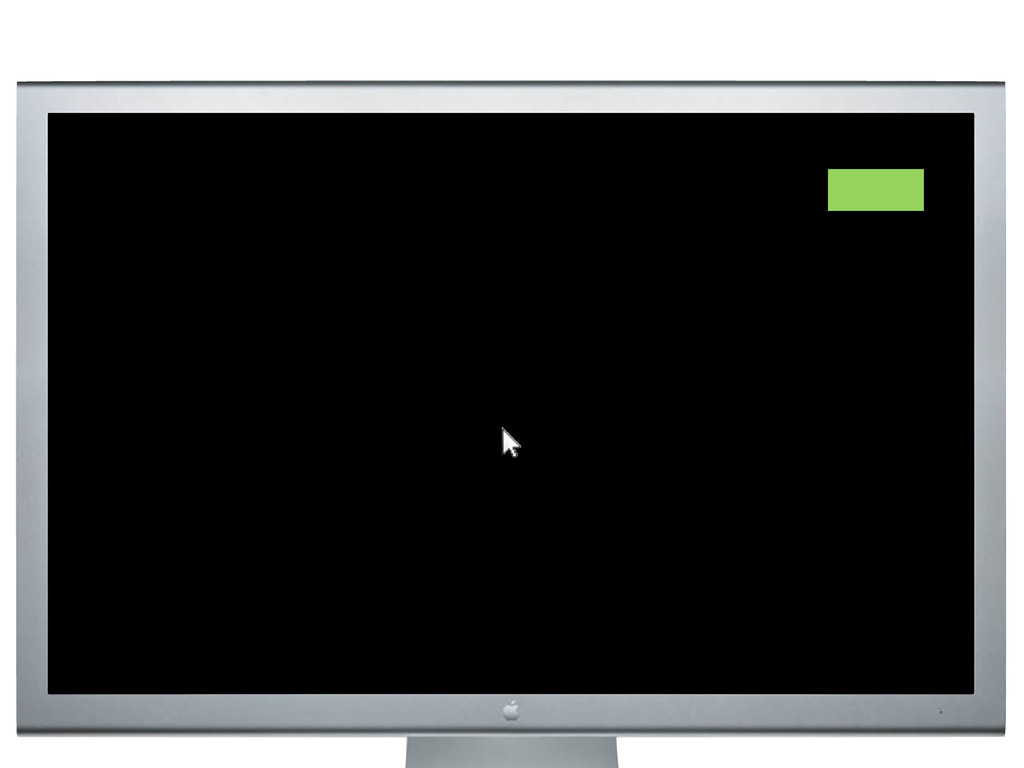
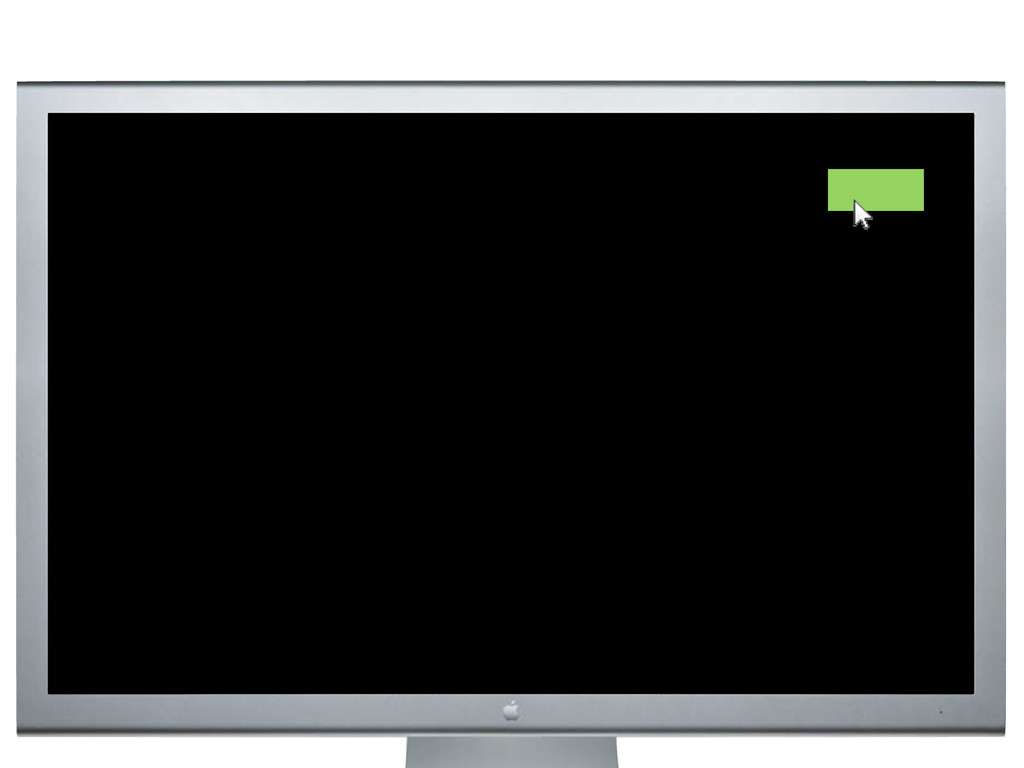
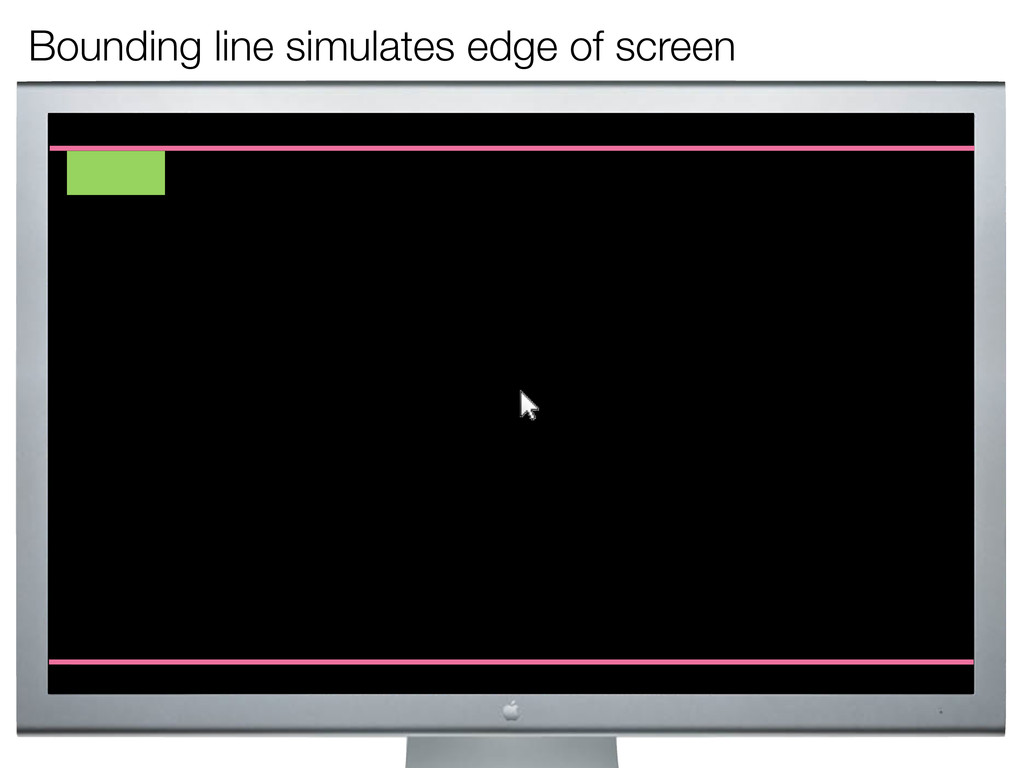
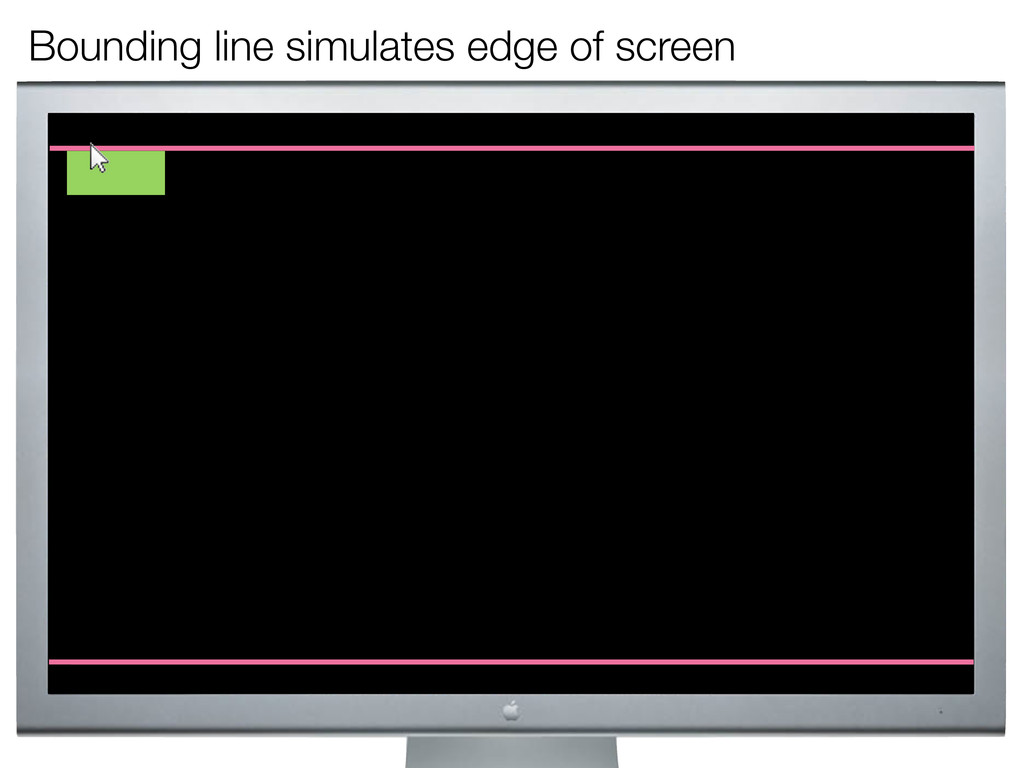
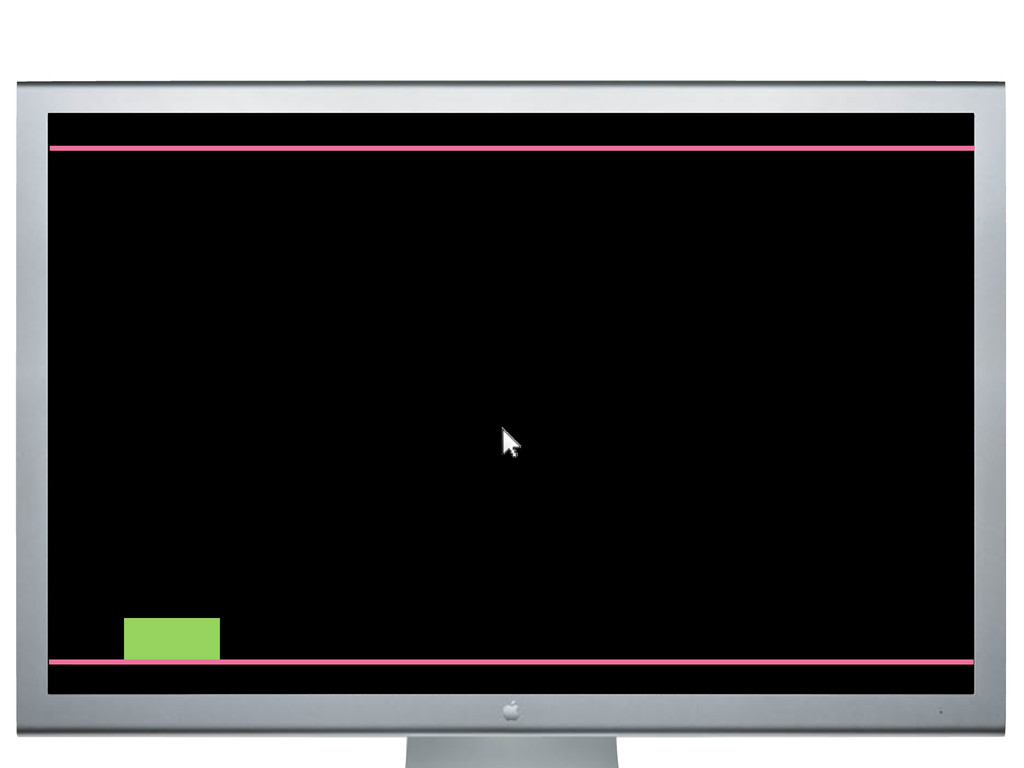
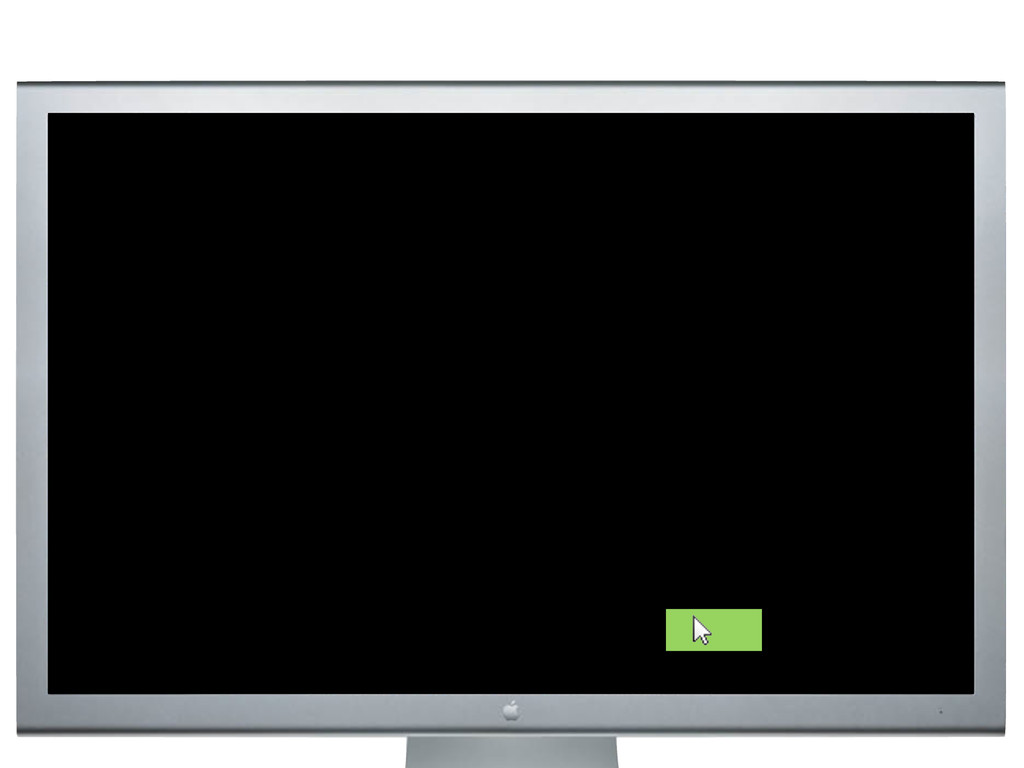
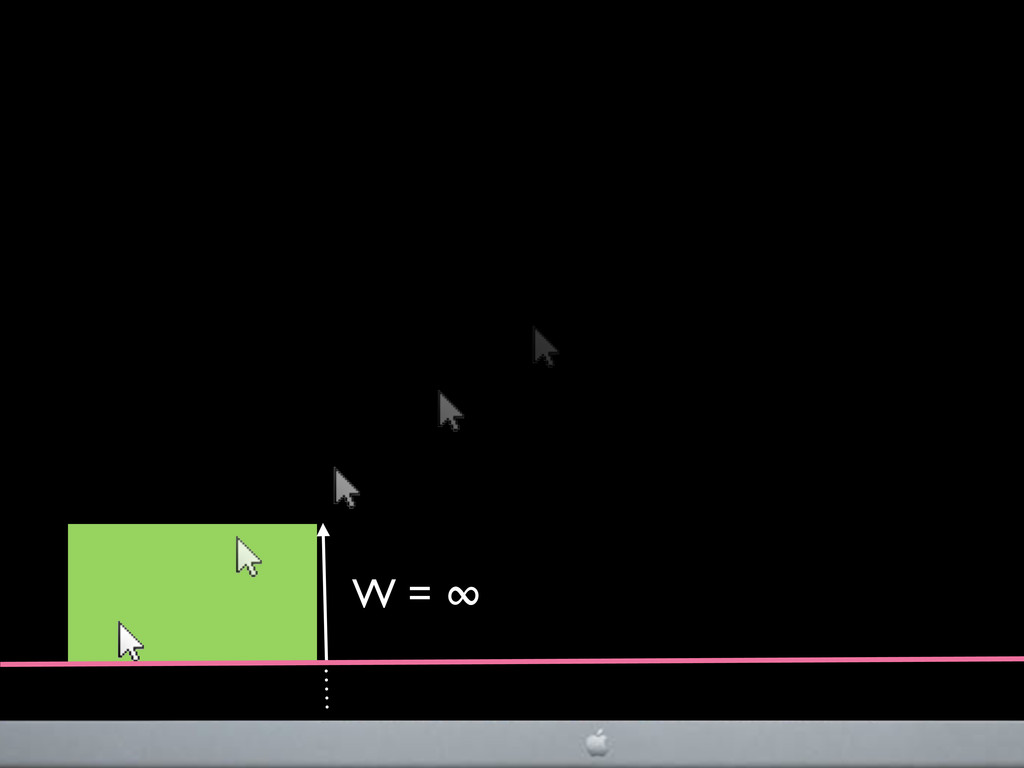
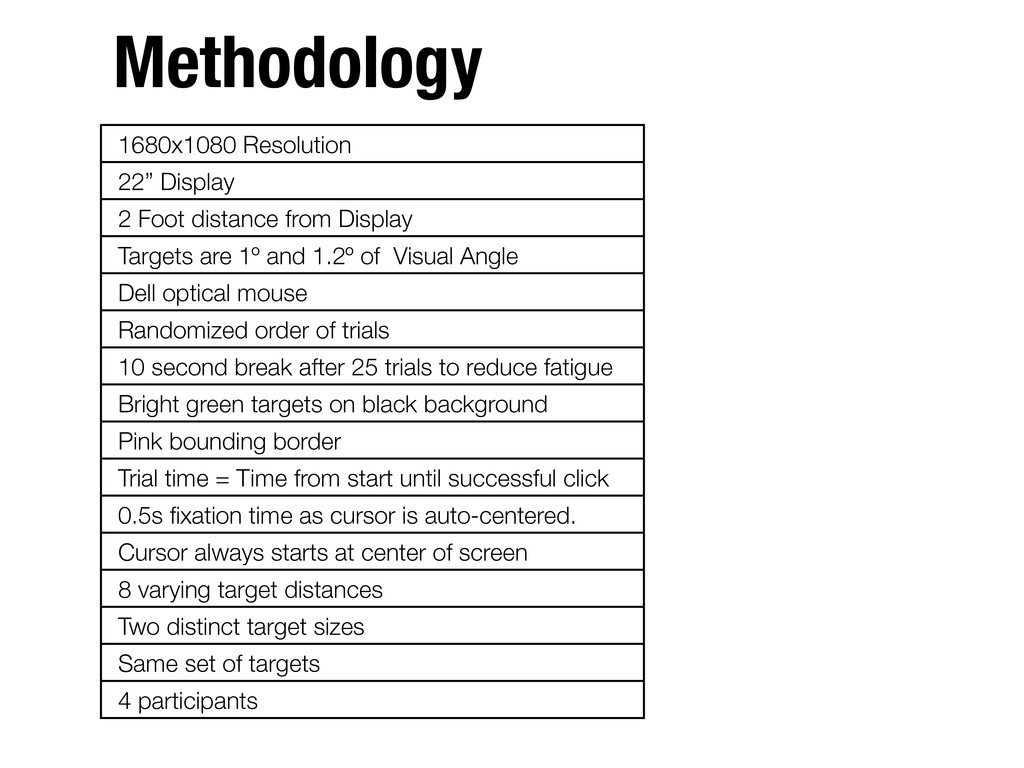
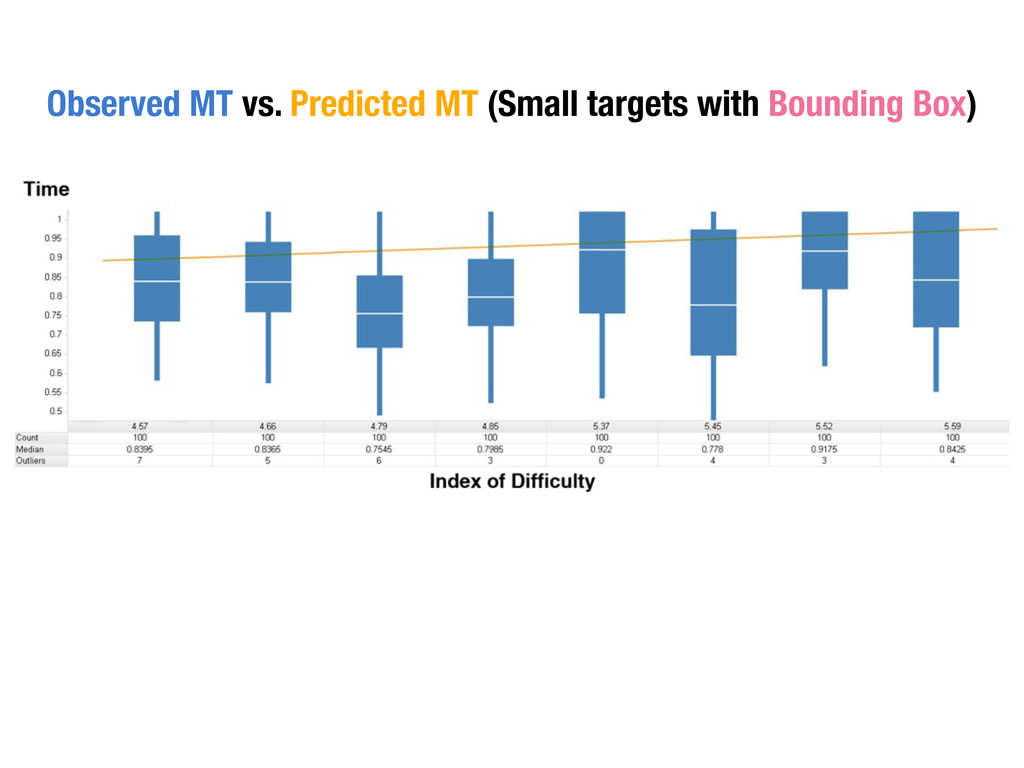
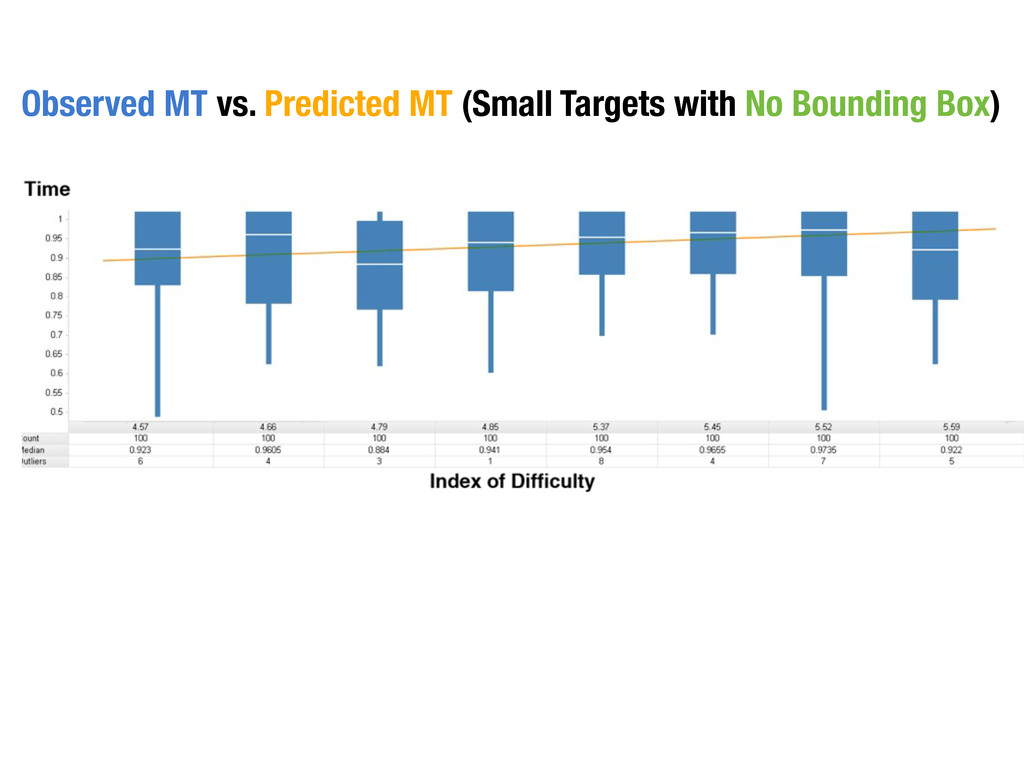
    Targets are 1º and 1.2º of Visual Angle
    Dell optical mouse
    Randomized order of trials
    10 second break after 25 trials to reduce fatigue
    Bright green targets on black background
    Pink bounding border
    Trial time = Time from start until successful click
    0.5s fixation time as cursor is auto-centered.
    Cursor always starts at center of screen
    8 varying target distances
    Two distinct target sizes
    Same set of targets
    4 participants

    View Slide

  22. We used the Least-of method of determining target with
    in two-dimensions, which MacKenzie and Buxton (1992)
    found to be comparable to the W’ Model (actual target
    depth along the approach vector).

    View Slide

  23. t=-5.7272
    p<0.05
    t=0.1196
    p=0.9
    t=-7.8984
    p<0.05
    Condition
    Average (Observed MT)
    Average Observed MT vs. Condition

    View Slide

  24. Correlation
    No Bounding Box Bounding Box
    0.9
    0.7
    0.5
    0.3
    0.1

    View Slide

  25. Differences of Observed Time and Predicted Time

    View Slide

  26. Data
    Observed MT vs. Predicted MT (Large targets with Bounding Box)

    View Slide

  27. Data
    Observed MT vs. Predicted MT (Large Targets with No Bounding Box)

    View Slide

  28. Data
    Observed MT vs. Predicted MT (Small targets with Bounding Box)

    View Slide

  29. Data
    Observed MT vs. Predicted MT (Small Targets with No Bounding Box)

    View Slide

  30. Independent Variables:
    Presence of Bounding Line
    Size of Target
    Dependent Variable:
    Observed Movement Time

    View Slide

  31. ★ Perform test on tablet with physical bounding
    boxes
    ★ Test sizes between 20px and 100px to find out
    when size becomes insignificant.
    ★ Test for External Validity
    ★ Compare differences in accessibility of tabs
    between browsers:
    ★ Chrome on Windows and Mac OS X
    ★ Chrome and Firefox
    Next Steps

    View Slide