Upgrade to Pro — share decks privately, control downloads, hide ads and more …

Early Observations of Type Ia Supernovae by ZTF

Yuhan Yao
March 29, 2019

Early Observations of Type Ia Supernovae by ZTF

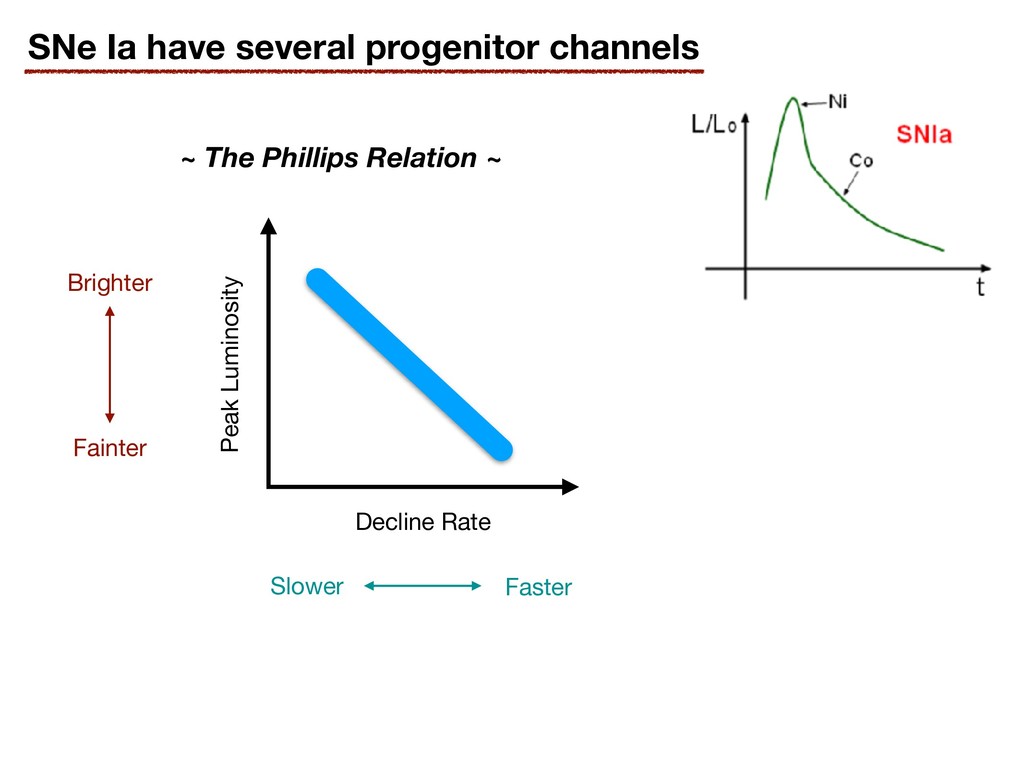
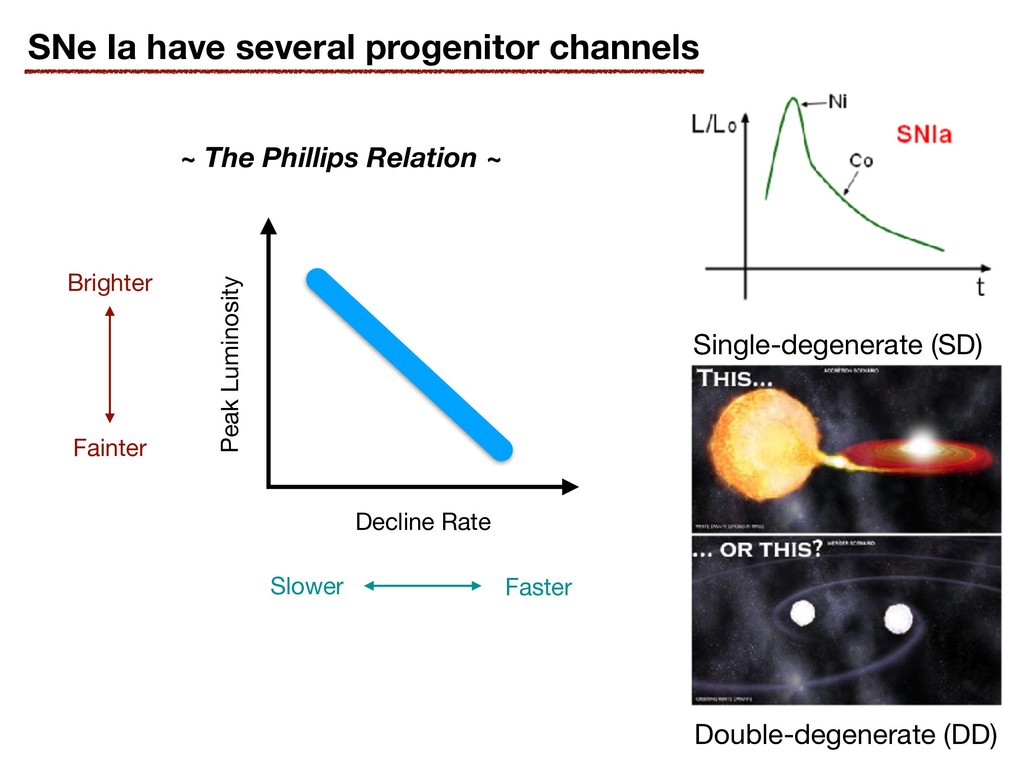
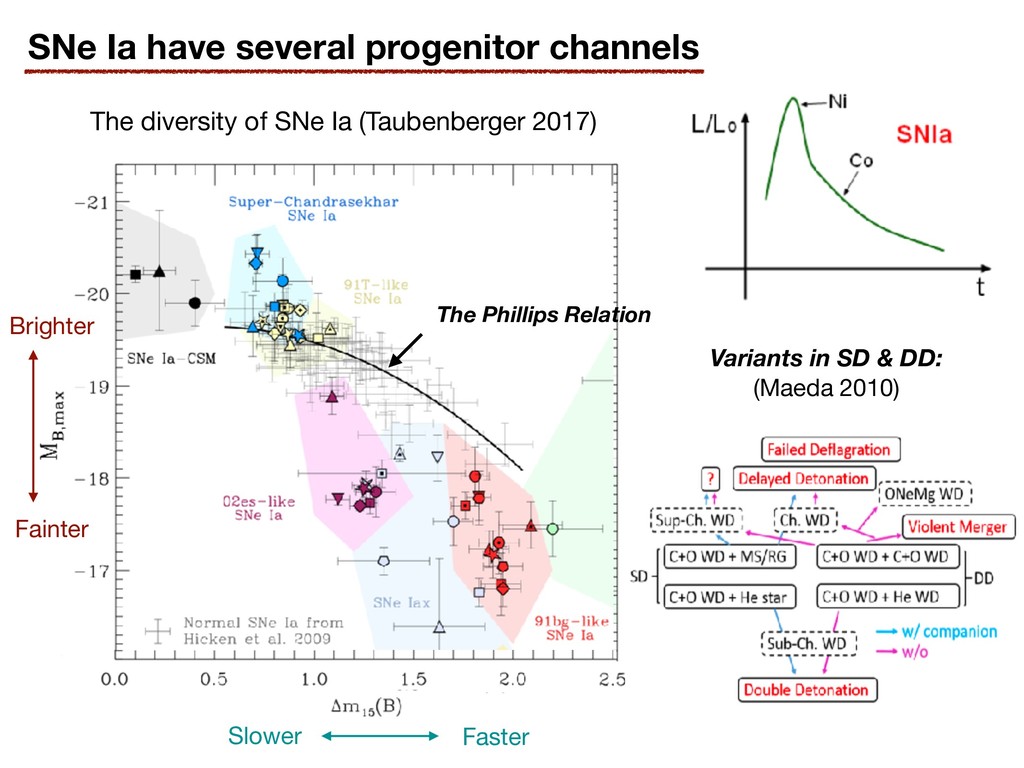
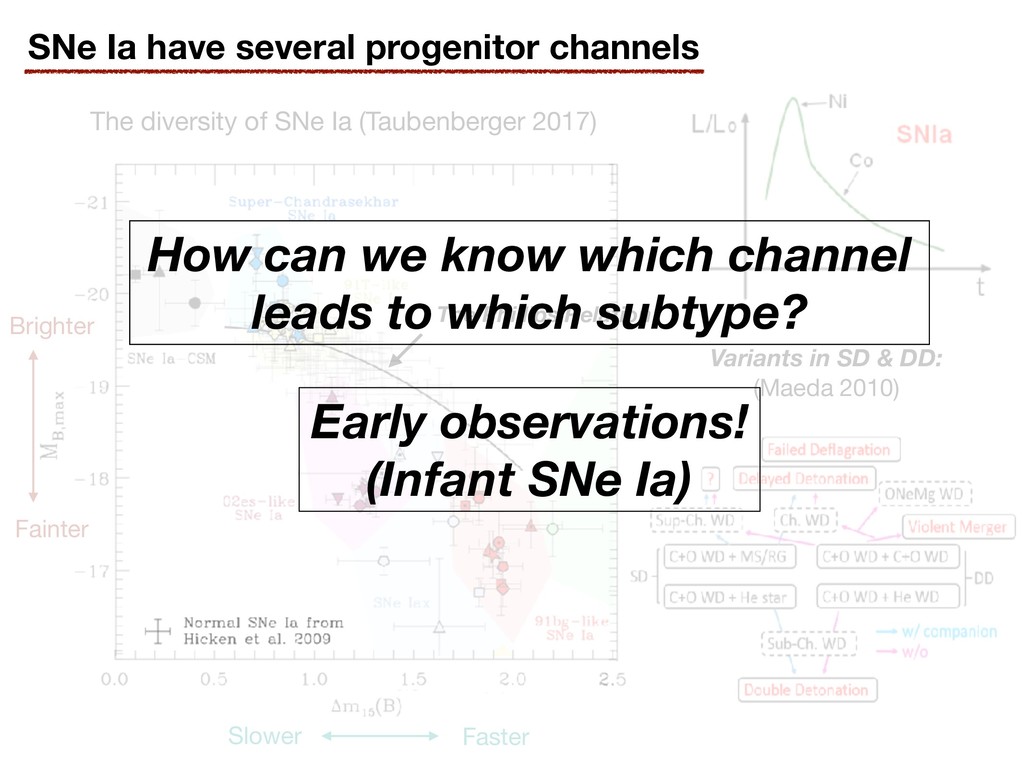
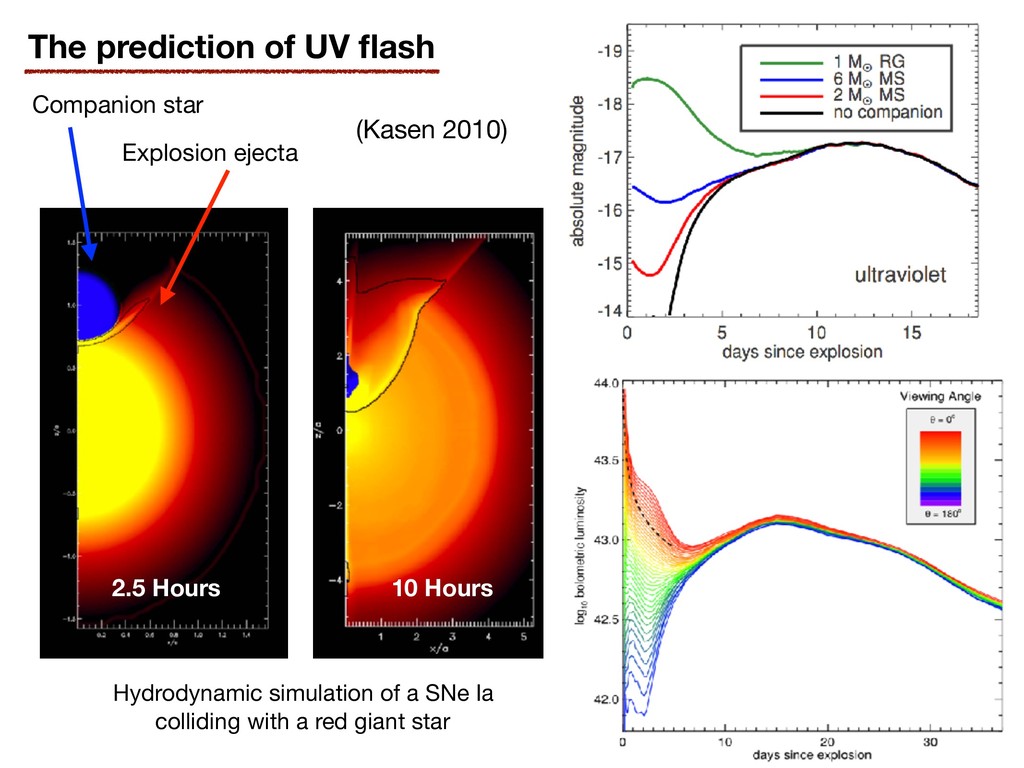
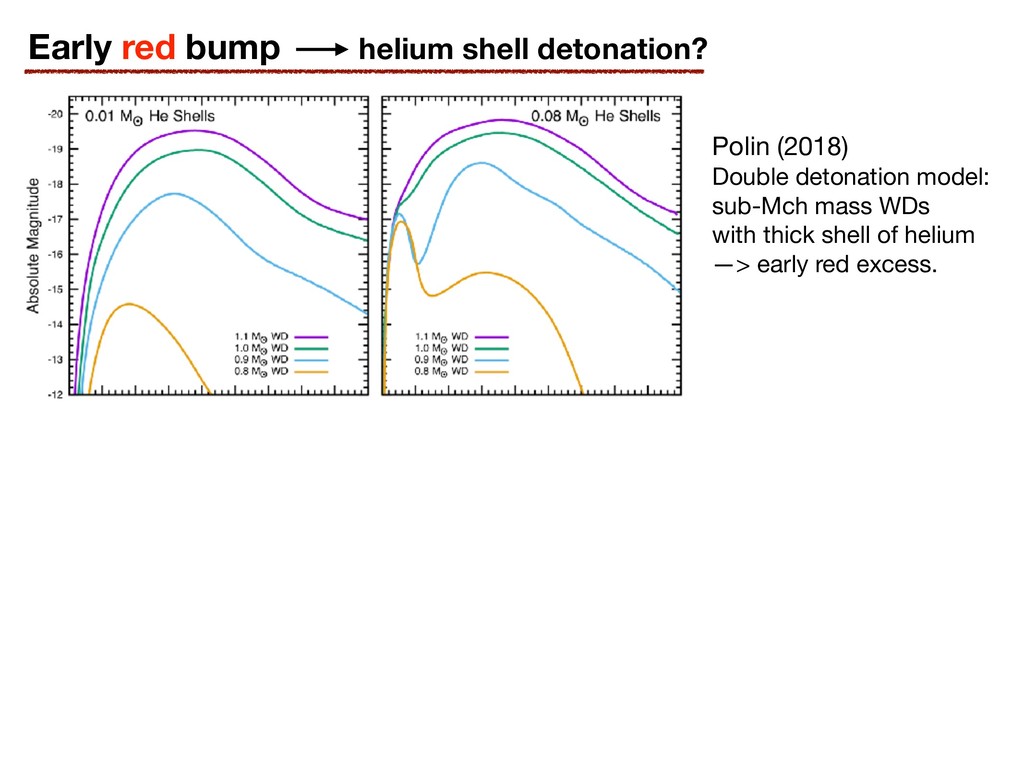
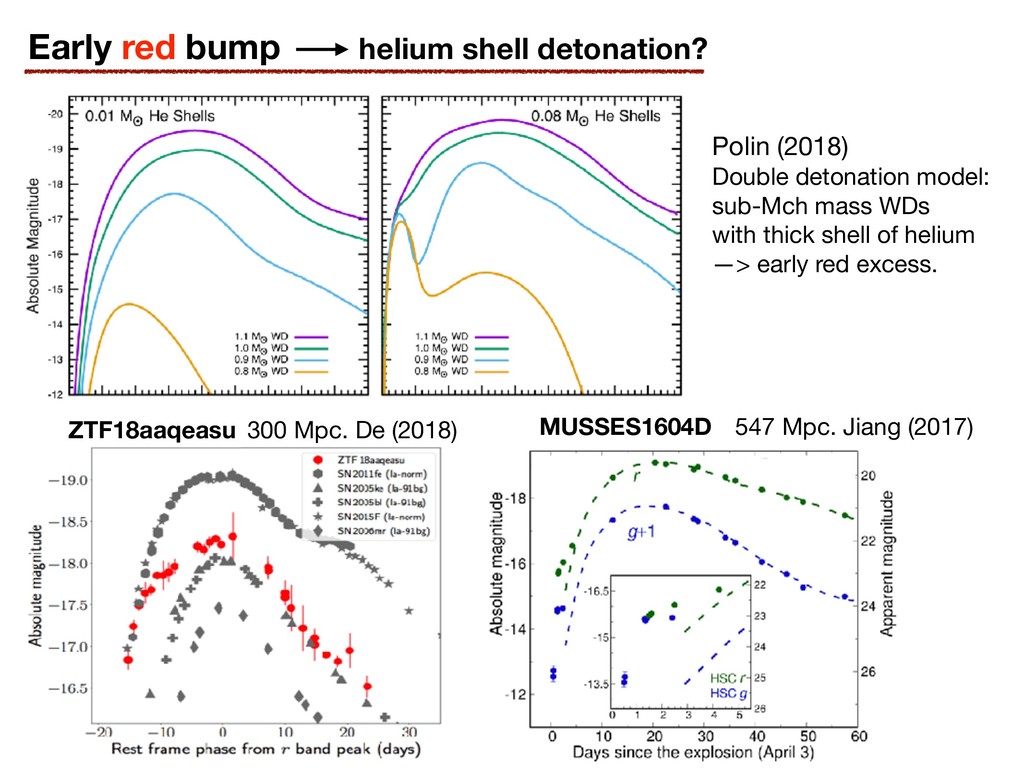
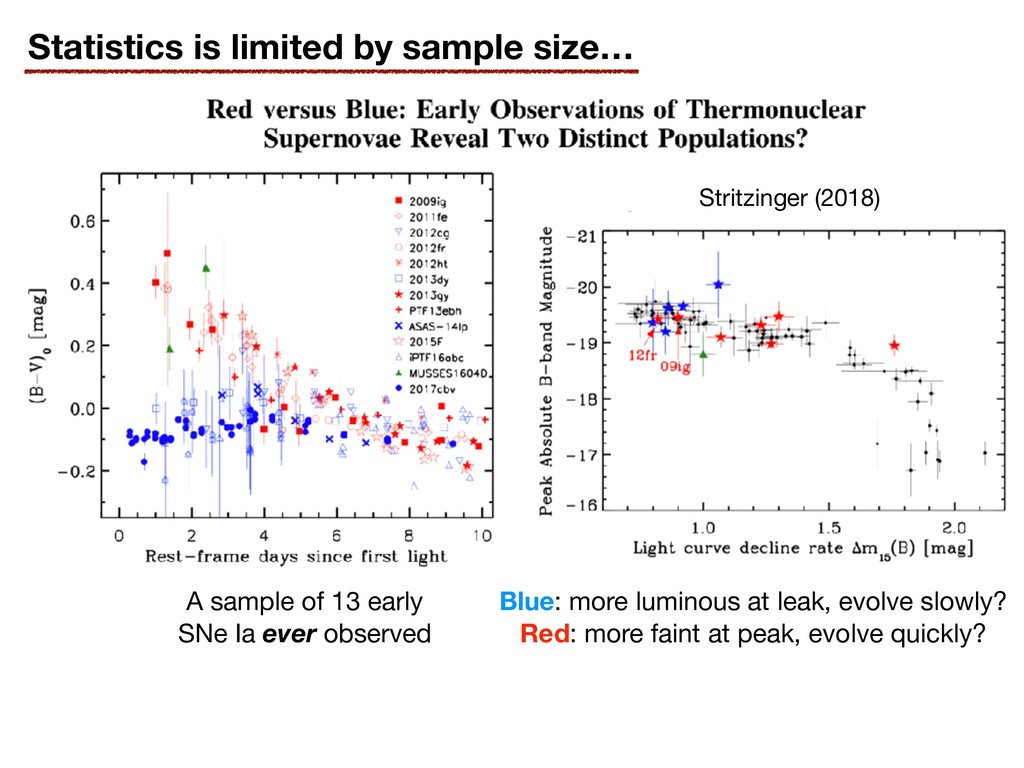
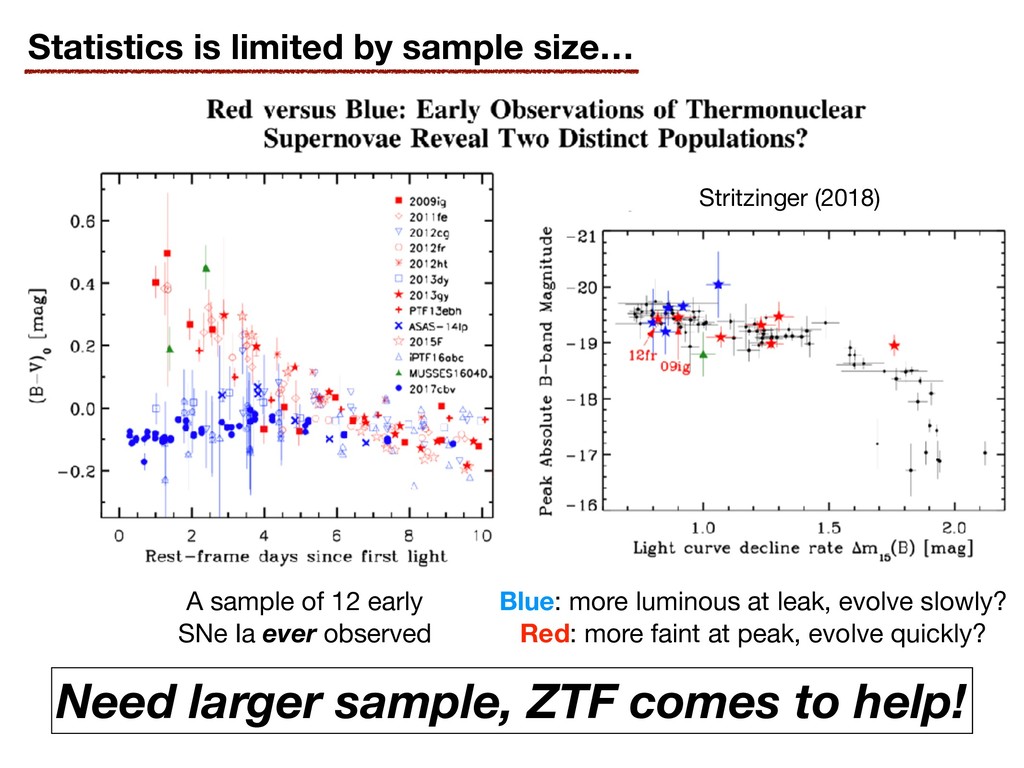
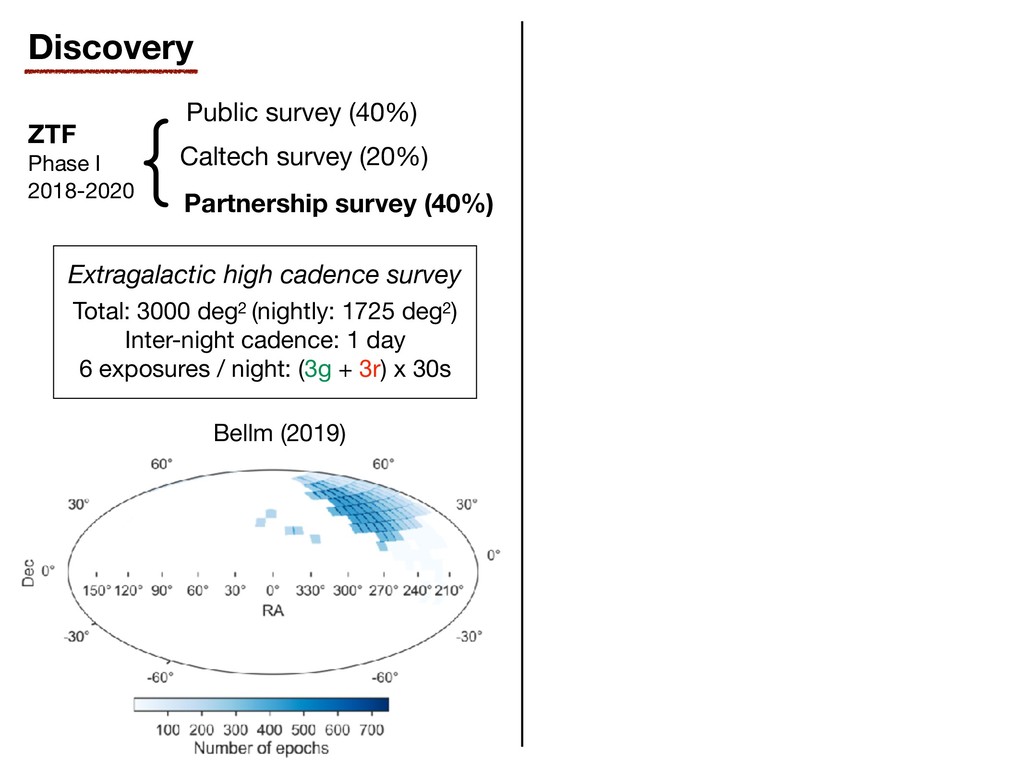
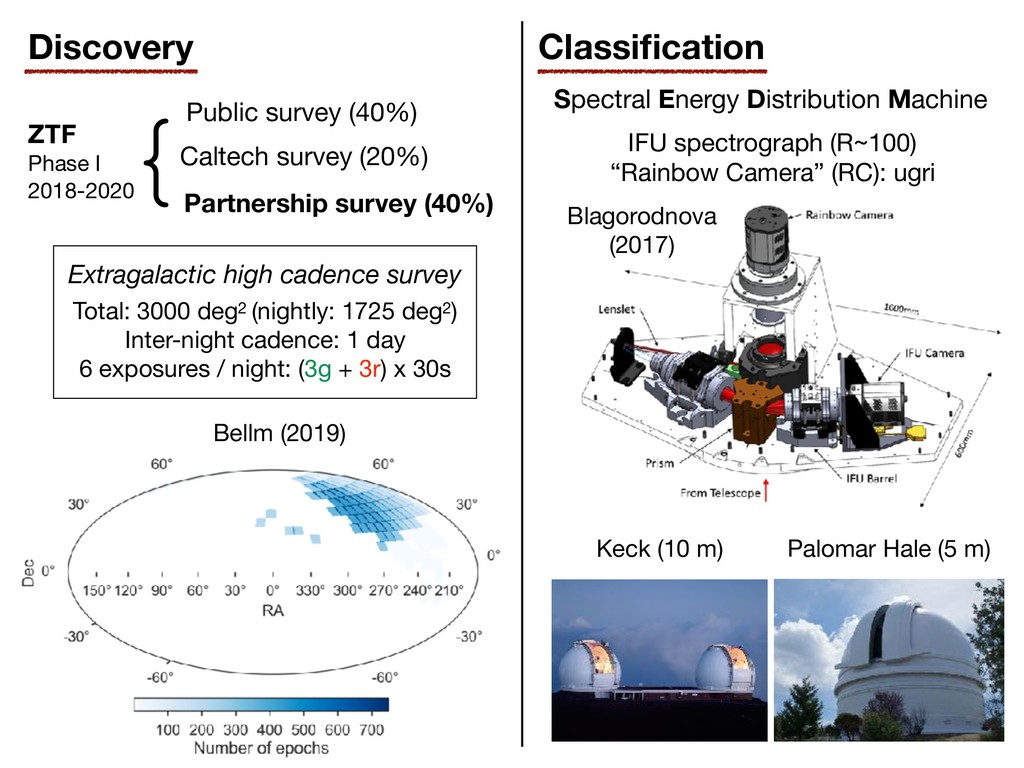
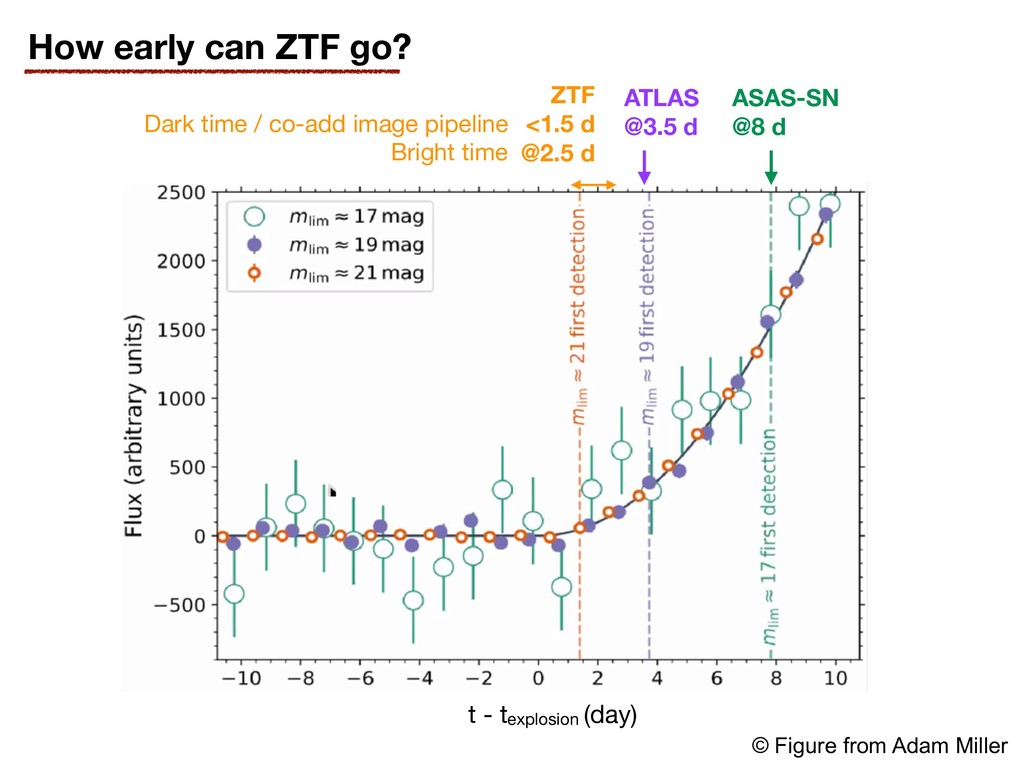
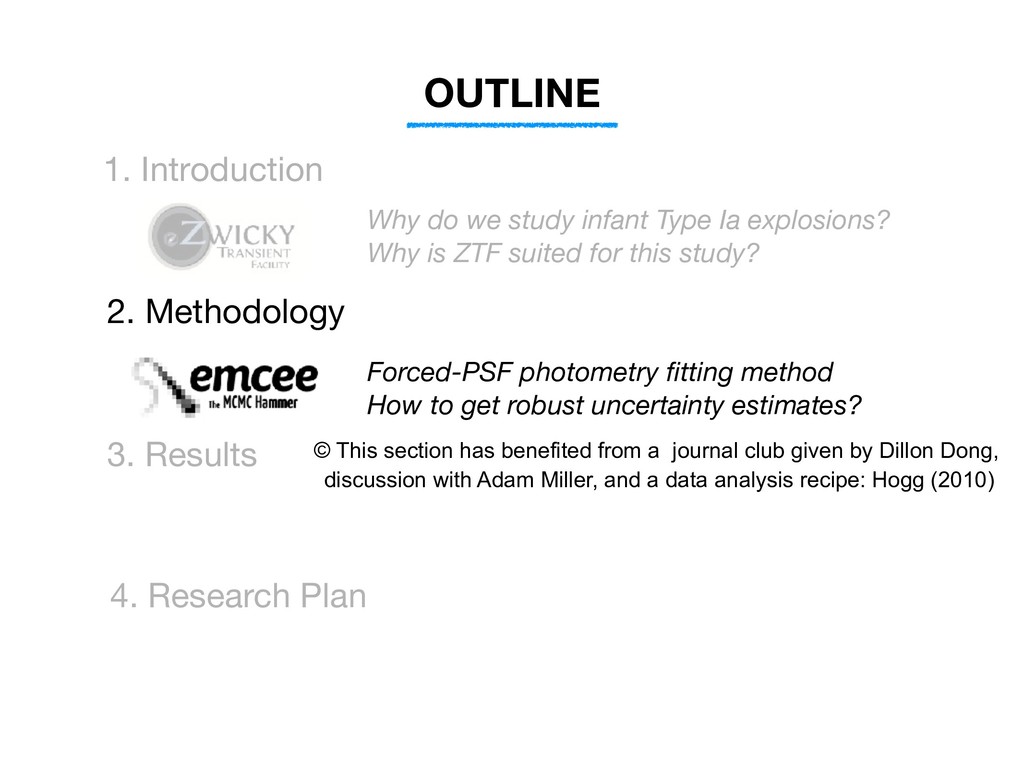
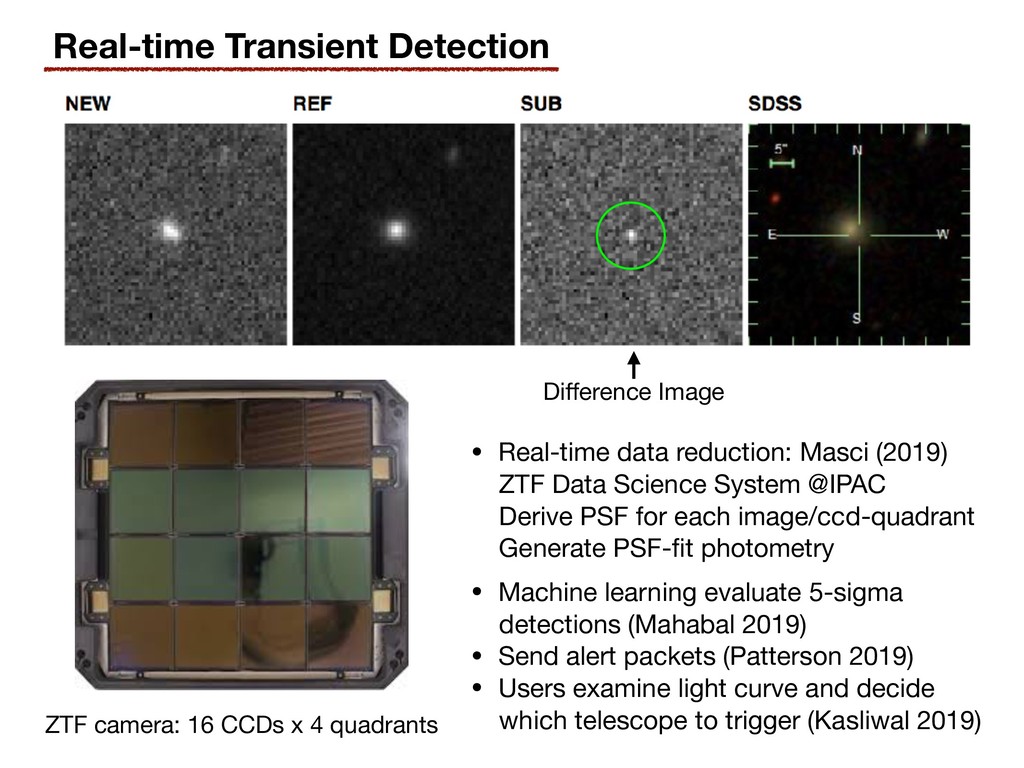
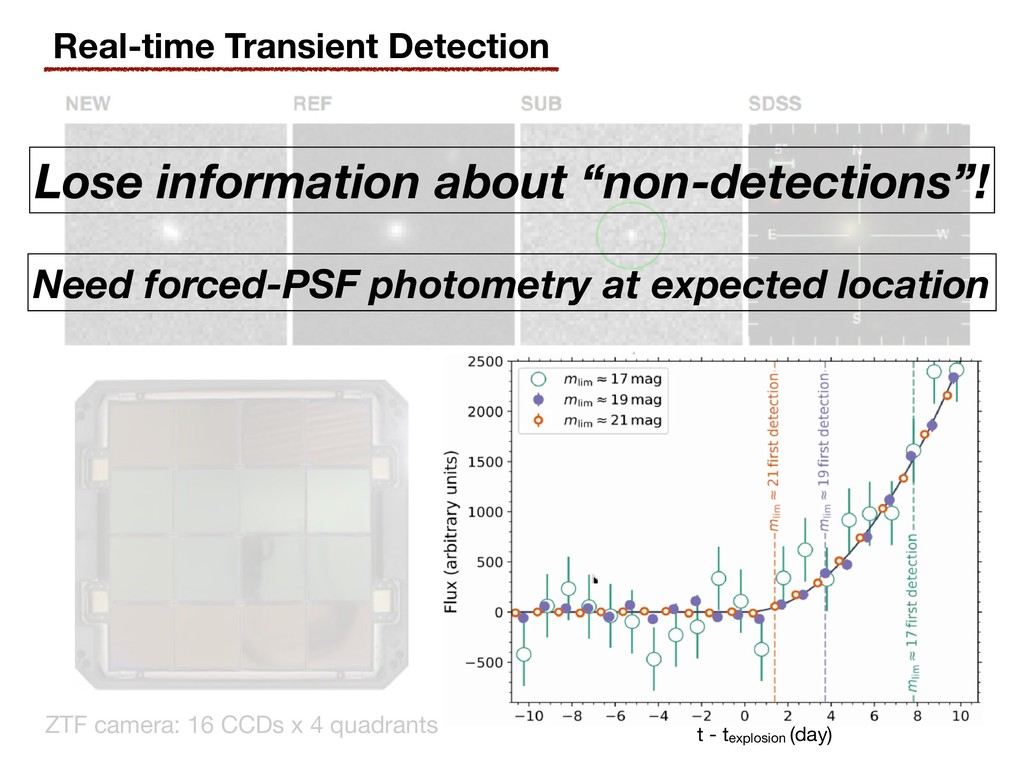
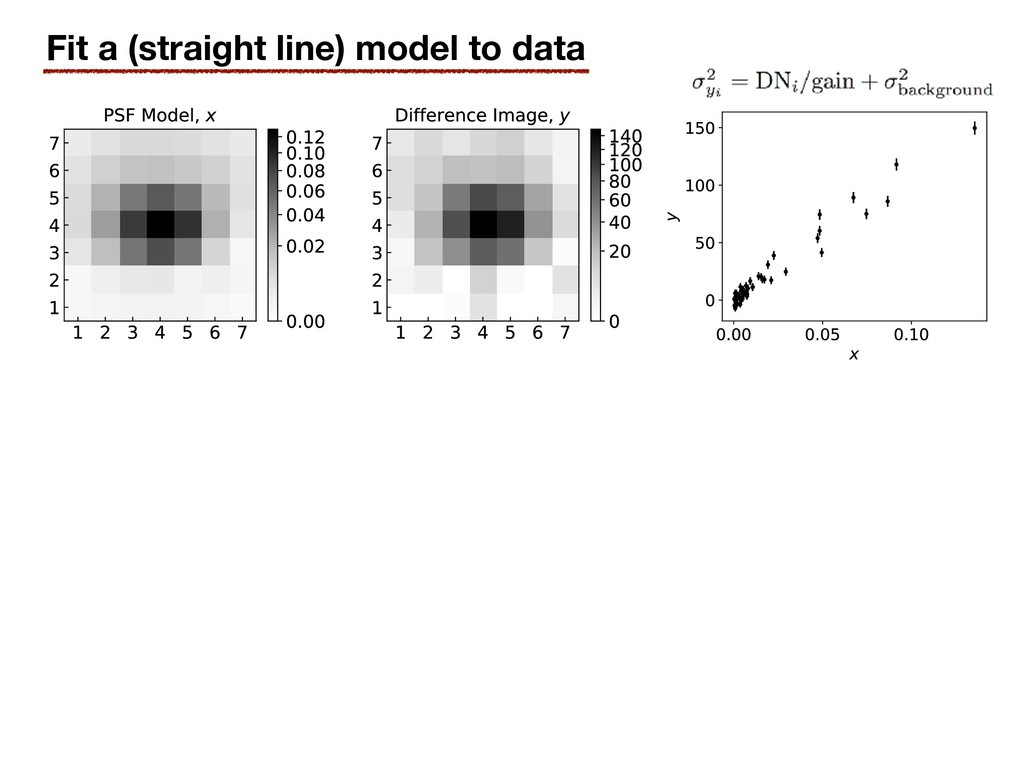
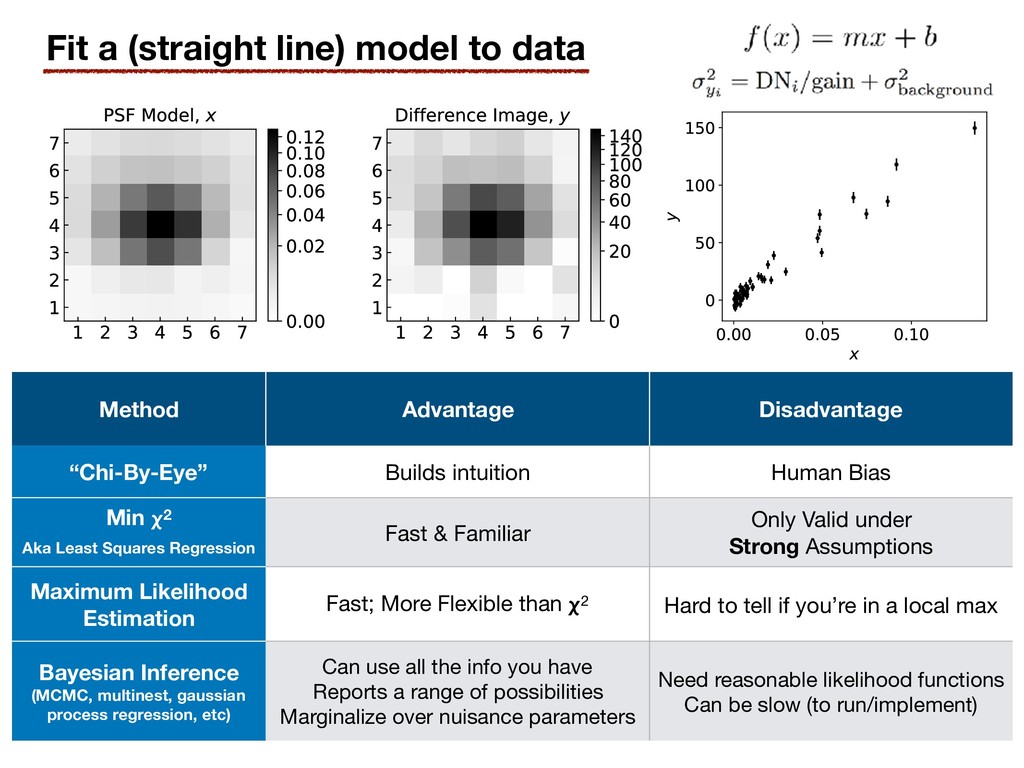
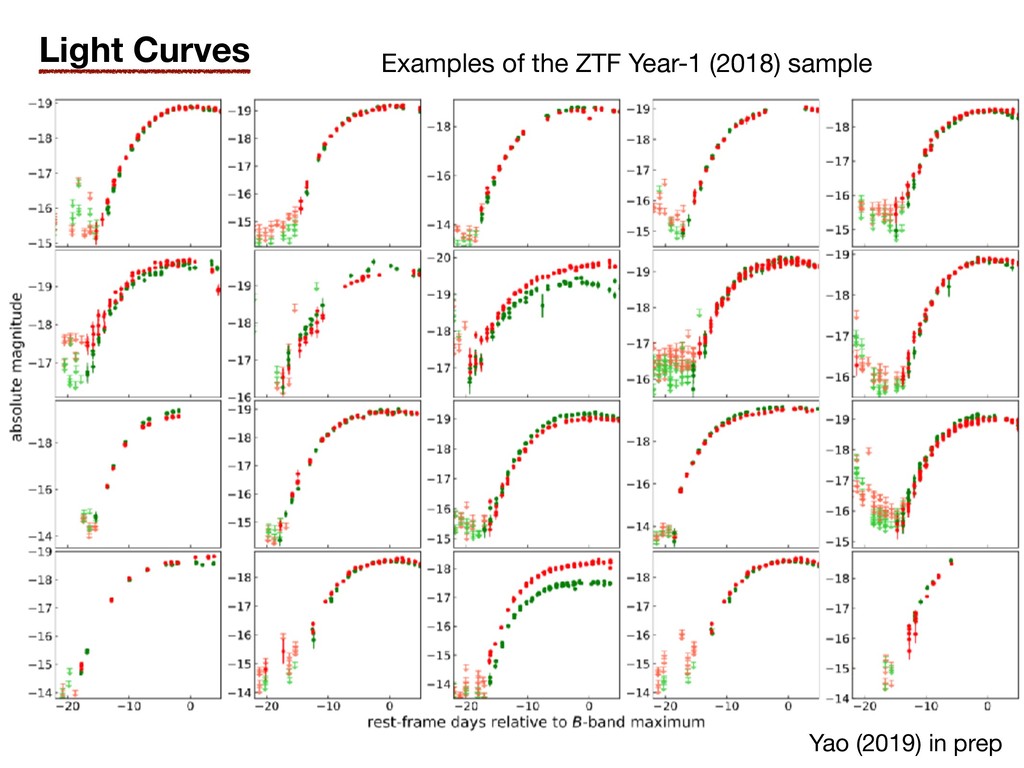
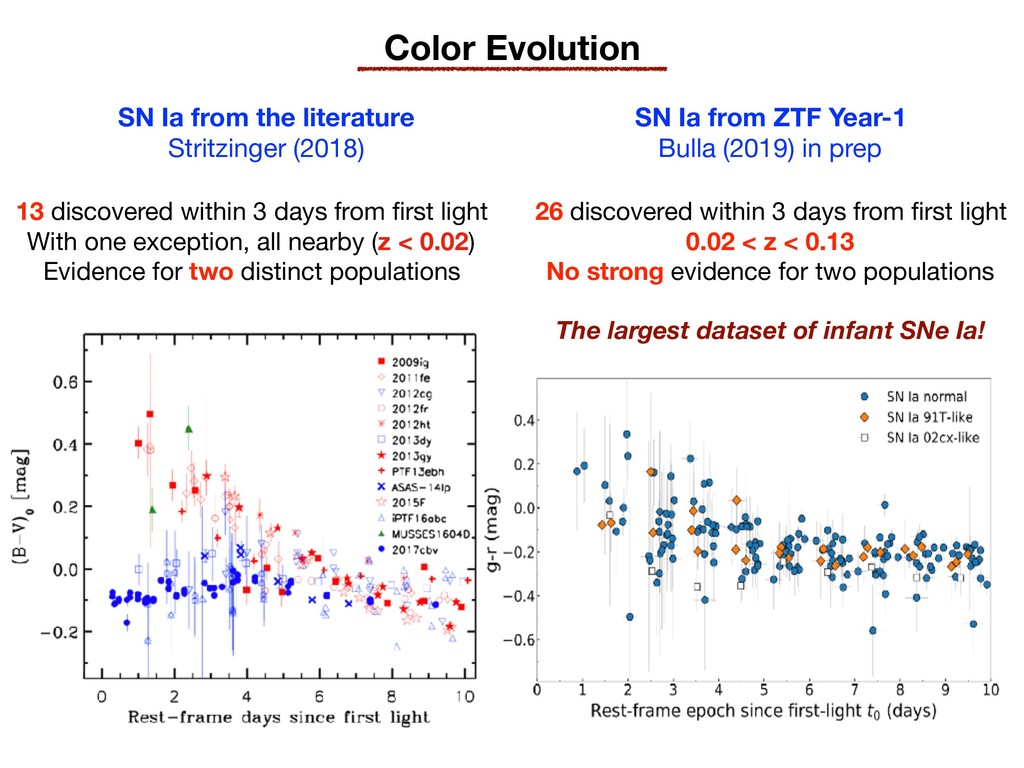
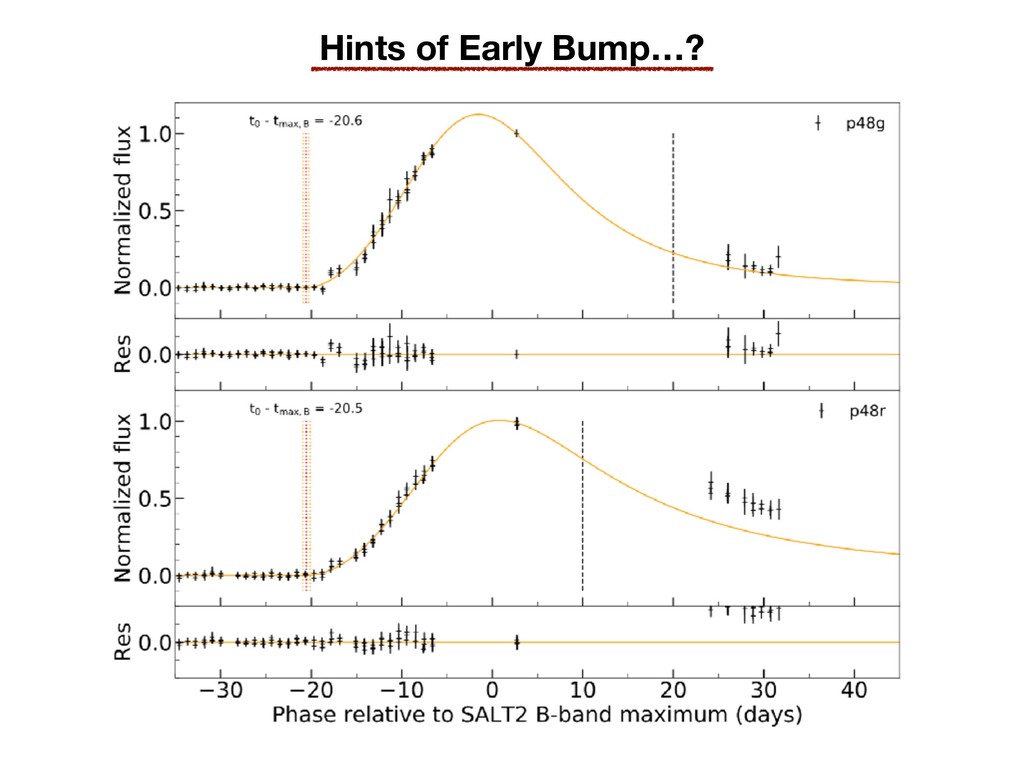
Observations of Type Ia supernovae (SNe Ia) in a few hours and days after explosion play an important role in addressing the long-standing issues about the explosion mechanisms of SNe Ia. Discoveries of early-phase blue excess favor the single degenerate channel; while early red colors are evidences of the double detonation scenario. In this talk, I will review recent progress in this field and demonstrate how the Zwicky Transient Facility (ZTF) can extend the single-object analyses to a large sample of infant SNe Ia. I will also introduce the methodology to perform forced-PSF photometry to generate high-quality light curves, which is essential to constrain the first-light epoch. I will end by summarizing what we have learned from the ZTF Year-1 sample and how the results help to refine our Year-2 observational strategies.

Yuhan Yao

March 29, 2019
Tweet

More Decks by Yuhan Yao

Other Decks in Research

Transcript

  1. The 48-inch (1.2 meter) Telescope image credit Palomar/Caltech Early observations

    of Type Ia Supenovae by the Zwicky Transient Facility (ZTF) Yuhan Yao (姚⾬雨含) Caltech Astronomy The 48-inch (1.2 meter) Telescope image credit Palomar/Caltech THCA Informal Talk March 29 2019
  2. OUTLINE 1. Introduction 2. Methodology 3. Results 4. Research Plan

    Why do we study infant Type Ia explosions? Why is ZTF suited for this study?
  3. SNe Ia have several progenitor channels Peak Luminosity Decline Rate

    Brighter Fainter Faster Slower ~ The Phillips Relation ~
  4. SNe Ia have several progenitor channels Single-degenerate (SD) Double-degenerate (DD)

    Peak Luminosity Decline Rate Brighter Fainter Faster Slower ~ The Phillips Relation ~
  5. SNe Ia have several progenitor channels The diversity of SNe

    Ia (Taubenberger 2017) The Phillips Relation Brighter Fainter Faster Slower Variants in SD & DD: (Maeda 2010)
  6. SNe Ia have several progenitor channels The diversity of SNe

    Ia (Taubenberger 2017) The Phillips Relation Brighter Fainter Faster Slower Variants in SD & DD: (Maeda 2010) How can we know which channel leads to which subtype? Early observations! (Infant SNe Ia)
  7. The prediction of UV flash Companion star Explosion ejecta Hydrodynamic

    simulation of a SNe Ia colliding with a red giant star 2.5 Hours 10 Hours (Kasen 2010)
  8. Cao (2015) The detection of UV flash Wait…. But iPTFatg

    is a peculiar SN Ia. Red circles: Grey circles: other SNe Ia Dashed lines: companion interaction models
  9. The detection of UV flash Wait…. But iPTFatg is a

    peculiar SN Ia (2002es-like) Cao (2015)
  10. Early blue bump interaction with companion/CSM? 16.9 Mpc, Hosseinzadeh (2017)

    SN 2017cbv The Kepler SNe. 52.7Mpc. Dimitriadis (2018) SN 2018oh SN 2012cg 15.2 Mpc. Marion (2016)
  11. Early blue bump interaction with companion/CSM? The Kepler SNe. 52.7Mpc.

    Dimitriadis (2018) SN 2018oh 16.9 Mpc. Hosseinzadeh (2017) SN 2017cbv SN 2012cg 15.2 Mpc. Marion (2016) Need observations as early as -17 d to evaluate the early color excess.
  12. Early red bump helium shell detonation? Polin (2018) Double detonation

    model: sub-Mch mass WDs with thick shell of helium —> early red excess.
  13. Early red bump helium shell detonation? 300 Mpc. De (2018)

    Polin (2018) Double detonation model: sub-Mch mass WDs with thick shell of helium —> early red excess. ZTF18aaqeasu MUSSES1604D 547 Mpc. Jiang (2017)
  14. Blue: more luminous at leak, evolve slowly? Red: more faint

    at peak, evolve quickly? A sample of 13 early SNe Ia ever observed Stritzinger (2018) Statistics is limited by sample size…
  15. Blue: more luminous at leak, evolve slowly? Red: more faint

    at peak, evolve quickly? A sample of 12 early SNe Ia ever observed Stritzinger (2018) Statistics is limited by sample size… Need larger sample, ZTF comes to help!
  16. { ZTF Phase I 2018-2020 Public survey (40%) Caltech survey

    (20%) Partnership survey (40%) Bellm (2019) Extragalactic high cadence survey Total: 3000 deg2 (nightly: 1725 deg2) Inter-night cadence: 1 day 6 exposures / night: (3g + 3r) x 30s Discovery
  17. Bellm (2019) Extragalactic high cadence survey Total: 3000 deg2 (nightly:

    1725 deg2) Inter-night cadence: 1 day 6 exposures / night: (3g + 3r) x 30s Discovery Blagorodnova (2017) Spectral Energy Distribution Machine IFU spectrograph (R~100) “Rainbow Camera” (RC): ugri Classification Keck (10 m) Palomar Hale (5 m) { ZTF Phase I 2018-2020 Public survey (40%) Caltech survey (20%) Partnership survey (40%)
  18. t - texplosion (day) How early can ZTF go? ASAS-SN

    @8 d ATLAS @3.5 d ZTF <1.5 d @2.5 d Dark time / co-add image pipeline Bright time © Figure from Adam Miller
  19. OUTLINE 1. Introduction 2. Methodology 3. Results 4. Research Plan

    Why do we study infant Type Ia explosions? Why is ZTF suited for this study? Forced-PSF photometry fitting method How to get robust uncertainty estimates? © This section has benefited from a journal club given by Dillon Dong, discussion with Adam Miller, and a data analysis recipe: Hogg (2010)
  20. Real-time Transient Detection Difference Image • Real-time data reduction: Masci

    (2019) ZTF Data Science System @IPAC Derive PSF for each image/ccd-quadrant Generate PSF-fit photometry • Machine learning evaluate 5-sigma detections (Mahabal 2019) • Send alert packets (Patterson 2019) • Users examine light curve and decide which telescope to trigger (Kasliwal 2019) ZTF camera: 16 CCDs x 4 quadrants
  21. Real-time Transient Detection Difference Image ZTF camera: 16 CCDs x

    4 quadrants Lose information about “non-detections”! t - texplosion (day) Need forced-PSF photometry at expected location
  22. Fit a (straight line) model to data Method Advantage Disadvantage

    “Chi-By-Eye” Builds intuition Human Bias Min 2 Aka Least Squares Regression
 Fast & Familiar Only Valid under Strong Assumptions Maximum Likelihood Estimation Fast; More Flexible than 2 Hard to tell if you’re in a local max Bayesian Inference (MCMC, multinest, gaussian process regression, etc) Can use all the info you have Reports a range of possibilities Marginalize over nuisance parameters Need reasonable likelihood functions Can be slow (to run/implement)
  23. Fit a (straight line) model to data Method Advantage Disadvantage

    “Chi-By-Eye” Builds intuition Human Bias Min 2 Aka Least Squares Regression
 Fast & Familiar Only Valid under Strong Assumptions Maximum Likelihood Estimation Fast; More Flexible than 2 Hard to tell if you’re in a local max Bayesian Inference (MCMC, multinest, gaussian process regression, etc) Can use all the info you have Reports a range of possibilities Marginalize over nuisance parameters Need reasonable likelihood functions Can be slow (to run/implement)
  24. Minimizing 2 (or least squares linear regression) Minimize Squared distance

    in y direction between each point and the model Variance of each point in y direction
  25. When is this model justified? Minimize Squared distance in y

    direction between each point and the model Variance of each point in y direction Uncertainties must be: • Gaussian (no systematic uncertainties) Minimizing 2
  26. Minimize Squared distance in y direction between each point and

    the model Variance of each point in y direction Uncertainties must be: • Gaussian (no systematic uncertainties) • Correctly estimated When is this model justified? Minimizing 2
  27. Minimize Squared distance in y direction between each point and

    the model Variance of each point in y direction Uncertainties must be: • Gaussian (no systematic uncertainties) • Correctly estimated • Only in y direction When is this model justified? Minimizing 2
  28. Uncertainties must be: • Gaussian (no systematic uncertainties) • Correctly

    estimated • Only in y direction • Uncorrelated with each other Minimize Squared distance in y direction between each point and the model Variance of each point in y direction When is this model justified? Minimizing 2
  29. Maximum Likelihood Estimation Assuming Gaussian uncertainties, the probability of a

    point given is: Now let’s take the (natural) log of the likelihood: Assuming independence, the likelihood function is: But who says we have to assume Gaussian uncertainties?
  30. MCMC Frequentists estimate the probability of the data given a

    fixed set of parameters: Bayesians estimate the “posterior” probability distribution of parameters given the data and our prior knowledge: Demo code is available at https://github.com/yaoyuhan/ForcePhotZTF MCMC helps us to do this Very good documentation: http://dfm.io/emcee/current/user/line/ Application on forced-PSF photometry
  31. jd jd Model Comparison When data quality is good: When

    data quality is bad (large seeing, cloudy, transient too close to center of the galaxy): Minimizing 2 MCMC r band g band
  32. OUTLINE 1. Introduction 2. Methodology 3. Results 4. Research Plan

    Why do we study infant Type Ia explosions? Why is ZTF suited for this study? Forced-PSF photometry fitting method How to get robust uncertainty estimates? Define the sample Light curve library & Color evolution
  33. Sample Properties 64 SNe Ia discovered within 5 days from

    inferred first-light time t0 © Figure from Mattia Bulla Type Iax Ia-CSM trise, B is from Zheng-fit (2017), x1 and ∆m15, B are from SALT2-fit (Guy 2007) Faster Slower Decline rate Peak Luminosity Brighter Fainter Correlation between trise, B and x1 / ∆m15, B
  34. Color Evolution SN Ia from the literature Stritzinger (2018) SN

    Ia from ZTF Year-1 Bulla (2019) in prep 13 discovered within 3 days from first light With one exception, all nearby (z < 0.02) Evidence for two distinct populations 26 discovered within 3 days from first light 0.02 < z < 0.13 No strong evidence for two populations The largest dataset of infant SNe Ia!
  35. OUTLINE 1. Introduction 2. Methodology 3. Results 4. Research Plan

    Why do we study infant Type Ia explosions? Why is ZTF suited for this study? Forced-PSF photometry fitting method How to get robust uncertainty estimates? Define the sample Light curve library & Color evolution What can still be done for the 2018 sample? What we should do in ZTF Year-2?
  36. • SNe Ia light curve rise functions. - linear? fireball?

    (double/single) power-law index? - characterization with ZTF-only data using PCA or heteroscedastic Gaussian processes… • Most spectra of the 2018 sample are from SEDM. Need early Keck/DBSP, peak spec, multi-phase spec • About cosmology: SALT2 parameters, i band data… Some thoughts…
  37. SUMMARY • Early observation of SNe Ia has the power

    to diagnose different progenitor channels. • ZTF is well positioned to carry out sample studies of infant SNe Ia. • MCMC is a good method to be applied in force-PSF photometry (to the linear fit). • We already have the largest dataset of infant SNe Ia with the ZTF Year-1 survey. • ZTF Year-2 will find a similar number, and with better spectroscopy. Thanks for listening!
  38. How many can ZTF observe? Spectroscopically Accessible Detection Rate Bellm

    (2016) Detection Rate Detection rate vs. exposure time for SNe Ia (Mpeak = -19) with apparent magnitude brighter than 21mag texposure = 30 s texposure = 30 s texposure = 50 s mlim = 20.4, Ωfov = 47 deg2 mlim = 23.7, Ωfov = 3 deg2 mlim = 24.7, Ωfov = 9.6 deg2