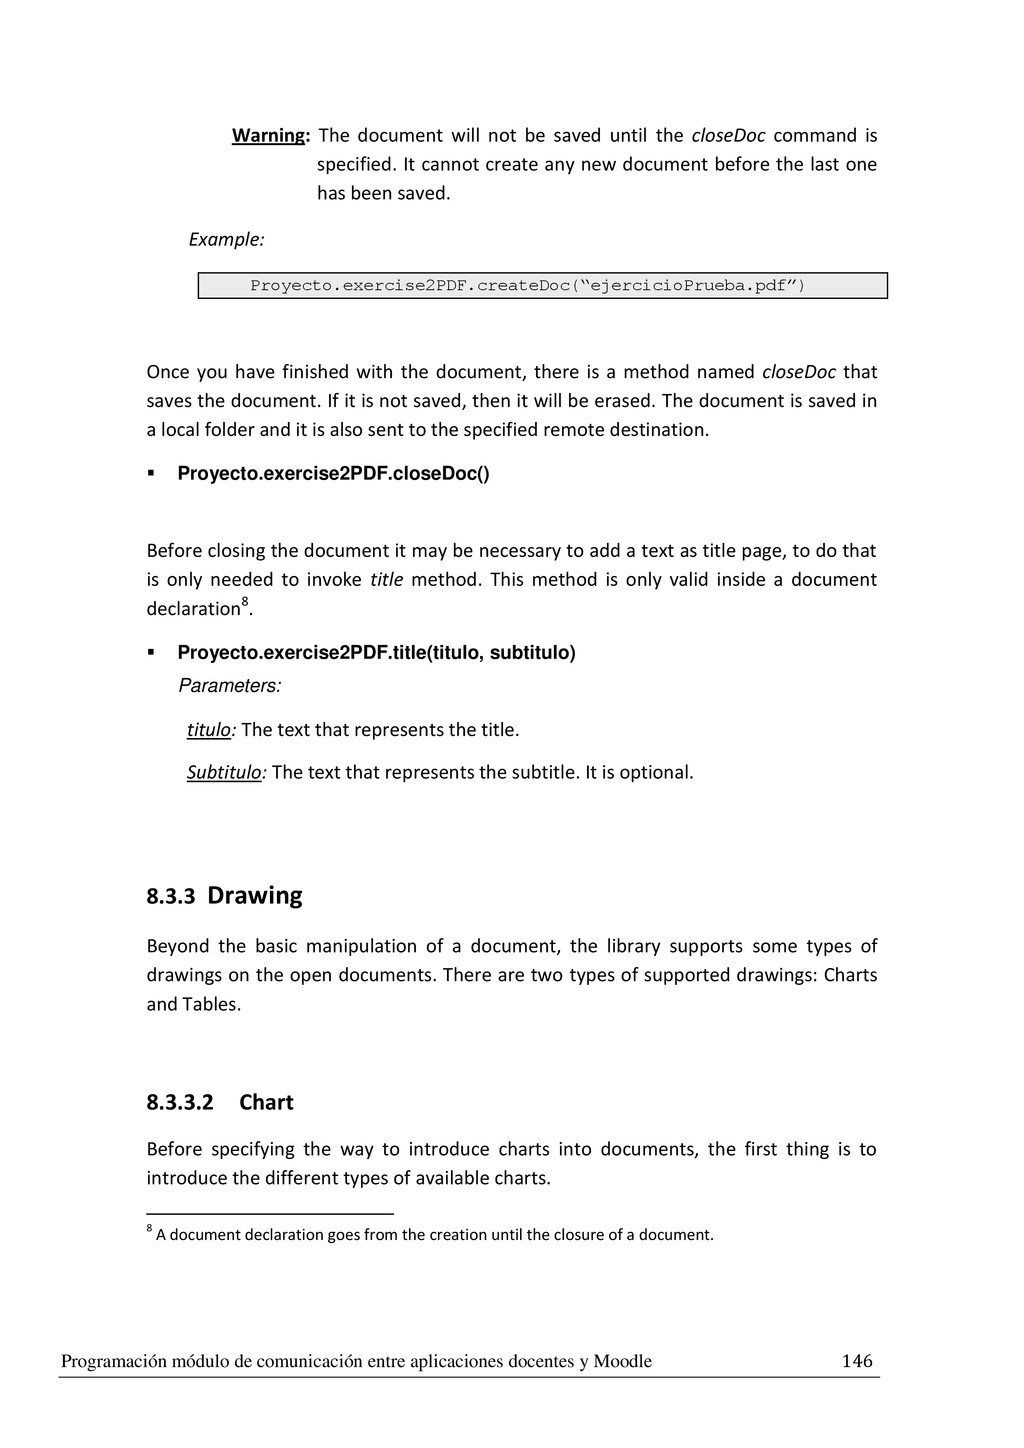
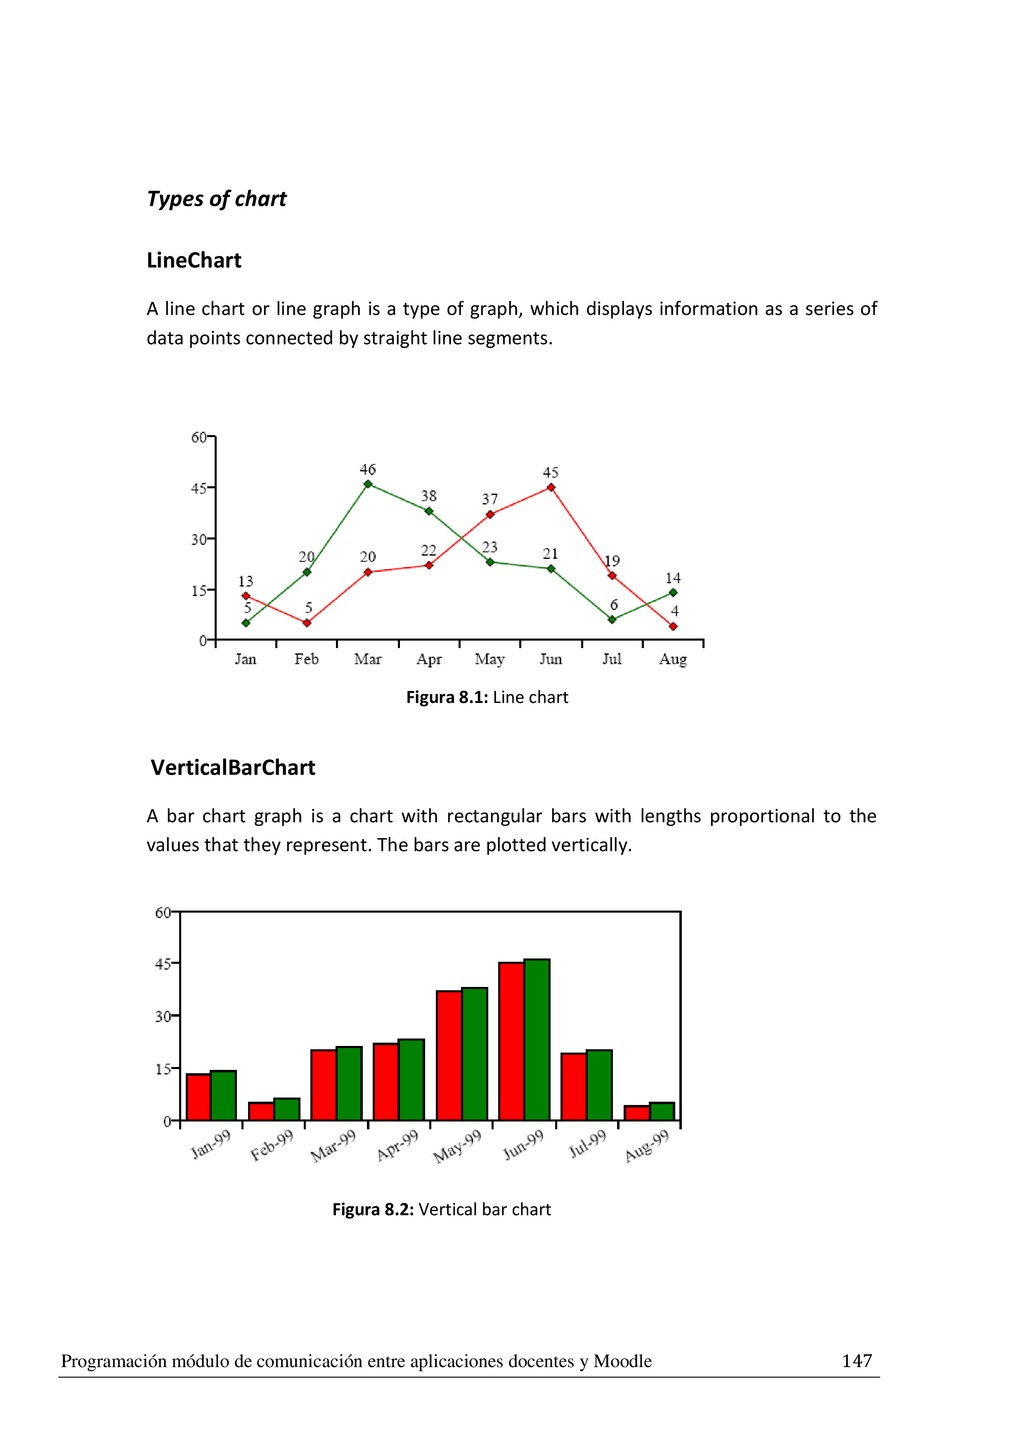
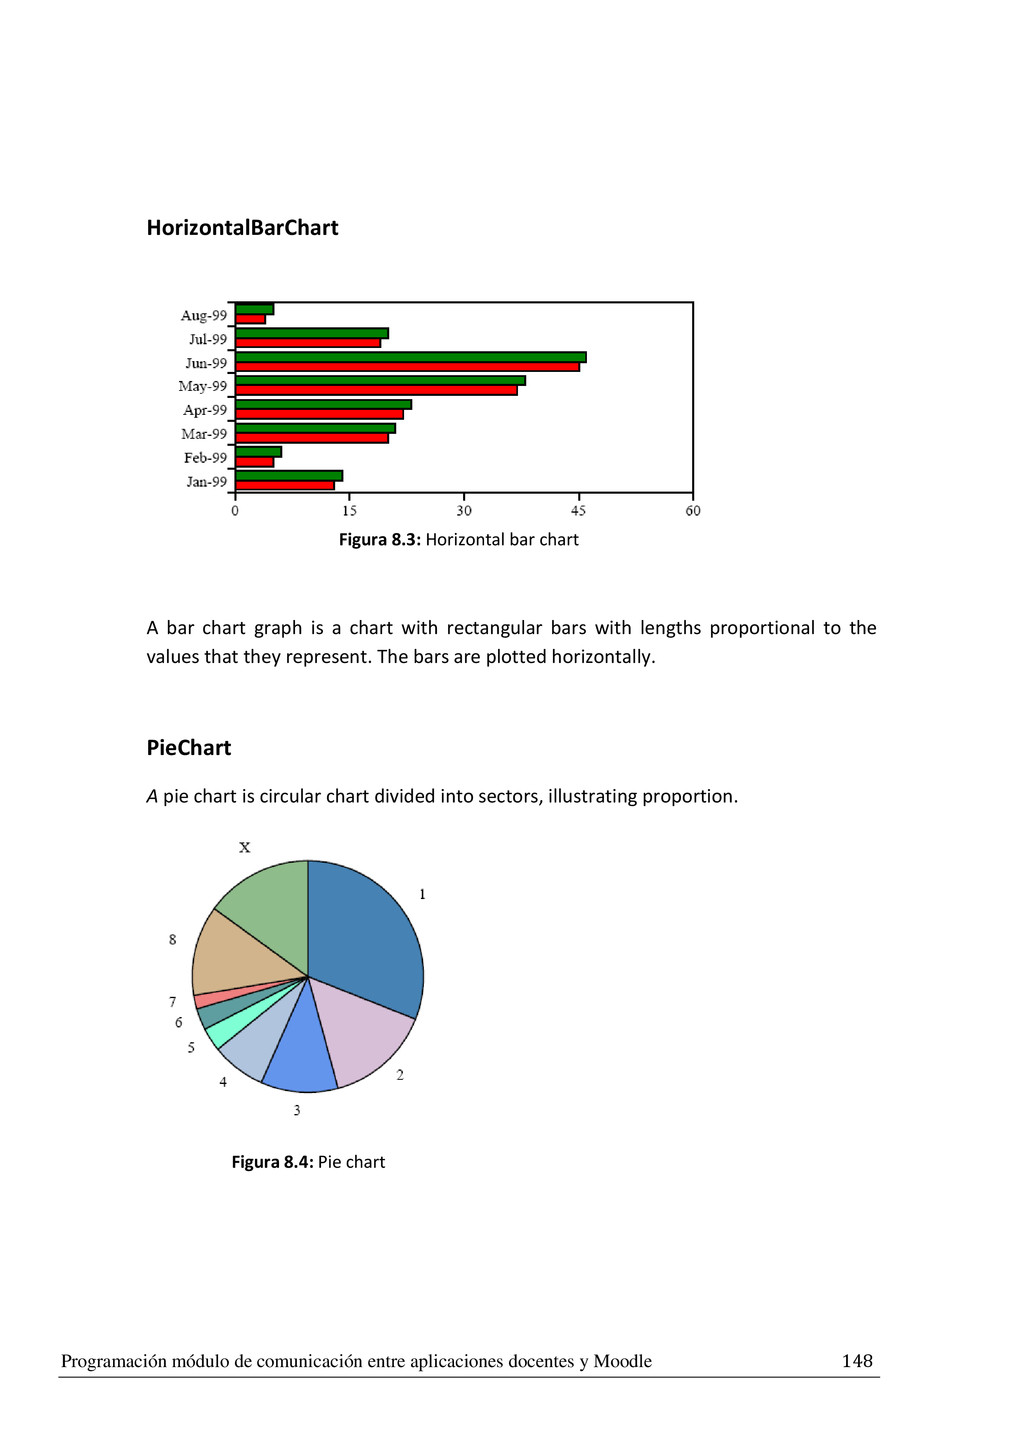
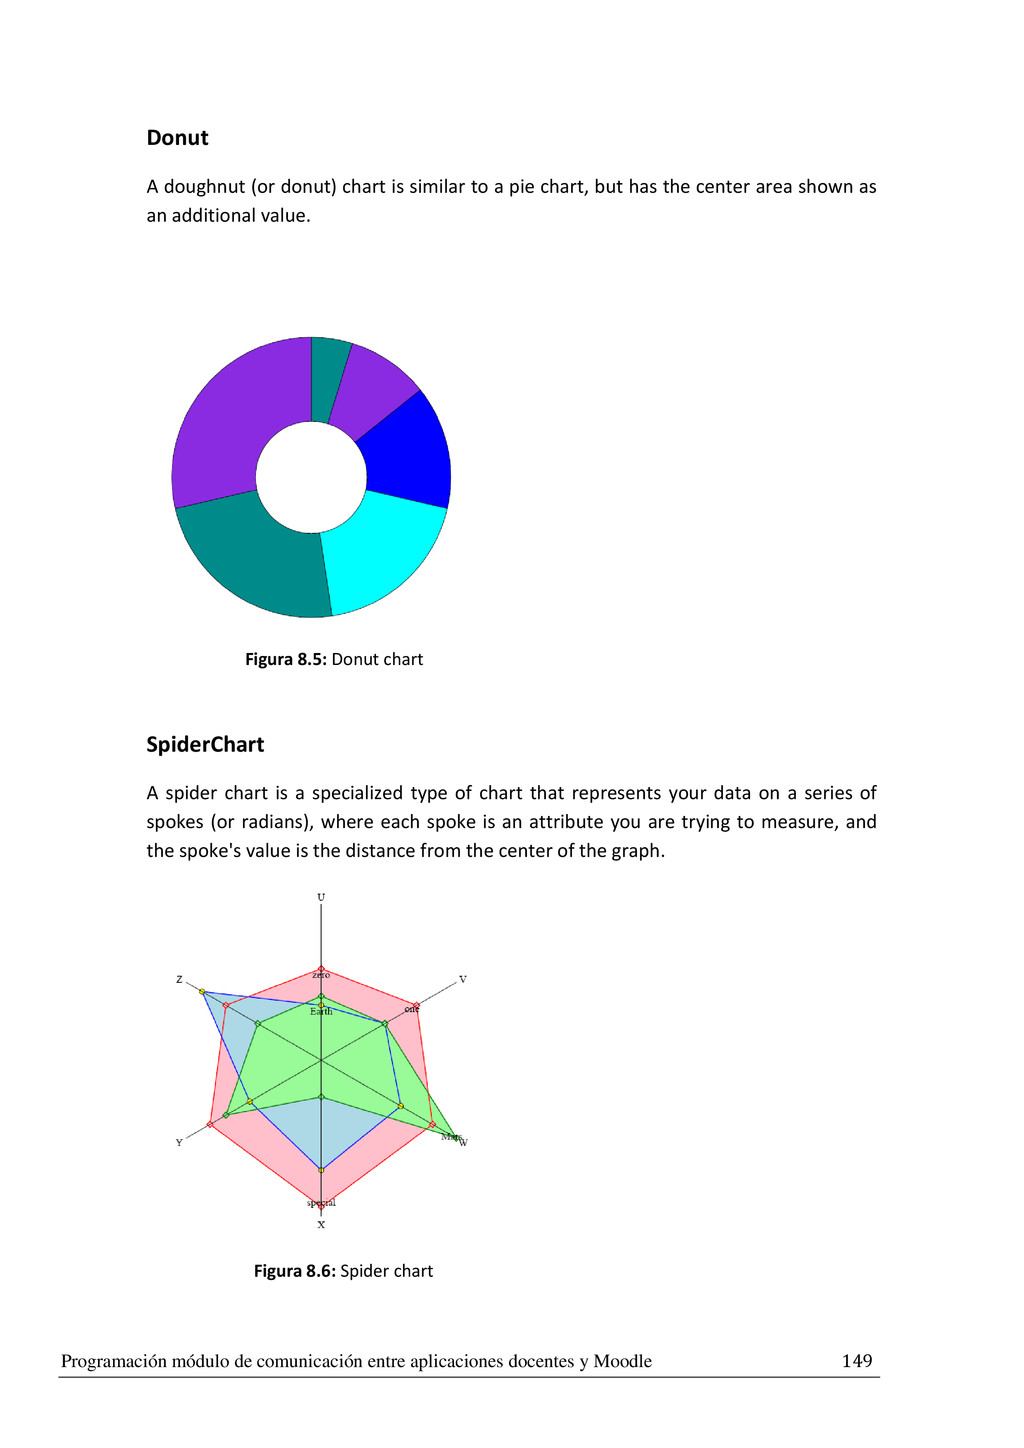
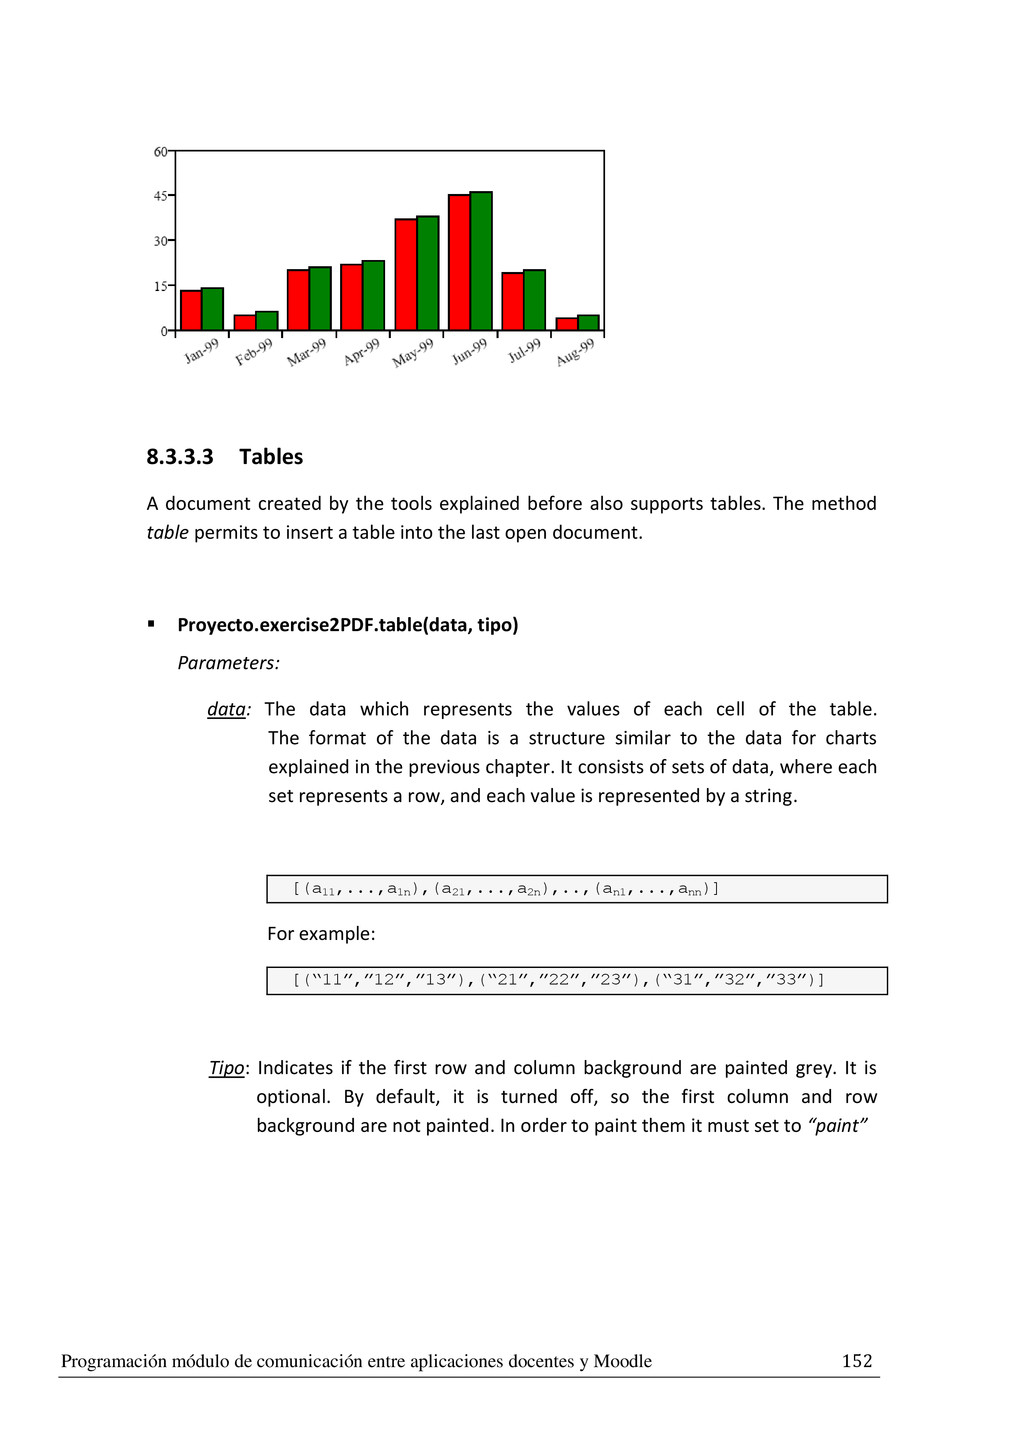
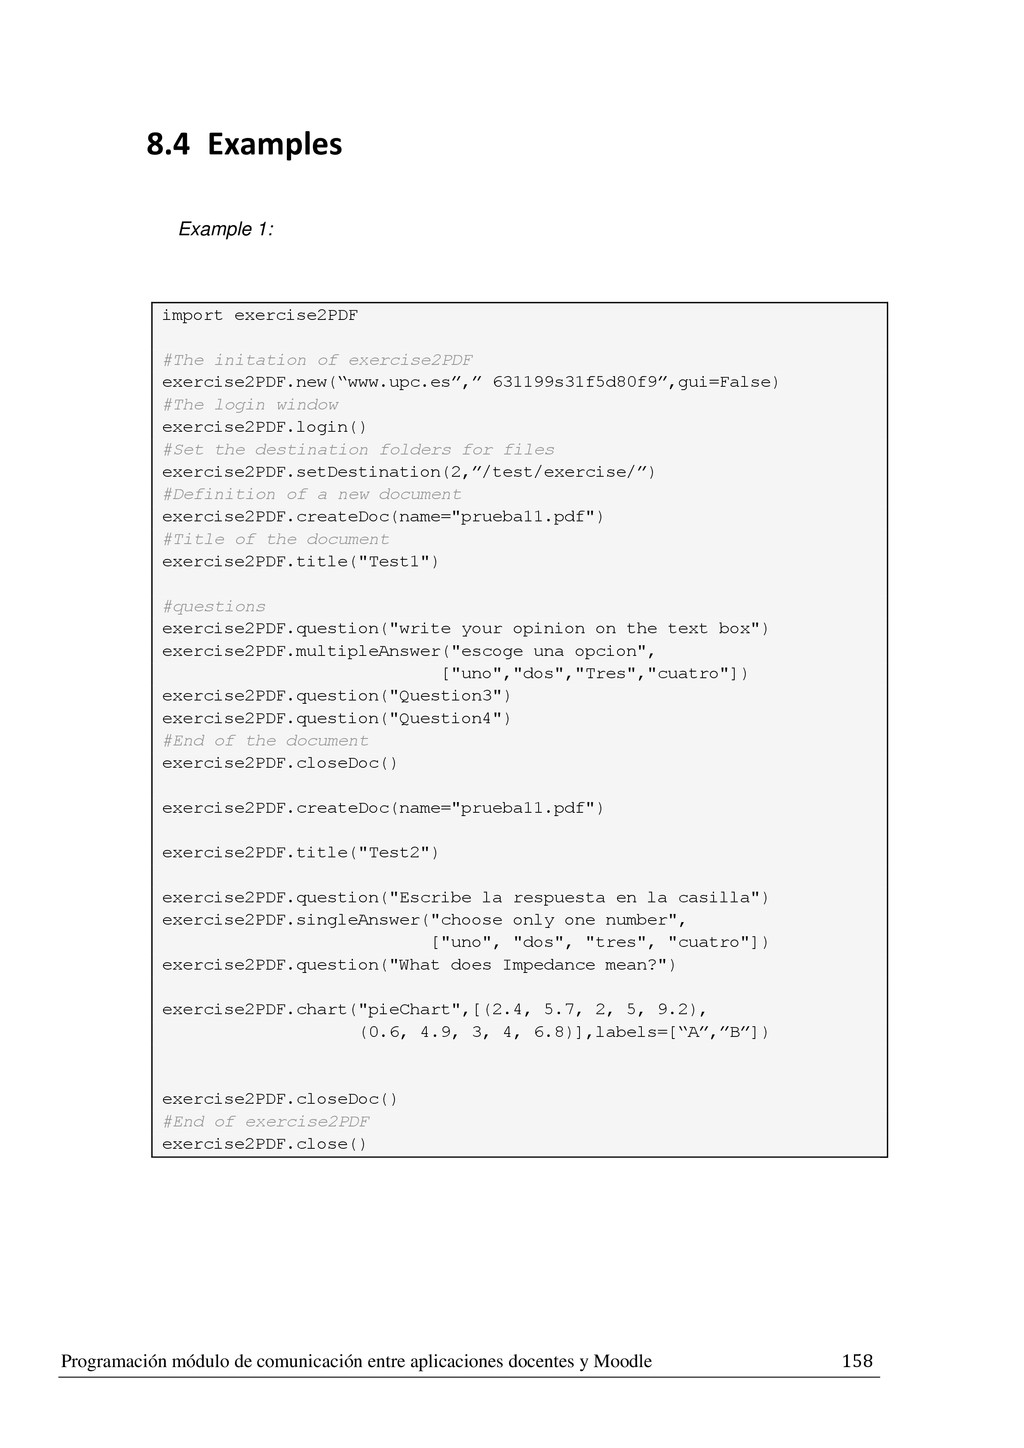
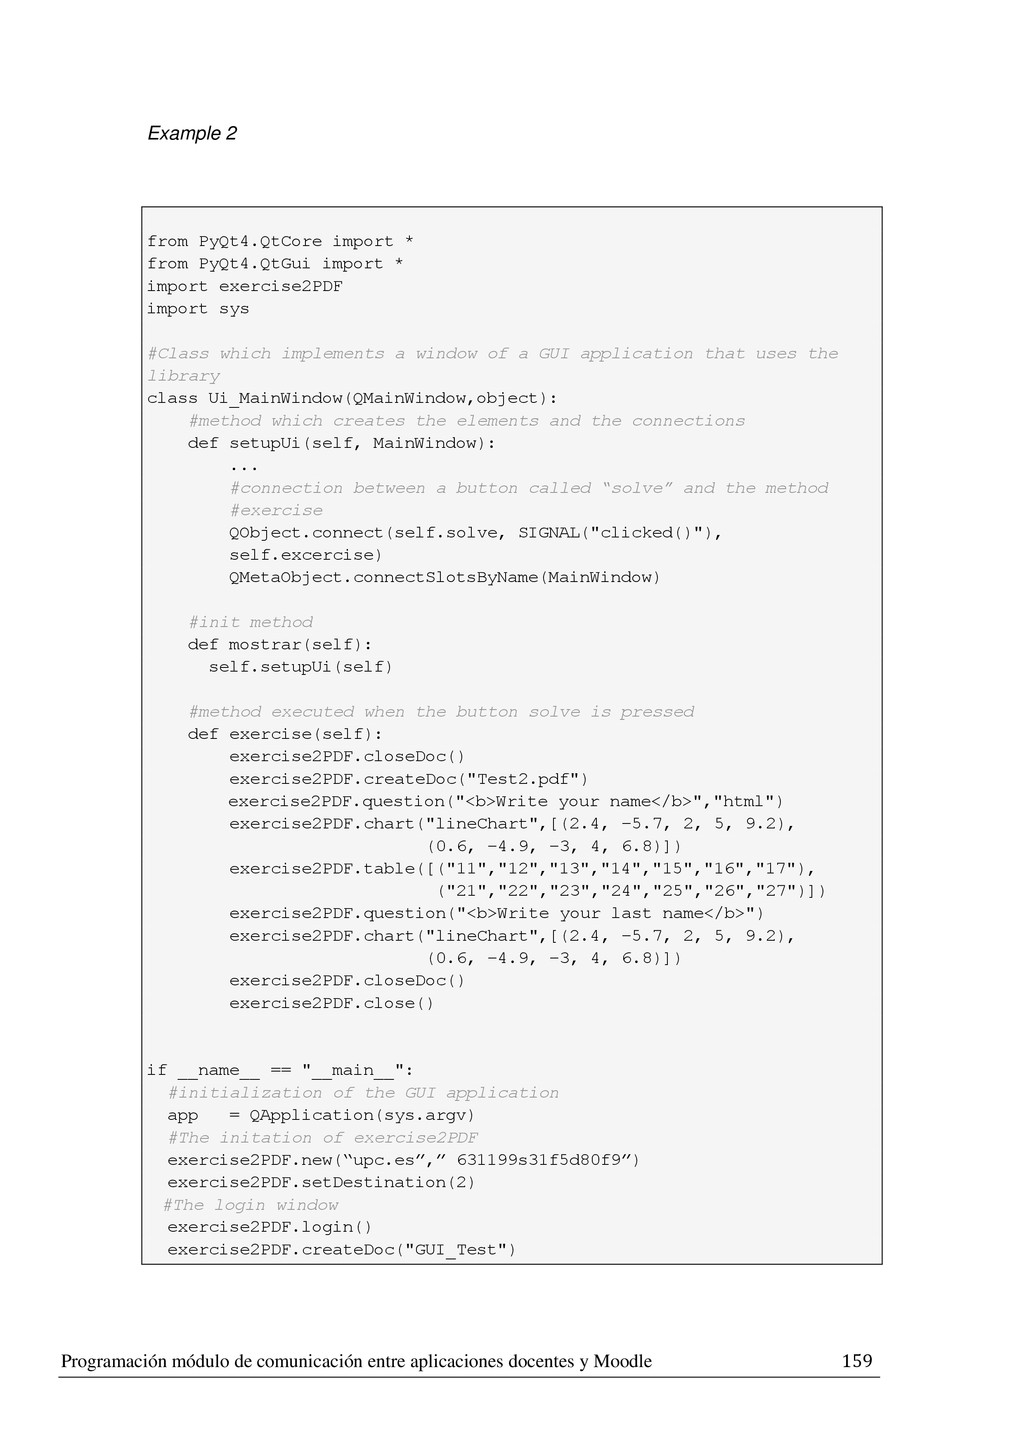
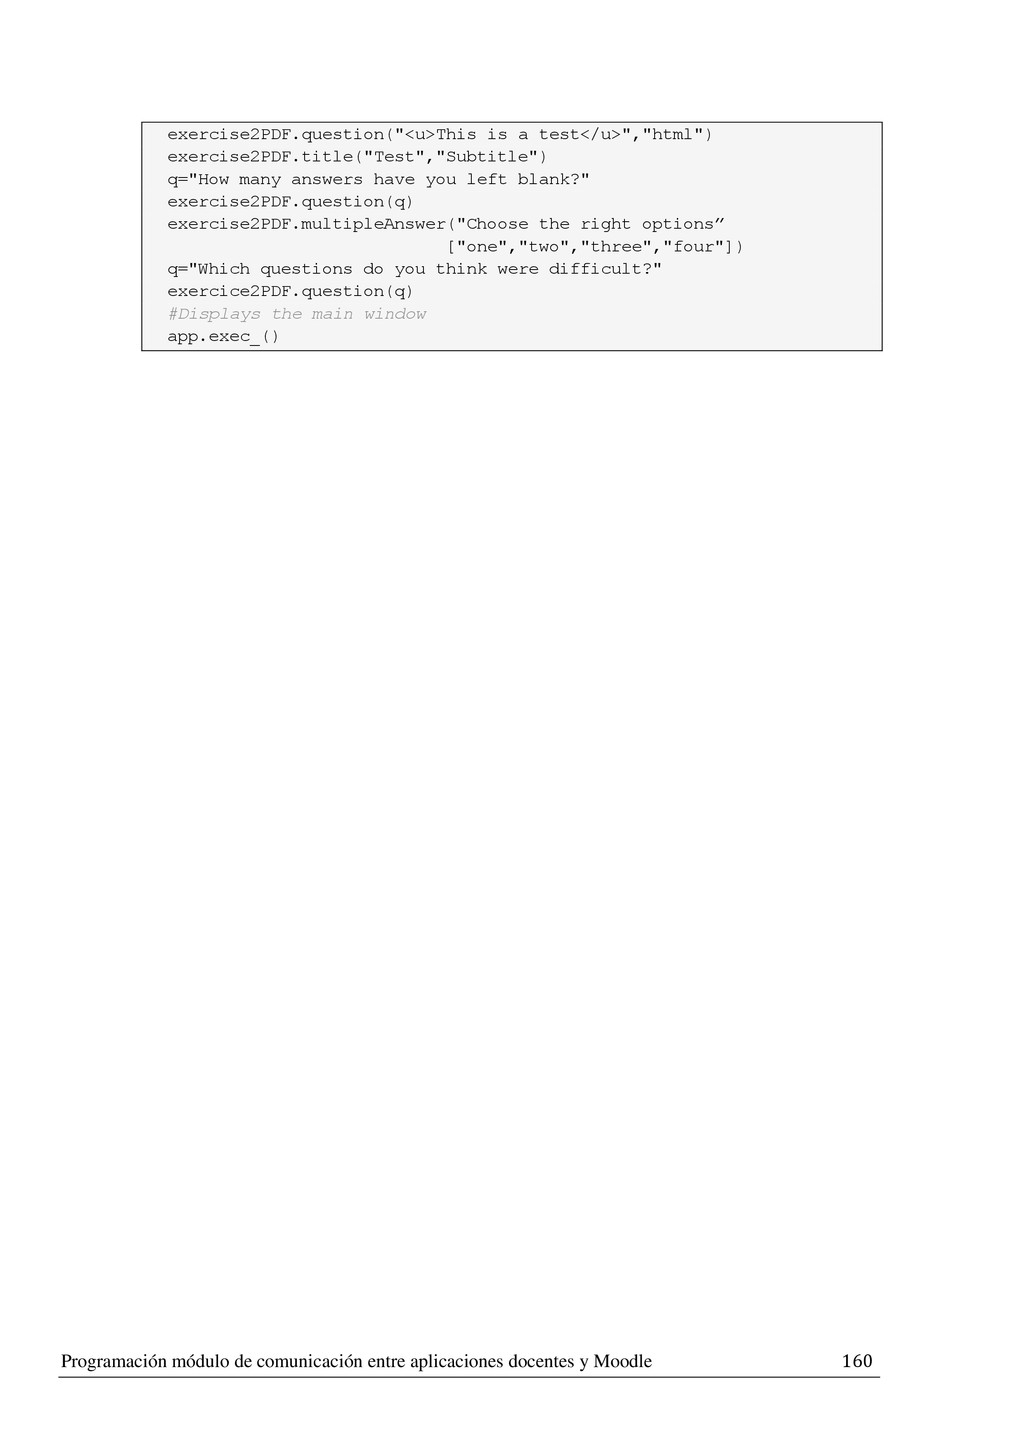
Charts on documents To introduce a chart into an open document is as simple as calling the chart method. Proyecto.exercise2PDF.chart(tipo,data,labels,cnames,width, height,step,maximo, minimo) Parameters: tipo: The type of the chart. It must be one of the six types above. data: The data values for the chart Each type of chart has a different way of representing the input data, therefore, it is important to use the data structure related to the type of chart specified in tipo. Here is the structure used to represent the data for each type of chart. LineChart [(a0 ,a1 ,...,an ),(b1 ,b2 ,...,bn ),...,(z1 ,z2 ,...,zn )] Each parenthesis represents a set of integers, and each set is drawn as a line on the chart. For example: [(13, 5, 20, 22, 37, 45, 19, 4),(14, 10, 21, 28, 38, 46, 25, 5)] VerticalBarChart, HorizontalBarChart, Donut and Spidechart The same structure as linechart PieChart [a1 ,...,an ] On each value is an integer. For example: [10, 20, 30, 40, 50, 60, 70, 80, 90, 100]