Upgrade to Pro — share decks privately, control downloads, hide ads and more …

Beer Tourism - Julia Herz

Zephyr Conferences
March 29, 2017
140

Beer Tourism - Julia Herz

Zephyr Conferences

March 29, 2017
Tweet

Transcript

  1. U.S. Beverage Alcohol Sales Category Sales Beer* $107.6B (2016) Spirits

    $69B (2015) Wine >$50B (2015) *$23.5B for Small and Independent Craft Brewers 2
  2. 0 500 1,000 1,500 2,000 2,500 3,000 3,500 4,000 4,500

    1873 1877 1881 1885 1889 1893 1897 1901 1905 1909 1913 1917 1932 1936 1940 1944 1948 1952 1956 1960 1964 1968 1972 1976 1980 1984 1988 1992 1996 2000 2004 2008 2012 Number of Breweries, 1873 - 2015 Sources: Brewers Association
  3. Too Many Breweries? •Nearly 1,000 cities with a population of

    more than 10,000 don't have a local brewery YET. 6
  4. U.S. Sales By Channel S&I Craft Brewer Overall Beer On-premise

    28% 18% Off-premise 65% 82% At The Source 7% <1% 2015 Estimates-Brewers Association 10
  5. Sales By Package Type S&I * Overall Beer** Bottles 60%

    34% Draught 30% 10% Cans 10% 55% *2014 Brewers Association Brewery Operations Benchmarking Survey (BOBS) **NBWA 2016 11
  6. Homebrewing in U.S. • 1M+ homebrews • 1,500+ Clubs •

    700+ Retailers • BJCP Competitions 626 in 2015 vs. 192 in 2003 • 46,000 members of AHA HomebrewersAssociation.org 12
  7. Gender of U.S. Beer Lovers 74% Male 26% Female Source:

    2015 U.S. Yankelovich MONITOR survey, which tapped more than 10,000 respondents 18
  8. Total Beer vs Craft Age Breakdown CRAFTS (incl DM SPECIALTY)

    – AGE/GENERATIONS; Index to % Adults Source: Nielsen Spectra /Simmons (Data Version: Sept 2014); on plus off-premise AGE 21+ % Adults TTL BEER CRAFT* % Volume Index % Volume Index 21-34 25.6% 35.1% 137 35.5% 138 35-44 18.0% 20.7% 115 24.3% 135 45-64 37.1% 33.3% 90 31.6% 85 65+ 19.2% 10.8% 56 8.6% 45 >120 <80
  9. 21

  10. 24

  11. Tourism and Beer •2015 GABF generated the equivalent of 2

    percent of Denver’s GDP, accounting for $28.6 million •2014 - 10M people toured craft breweries 25
  12. 26

  13. How important is “local” in purchase decisions? 67 45 34

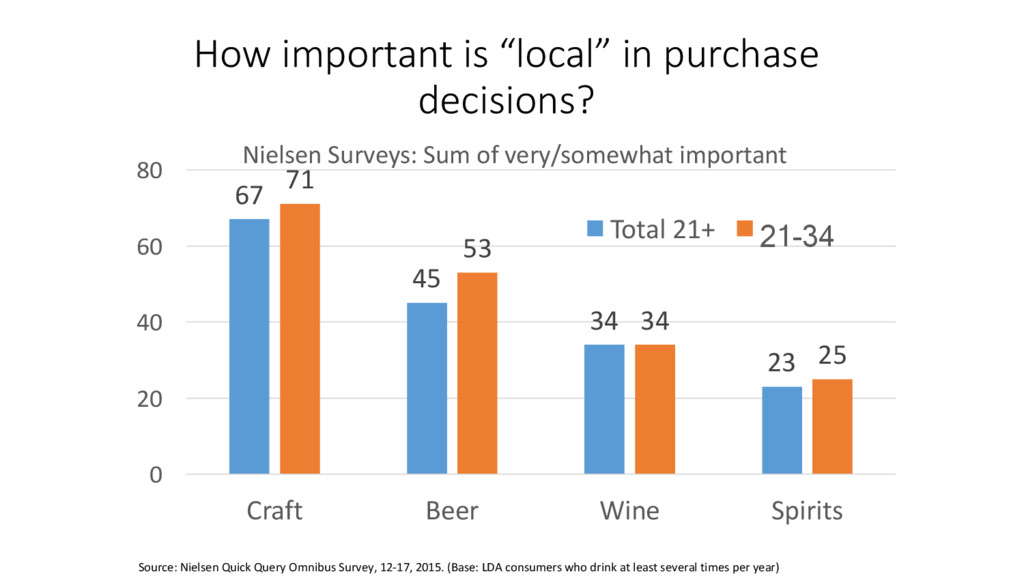
    23 71 53 34 25 0 20 40 60 80 Craft Beer Wine Spirits Nielsen Surveys: Sum of very/somewhat important Total 21+ 21-34 Source: Nielsen Quick Query Omnibus Survey, 12-17, 2015. (Base: LDA consumers who drink at least several times per year)
  14. 53.0% 27.2% 9.1% 6.8% 4.0% 0.0% 10.0% 20.0% 30.0% 40.0%

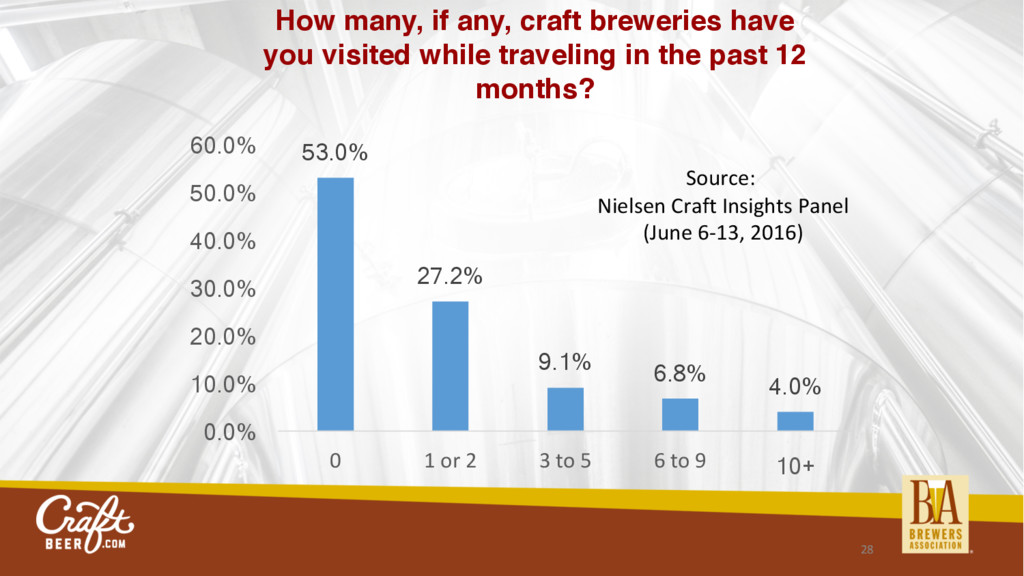
    50.0% 60.0% 0 1 or 2 3 to 5 6 to 9 10+ How many, if any, craft breweries have you visited while traveling in the past 12 months? Source: Nielsen Craft Insights Panel (June 6-13, 2016) 28
  15. After your visit(s) to a craft brewery, which of the

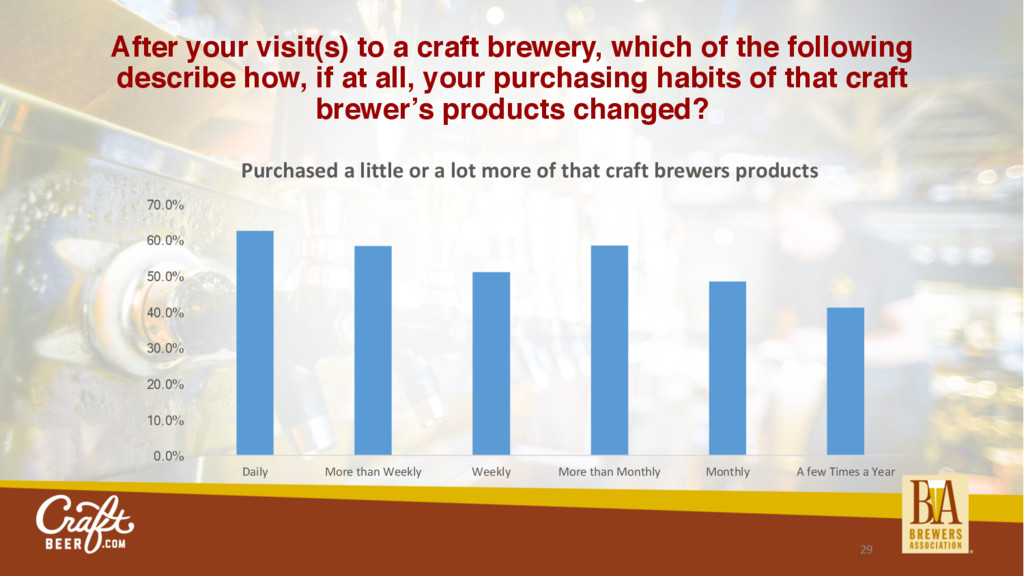
    following describe how, if at all, your purchasing habits of that craft brewer’s products changed? 0.0% 10.0% 20.0% 30.0% 40.0% 50.0% 60.0% 70.0% Daily More than Weekly Weekly More than Monthly Monthly A few Times a Year Purchased a little or a lot more of that craft brewers products 29
  16. “The proliferation of craft brewing on the East Coast is

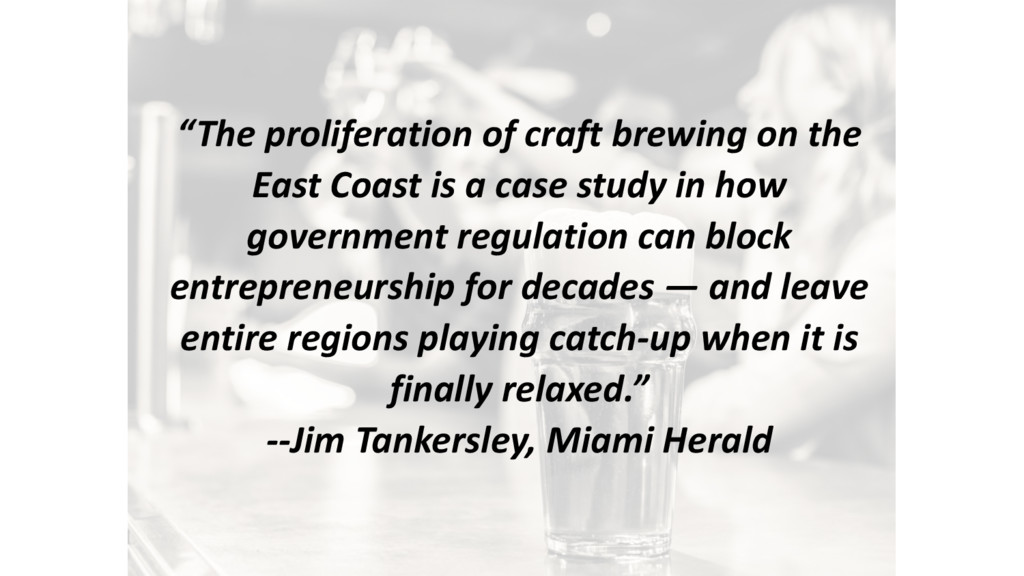
    a case study in how government regulation can block entrepreneurship for decades — and leave entire regions playing catch-up when it is finally relaxed.” --Jim Tankersley, Miami Herald
  17. • Self Distribution • Franchise Laws • Growler Laws •

    State Excise Tax Rates • Brewery Sales and Sampling Laws 35 Some Key Things To Watch
  18. What We Want • Fair access to market for all

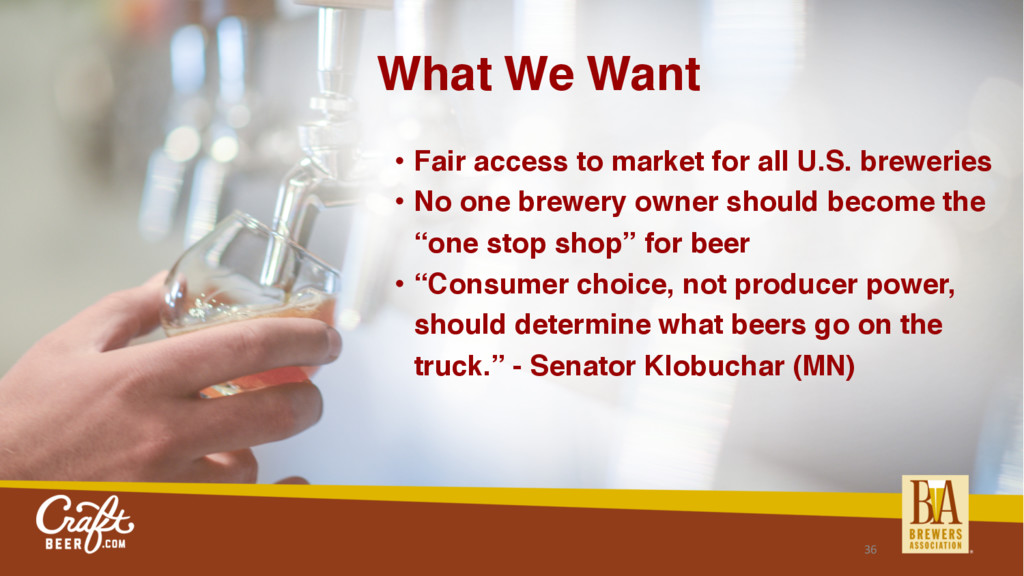
    U.S. breweries • No one brewery owner should become the “one stop shop” for beer • “Consumer choice, not producer power, should determine what beers go on the truck.” - Senator Klobuchar (MN) 36