Upgrade to Pro — share decks privately, control downloads, hide ads and more …

What’s Next for the Beer Industry - Lester Jones (NBWA)

Zephyr Conferences
August 05, 2017
75

What’s Next for the Beer Industry - Lester Jones (NBWA)

Zephyr Conferences

August 05, 2017
Tweet

Transcript

  1. Where is Beer Headed? Economics and Demographics Drive the Beer

    Industry Lester Jones, Chief Economist, NBWA Mike Frank, President, Frank Beverage Group Justin Wellington, Sales, Beechwood Sales and Service
  2. Independence Really Matters! British Pubs Ban Swearing, Are Accused of

    Having %$&# for Brains! Samuel Smith Old Brewery, the 250-year-old brewery that operates The Cock Tavern and more than 200 other pubs across Britain, in April instituted a “zero- tolerance policy” against swearing—the first time, pub historians say, a British pub chain has sought an official ban.
  3. 250 974 1,991 2,343 8,301 0 1,000 2,000 3,000 4,000

    5,000 6,000 7,000 8,000 9,000 1990 1991 1992 1993 1994 1995 1996 1997 1998 1999 2000 2001 2002 2003 2004 2005 2006 2007 2008 2009 2010 2011 2012 2013 2014 2015 2016 2017 8,301 TTB Permitted U.S. Breweries 1990 to June 2017 Source: TTB and NBWA, July 2017.
  4. TTB Permitted Brewery Count 8,301 as of 7/1/2017 State Count

    State Count State Count Alabama 45 Kentucky 68 North Dakota 18 Alaska 41 Louisiana 40 Ohio 297 Arizona 125 Maine 119 Oklahoma 37 Arkansas 40 Maryland 105 Oregon 337 California 1,049 Massachusetts 174 Pennsylvania 386 Colorado 428 Michigan 429 Rhode Island 23 Connecticut 93 Minnesota 200 South Carolina 80 Delaware 31 Mississippi 16 South Dakota 26 DC 13 Missouri 139 Tennessee 113 Florida 311 Montana 92 Texas 306 Georgia 89 Nebraska 52 Utah 36 Hawaii 27 Nevada 44 Vermont 78 Idaho 70 New Hampshire 82 Virginia 262 Illinois 273 New Jersey 111 Washington 471 Indiana 189 New Mexico 105 West Virginia 26 Iowa 104 New York 454 Wisconsin 248 Kansas 51 North Carolina 311 Wyoming 37 Source: NBWA and TTB, July 2017.
  5. TTB Permitted Brewery Count Per Capita 2017 (per 100,000 Residents)

    Source: NBWA and TTB, July 2017. U.S. Total 2017 = 3.5 per 100,000 State 2017 Rank State 2017 Rank State 2017 Rank Alabama 1.3 48 Kentucky 2.1 39 North Dakota 3.3 27 Alaska 8.0 8 Louisiana 1.2 50 Ohio 3.5 25 Arizona 2.5 34 Maine 11.6 3 Oklahoma 1.3 47 Arkansas 1.8 43 Maryland 2.4 36 Oregon 10.7 4 California 3.7 23 Massachusetts 3.4 26 Pennsylvania 4.0 20 Colorado 10.4 5 Michigan 5.8 11 Rhode Island 2.9 31 Connecticut 3.5 24 Minnesota 4.9 14 South Carolina 2.2 38 Delaware 4.3 16 Mississippi 0.8 51 South Dakota 4.2 18 DC 2.4 35 Missouri 3.1 28 Tennessee 2.3 37 Florida 1.9 41 Montana 11.8 2 Texas 1.6 46 Georgia 1.2 49 Nebraska 3.8 22 Utah 1.8 44 Hawaii 2.6 32 Nevada 2.0 40 Vermont 16.4 1 Idaho 5.8 12 New Hampshire 8.0 9 Virginia 4.3 17 Illinois 2.9 30 New Jersey 1.7 45 Washington 8.6 7 Indiana 3.9 21 New Mexico 7.0 10 West Virginia 1.9 42 Iowa 4.6 15 New York 3.1 29 Wisconsin 5.8 13 Kansas 2.5 33 North Carolina 4.2 19 Wyoming 8.8 6
  6. Permits Grow Across All Segments U.S. Permits 2010 to 2017

    0 2,000 4,000 6,000 8,000 10,000 2010 2011 2012 2013 2014 2015 2016 2017 Brewery 0 500 1,000 1,500 2,000 2,500 2010 2011 2012 2013 2014 2015 2016 2017 Distillery 0 2,000 4,000 6,000 8,000 10,000 12,000 14,000 2010 2011 2012 2013 2014 2015 2016 2017 Winery New entrants into alcohol beverage across all three categories. Strong incentives to enter the business on a small scale – NOT HOW MANY, BUT HOW MUCH!
  7. The Demographics Favor Alcohol Beverage • 10,000 baby boomers turn

    65 each day. They are the new “Leisure Force.” What will they do with their time? • 12,000 Millennials turn 21 each day. They are the new work force. What will they do with their money? • No Millennial echo boom, job and no kids – what will they do with their free time? • Average age of first time home buyer is 33. Americans are renting more than twice as long before buying their first home as they did in the 1970s.
  8. An Aging U.S. Population 2000 to 2016 68% 69% 70%

    71% 72% 73% 74% 2000 2002 2004 2006 2008 2010 2012 2014 2016 Legal Drinking Age Share 34.0 34.5 35.0 35.5 36.0 36.5 37.0 37.5 38.0 38.5 2000 2002 2004 2006 2008 2010 2012 2014 2016 Median Age Source: U.S. Census Bureau
  9. Smaller Households and Fewer People 1960 to Present 0.00 0.50

    1.00 1.50 2.00 2.50 3.00 3.50 1960 1970 1980 1990 2000 2010 2016 Household Size Source: U.S. Census Bureau and National Center for Health Statistics 0.00 5.00 10.00 15.00 20.00 25.00 1960 1970 1980 1990 2000 2010 2015 Birth Rates (per 1,000s)
  10. Economy is at Full Employment! • Unemployment Rate at 4.3%

    (July) • Economy added 209K Jobs (July) • Compensation June +0.5% & +2.4% YoY • Inflation June CPI 0.0% & 1.6% YoY • 5.7MM openings vs 5.5MM hires in May • 5.3MM separations in May (3.6% rate) • Existing Home Sales +8% • Home Prices +6.9% YoY (wealth effect) • Consumer Confidence 118.9 in June (Conference Board) • Interest rates remain low
  11. Not Just Competition for a Drink, Its Competition for Your

    Time Average Stay = 2 hours 26,000 people per day
  12. Changing Beer Segments 1980 vs. 2016 SubPremium 28 Premium 62.3

    Above Premium (HE) 9.5 1980 SubPremium 21.4 Premium 39.5 Above Premium (HE) 39.1 2016 Source: Beer Marketer’s Insights, “The Long View” 2015.
  13. Changing High End Beer Industry 1980 vs. 2016 Imports 2.6

    Craft = 0 Super Prem 6.9 1980 HE + 9.5% Imports 15.9 Craft 11.1 SuperPr em 7 FMB 4.1 Cider 1 2016 HE = 39.1% Source: Beer Marketer’s Insights, “The Long View” 2015.
  14. U.S Malt Beverage Shipments Domestics plus Imports (Case Equivalents) 2.87

    2.85 2.80 2.81 2.82 2.83 2.84 2.85 2.86 2.87 2.88 2010 2011 2012 2013 2014 2015 2016 Total Industry Case Equivalents Source: U.S. TTB and Dept. of Commerce 13.0 12.0 11.40 11.60 11.80 12.00 12.20 12.40 12.60 12.80 13.00 13.20 2010 2011 2012 2013 2014 2015 2016 Cases Per Capita (LDA)
  15. U.S. Tax Determined Grew 52% in 2016 (Proxy for Brewpub

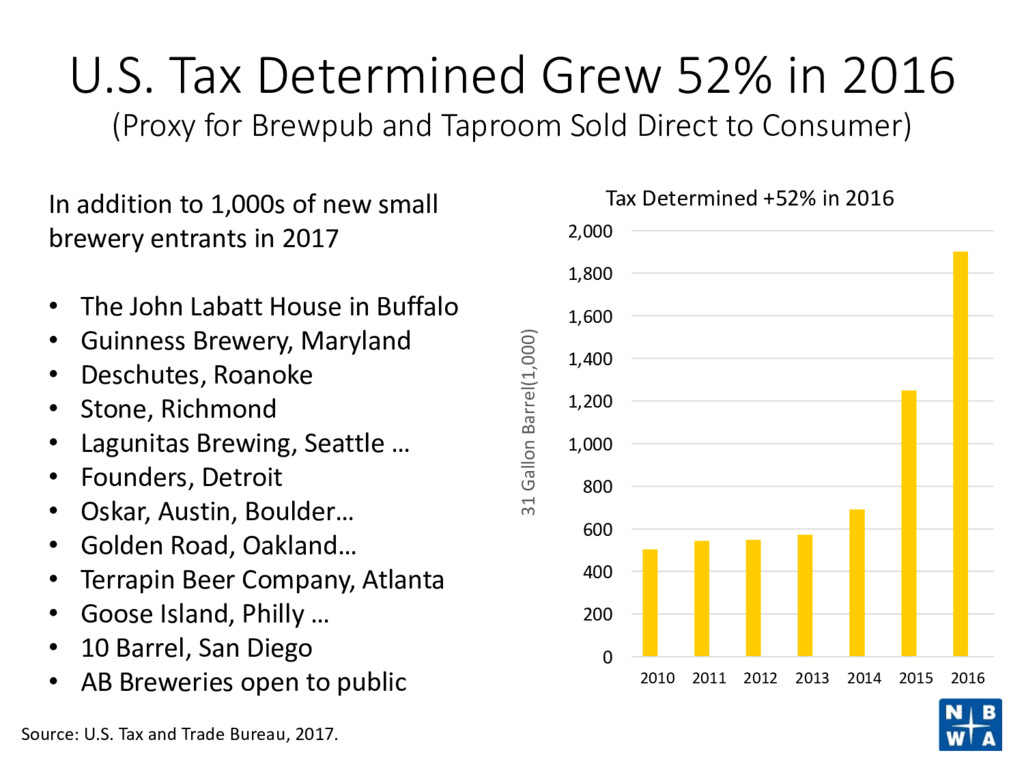
    and Taproom Sold Direct to Consumer) 0 200 400 600 800 1,000 1,200 1,400 1,600 1,800 2,000 2010 2011 2012 2013 2014 2015 2016 31 Gallon Barrel(1,000) Thousands Tax Determined +52% in 2016 Source: U.S. Tax and Trade Bureau, 2017. In addition to 1,000s of new small brewery entrants in 2017 • The John Labatt House in Buffalo • Guinness Brewery, Maryland • Deschutes, Roanoke • Stone, Richmond • Lagunitas Brewing, Seattle … • Founders, Detroit • Oskar, Austin, Boulder… • Golden Road, Oakland… • Terrapin Beer Company, Atlanta • Goose Island, Philly … • 10 Barrel, San Diego • AB Breweries open to public
  16. 2017 Battle of the Taprooms How Big Is Your Mousetrap?

    1. How many can there be? 2. How big can they be? 3. How many seats? 4. How much beer? 5. How do they get along with existing local retailer? 6. How many locations, six? I. 6 x 100 seats = 600 II. 6 x 1000 seats = 6000 III. 6 x 2000 seats = 12,000 7. What is a brewery…music venue, dog park, food truck court parking lot, yoga studio, or manufacturer? 1. How many can there be? 2. How big can they be? 3. How many seats? 4. How much beer? 5. How do they get along with existing local retailer? 6. How many locations, six? I. 6 x 100 seats = 600 II. 6 x 1,000 seats = 6,000 III. 6 x 2,000 seats = 12,000 7. What is a brewery…music venue, dog park, food truck court, yoga studio, or manufacturer?
  17. Warehouse / Operations The Challenge of SKU Proliferation Racking Systems

    • Drive Thru • Narrow Aisle • High Density • Refrigerated Storage
  18. Warehouse / Operations The Changing Needs of our Retail partners

    • Warehouse Management Systems • Voice Picking • Auto Wrapper and Scales • Advanced Shipping w/ Large Format • Express Routes
  19. Special Events / Graphics Dep’t Graphics Dep’t • Localized /

    Customized • Fast Turn Time • Support for Brewer Partners that lack marketing assets • Support for Retail Partners • Draft Techs • Special Events
  20. Questions: Question 1: How does your distributorship seek out and

    find new accounts? As Milwaukee has grown, what are the new accounts and new places people are drinking? Question 2: Draft beer is important today as it was 75 years ago when everyone drank at the local tavern. Can you talk about how your company is using draft to grow? Question 3: New drinkers, new brands, new places to drink…what can you tell us about the consumer in your markets? How are the different or the same?