Upgrade to Pro — share decks privately, control downloads, hide ads and more …

Aravali college of engineering and management

aastha
September 15, 2020

Aravali college of engineering and management

aastha

September 15, 2020
Tweet

More Decks by aastha

Other Decks in Education

Transcript

  1. Introduction to Regression Analysis Slide-8  Regression analysis is used

    to:  Predict the value of a dependent variable based on the value of at least one independent variable  Explain the impact of changes in an independent variable on the dependent variable Dependent variable: the variable we wish to predict or explain Independent variable: the variable used to explain the dependent variable
  2. Simple Linear Regression Model Slide-9  Only one independent variable,

    X  Relationship between X and Y is described by a linear function  Changes in Y are assumed to be caused by changes in X
  3. Types of Relationships Slide-10 Y Y X Y Y X

    Linear relationships Curvilinear relationships X X
  4. Types of Relationships Slide-11 Y Y X Y Y X

    Strong relationships Weak relationships (continued) X X
  5. Y i  β 0  β 1 X i

    Linear component Simple Linear Regression Model Slide-13 Population Y intercept Population Slope Coefficient Random Error term Dependent Variable Independent Variable  ε i Random Error component
  6. Random Error i for this X value X Y Observed

    Value of Y for Xi Predicted Value of Y for Xi Y i  β 0  β 1 X i  ε i X i Slope = β 1 Simple Linear Regression Model (continued) Slide-14 Intercept = β 0 ε i
  7. Yˆ i  b 0  b 1 X i

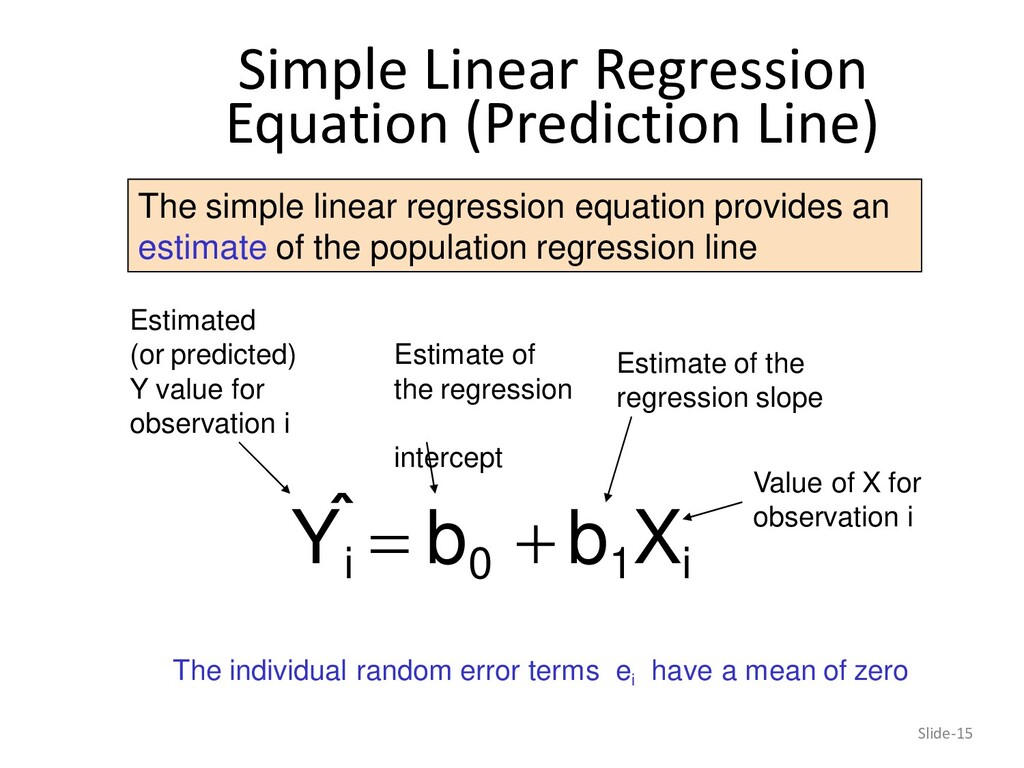
    The simple linear regression equation provides an estimate of the population regression line Simple Linear Regression Equation (Prediction Line) Slide-15 Estimate of the regression intercept Estimate of the regression slope Estimated (or predicted) Y value for observation i Value of X for observation i The individual random error terms ei have a mean of zero
  8. Sample Data for House Price Model Slide-16 House Price in

    $1000s (Y) Square Feet (X) 245 1400 312 1600 279 1700 308 1875 199 1100 219 1550 405 2350 324 2450 319 1425 255 1700
  9. Assumptions of Regression Department of Statistics, ITS Surabaya Slide-18 Use

    the acronym LINE:  Linearity  The underlying relationship between X and Y is linear  Independence of Errors  Error values are statistically independent  Normality of Error  Error values (ε) are normally distributed for any given value of X  Equal Variance (Homoscedasticity)  The probability distribution of the errors has constant variance
  10. Pitfalls of Regression Analysis Department of Statistics, ITS Surabaya Slide-19

     Lacking an awareness of the assumptions underlying least-squares regression  Not knowing how to evaluate the assumptions  Not knowing the alternatives to least-squares regression if a particular assumption is violated  Using a regression model without knowledge of the subject matter  Extrapolating outside the relevant range
  11. 9/15/2020 20 Aravali College of Engineering And Management Jasana, Tigoan

    Road, Neharpar, Faridabad, Delhi NCR Toll Free Number : 91- 8527538785 Website : www.acem.edu.in