Upgrade to Pro — share decks privately, control downloads, hide ads and more …

WIPC: kHz quasi-periodic oscillations

WIPC: kHz quasi-periodic oscillations

Invited talk at the Women in Physics Canada 2019 conference in Montreal.

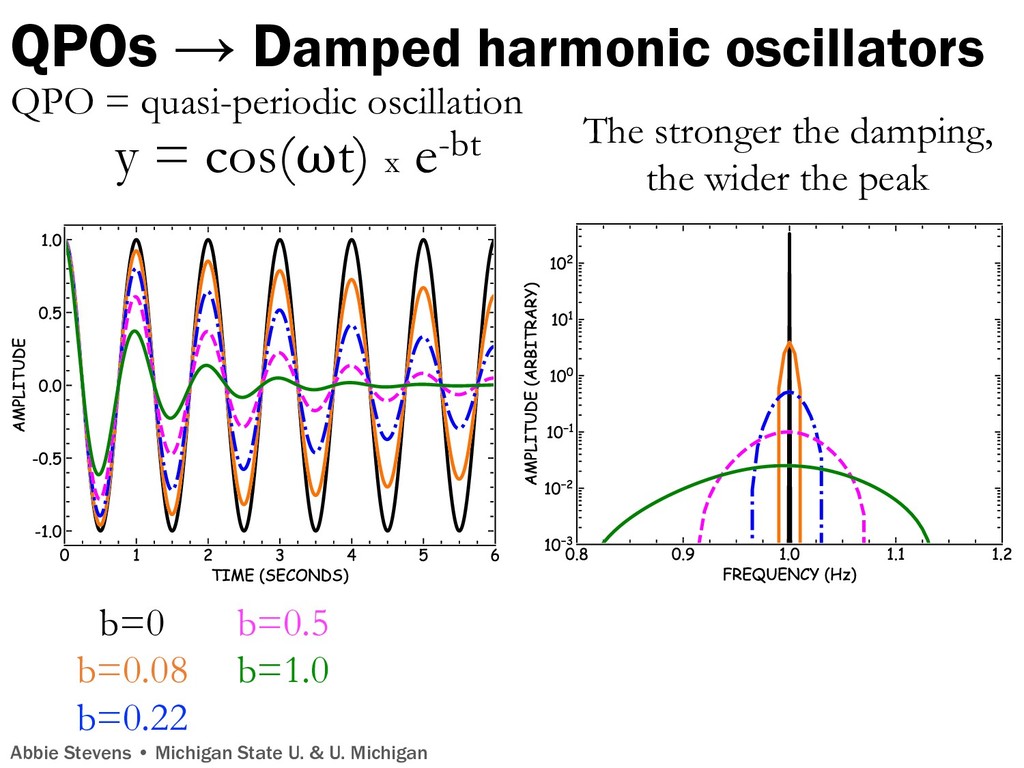
Title: "A Changing Boundary Layer in a kHz Quasi-Periodic Oscillation"

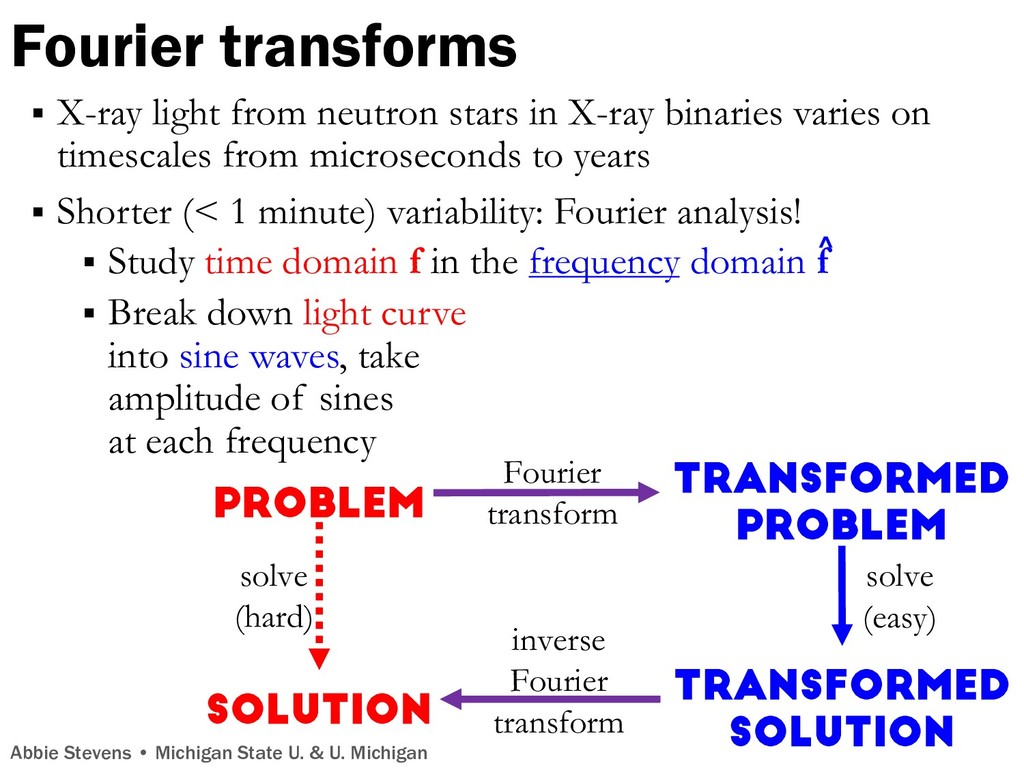
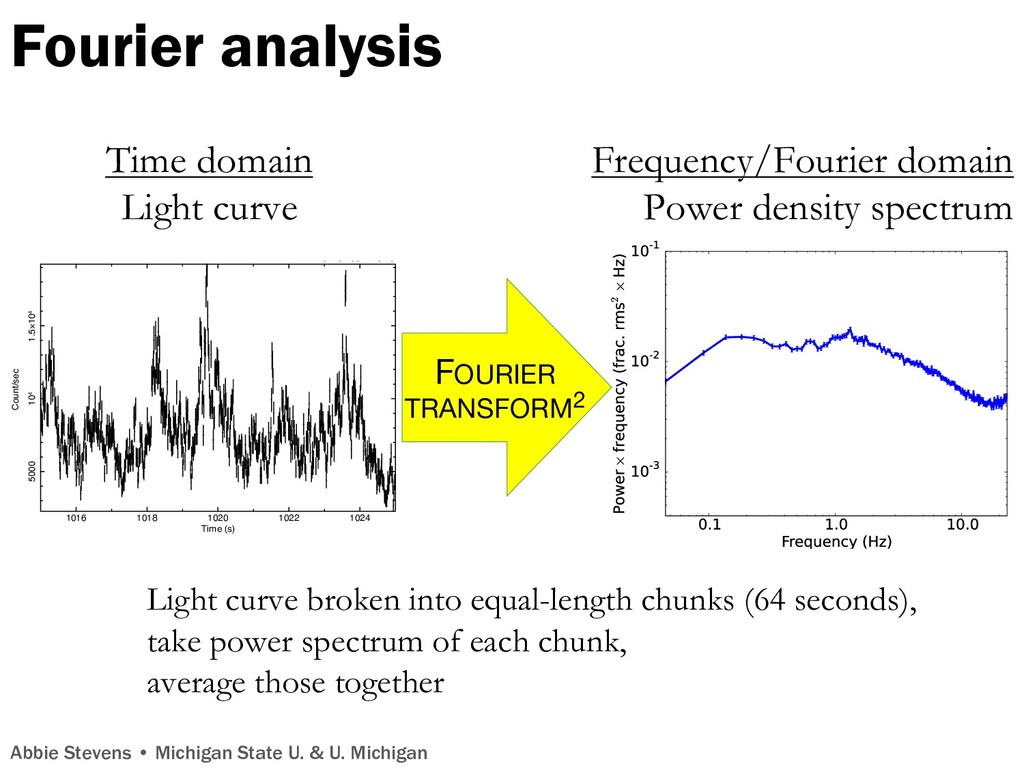
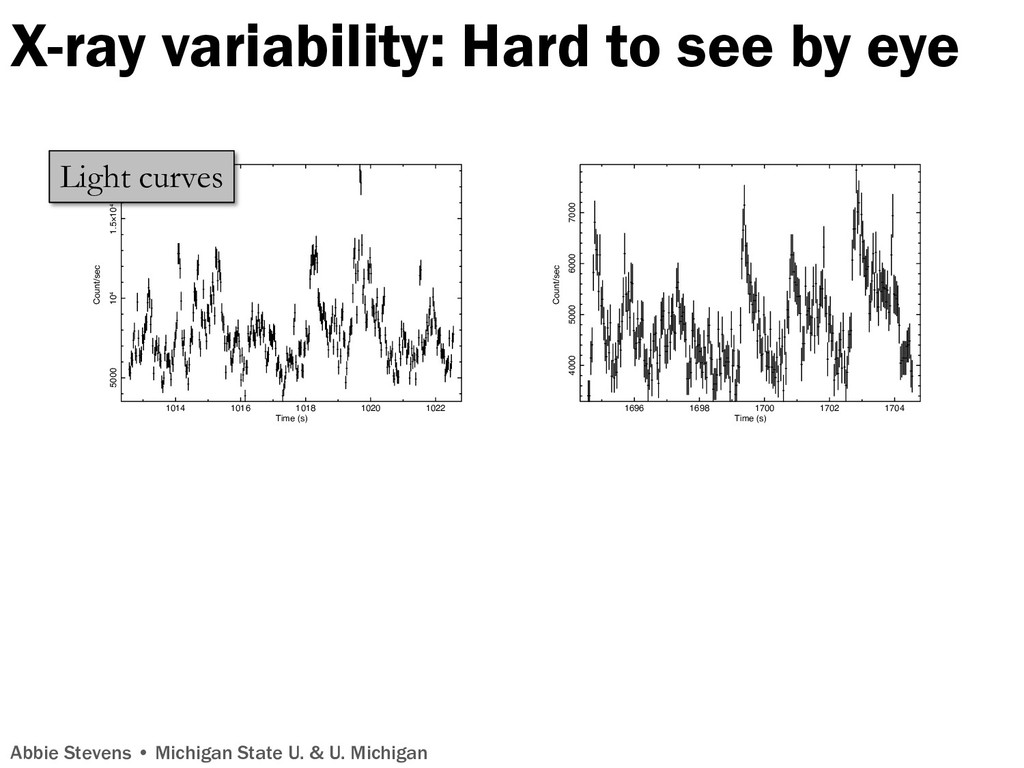
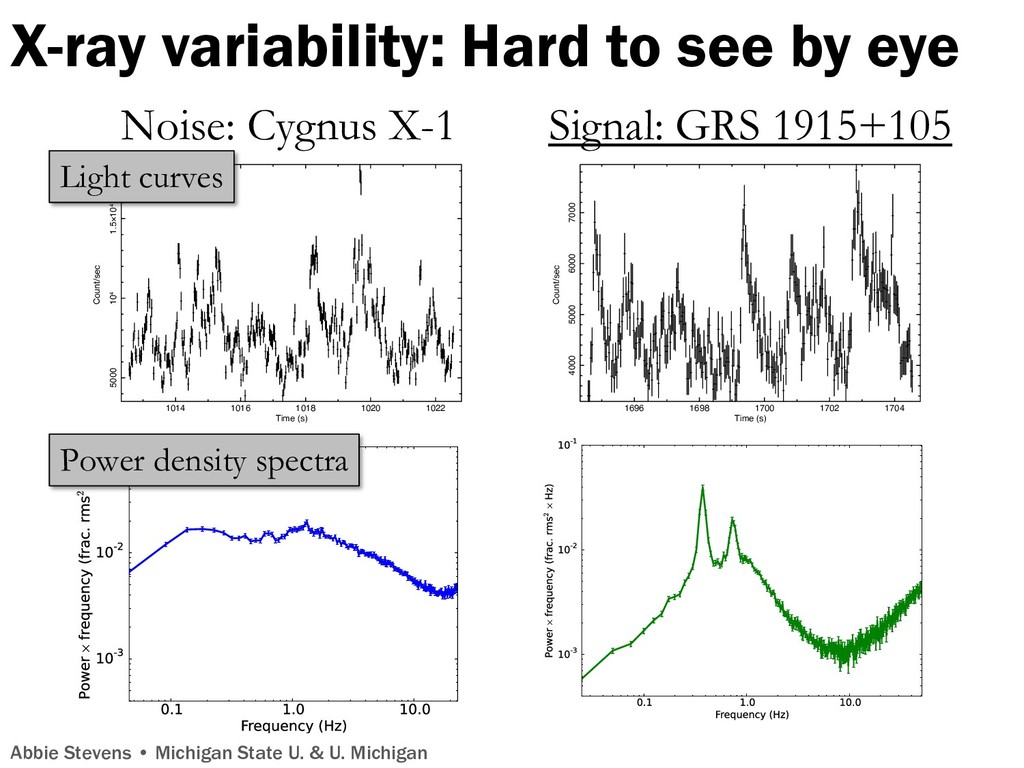
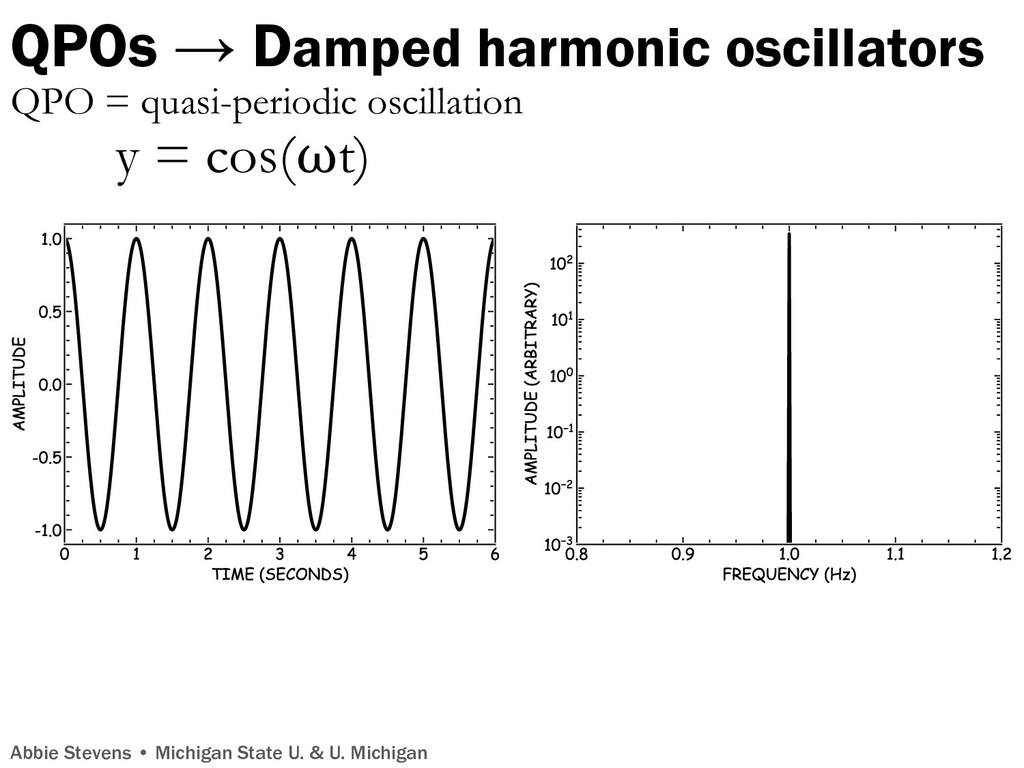
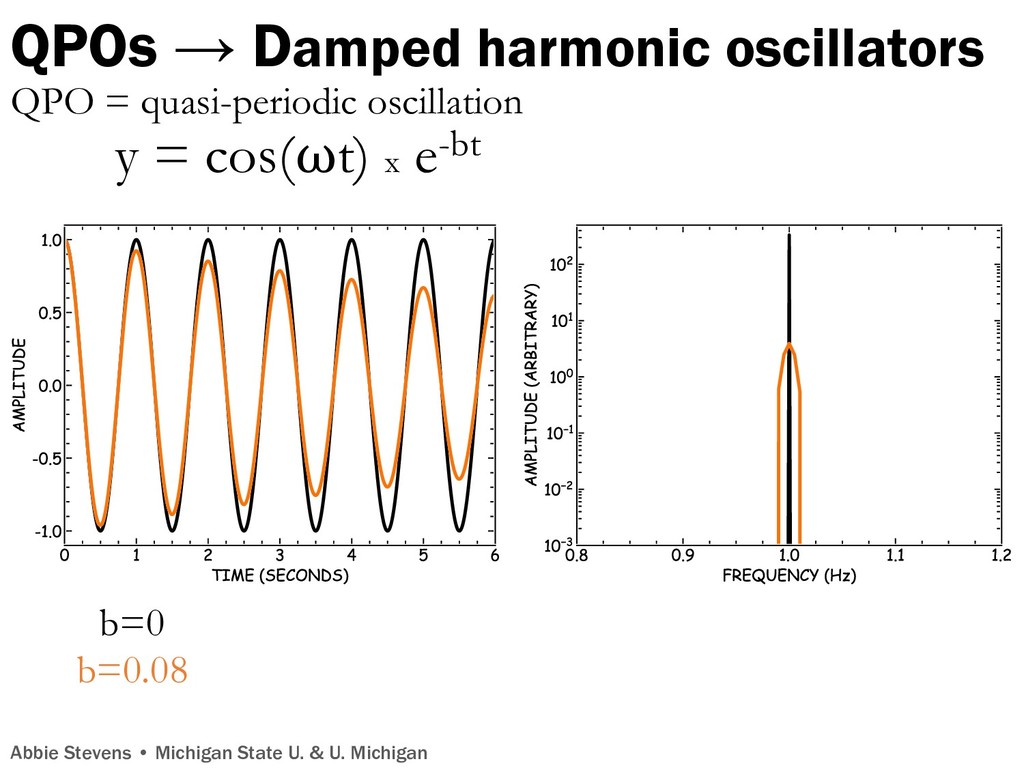
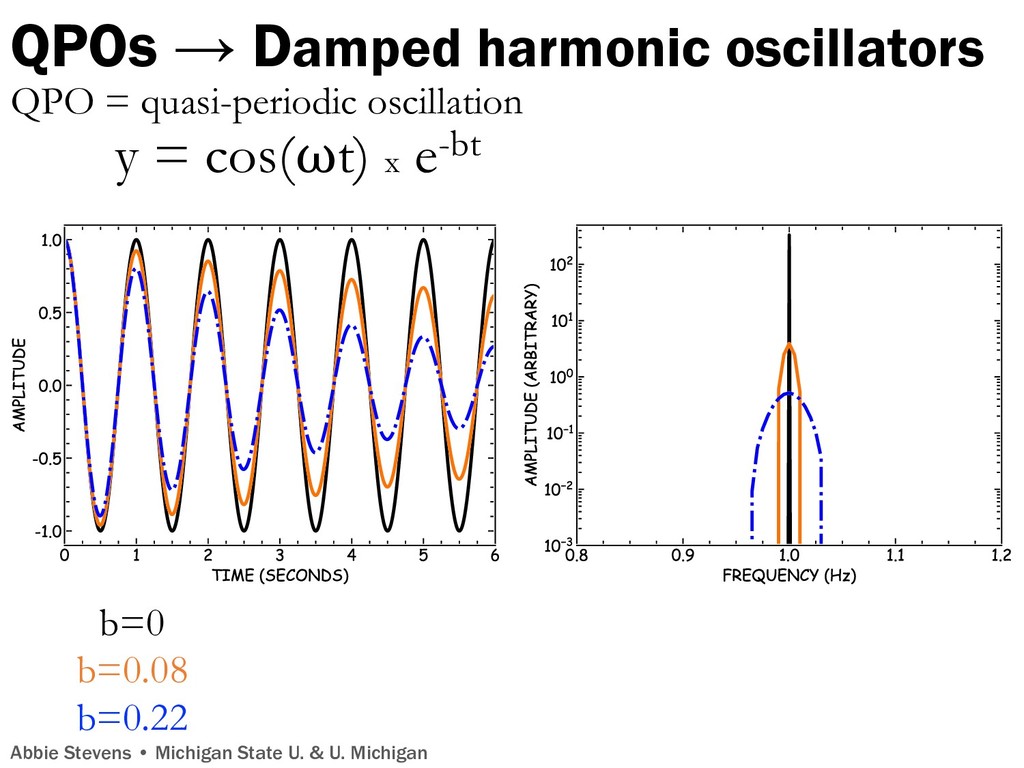
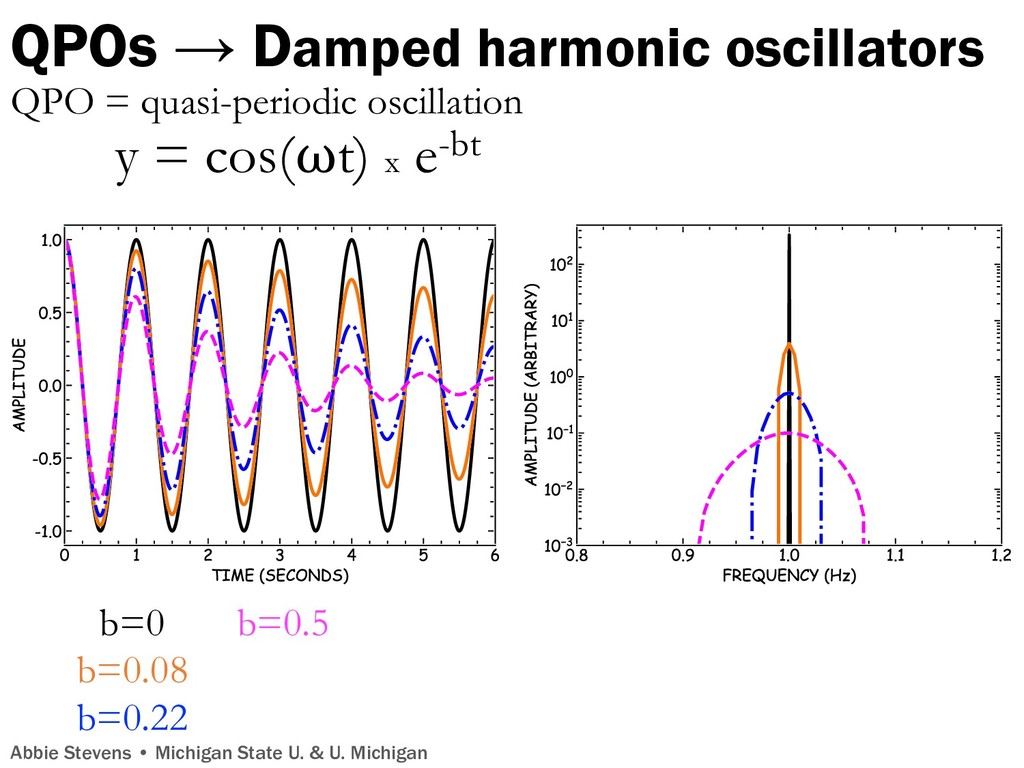
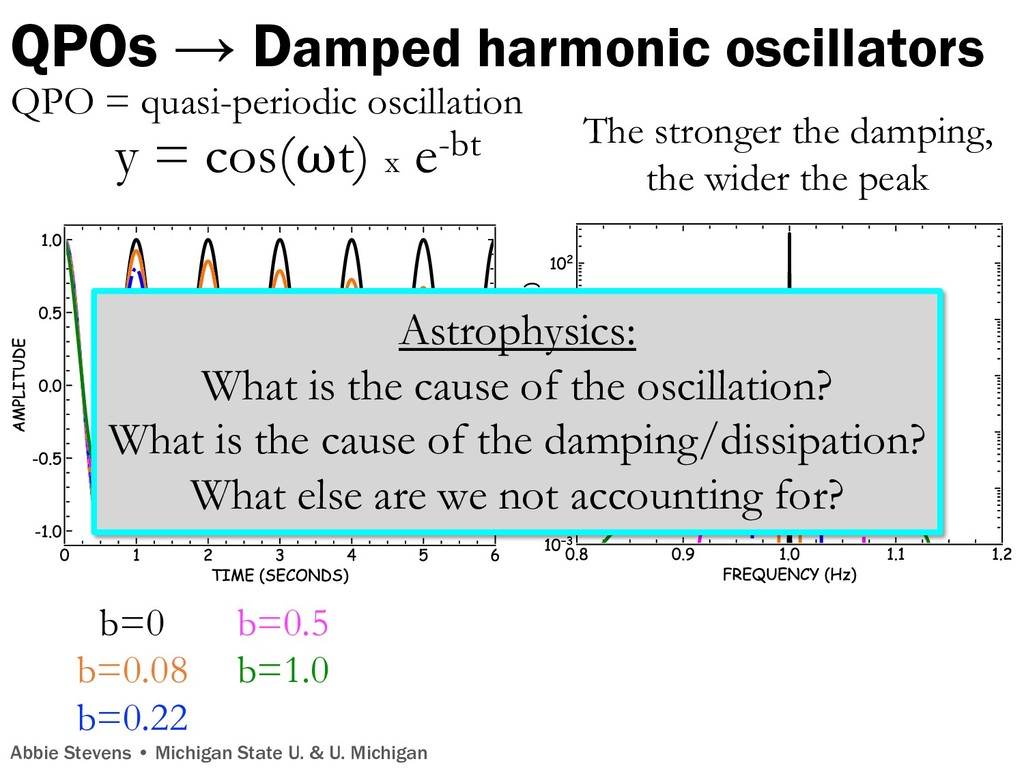
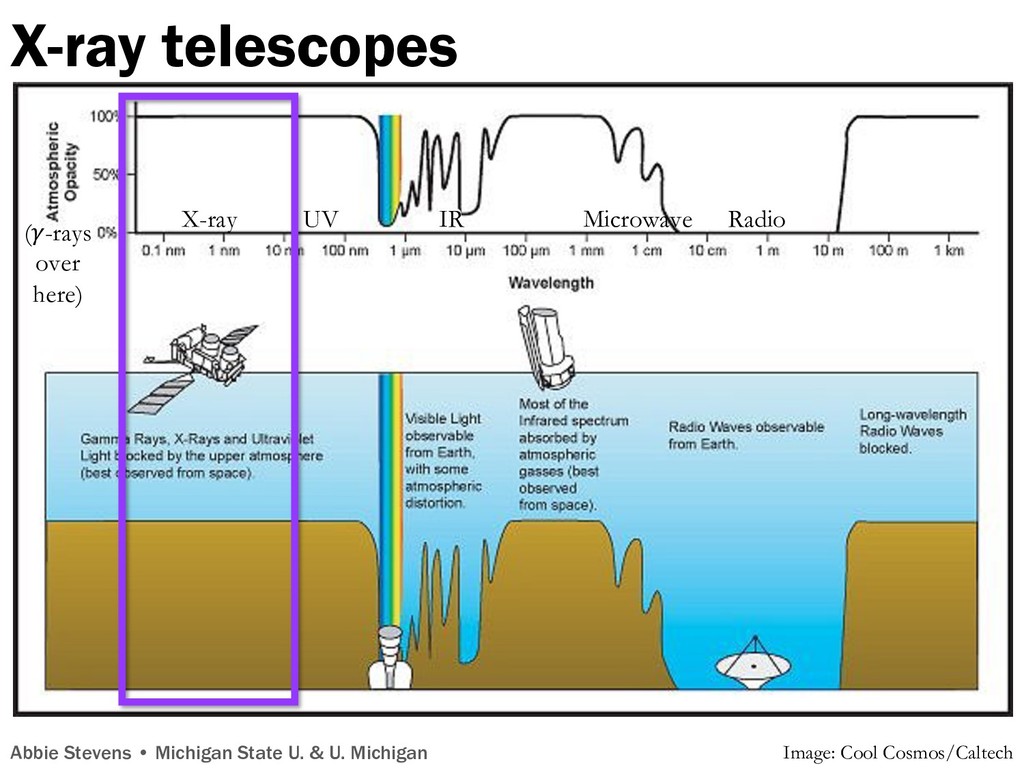
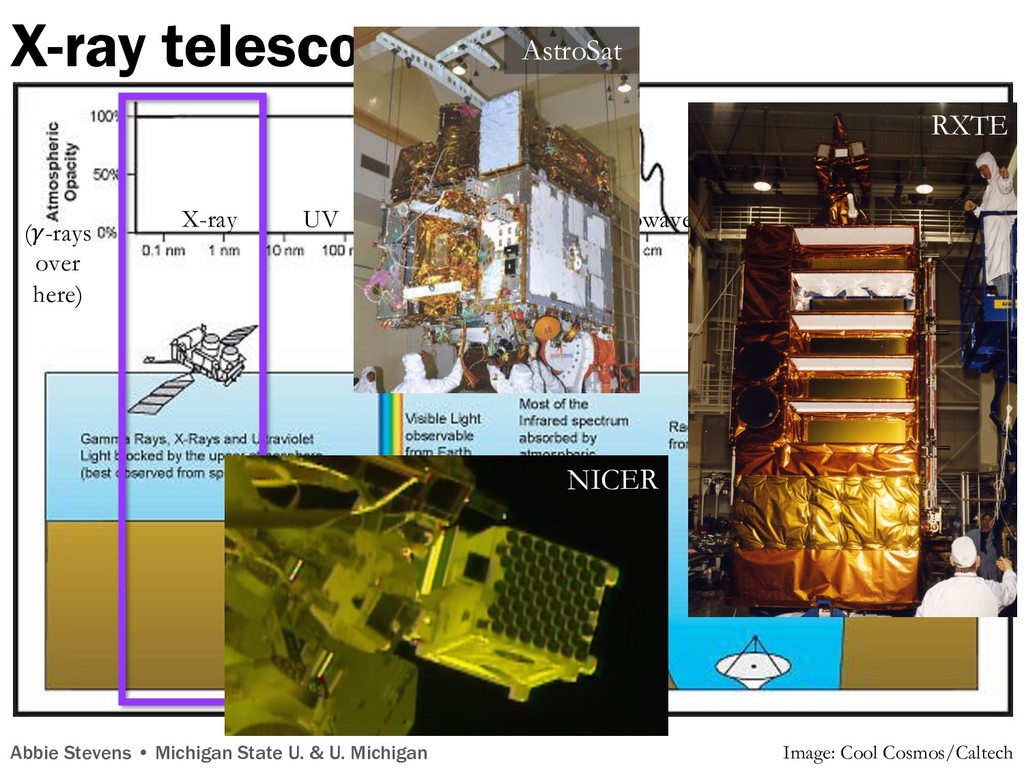
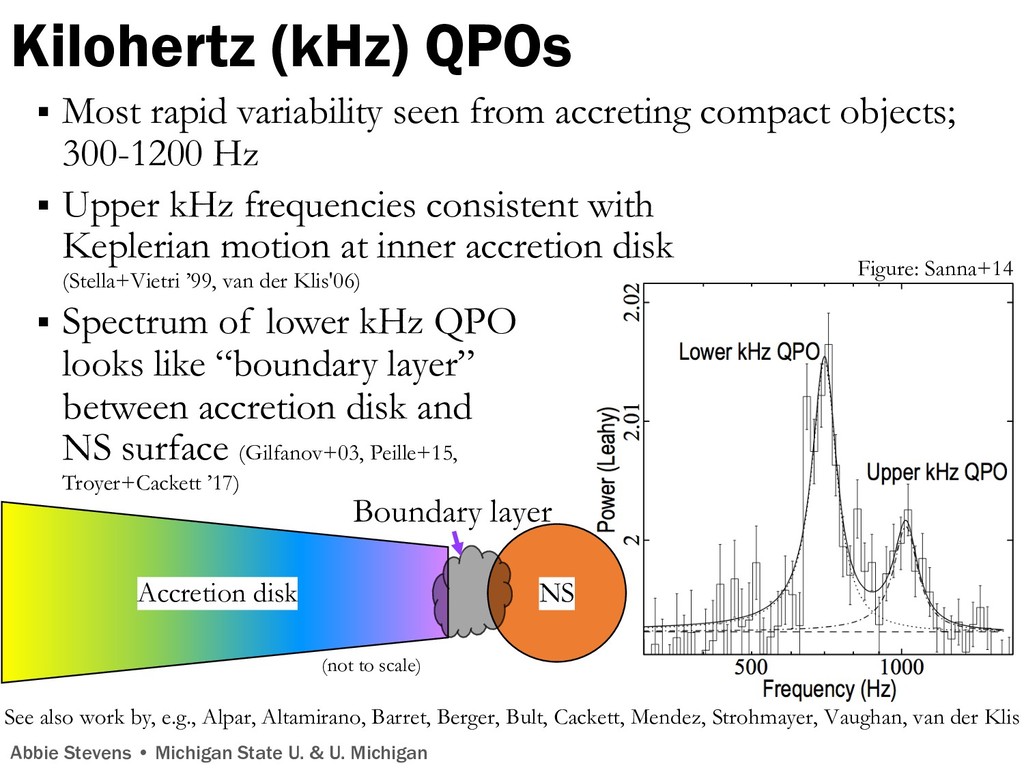
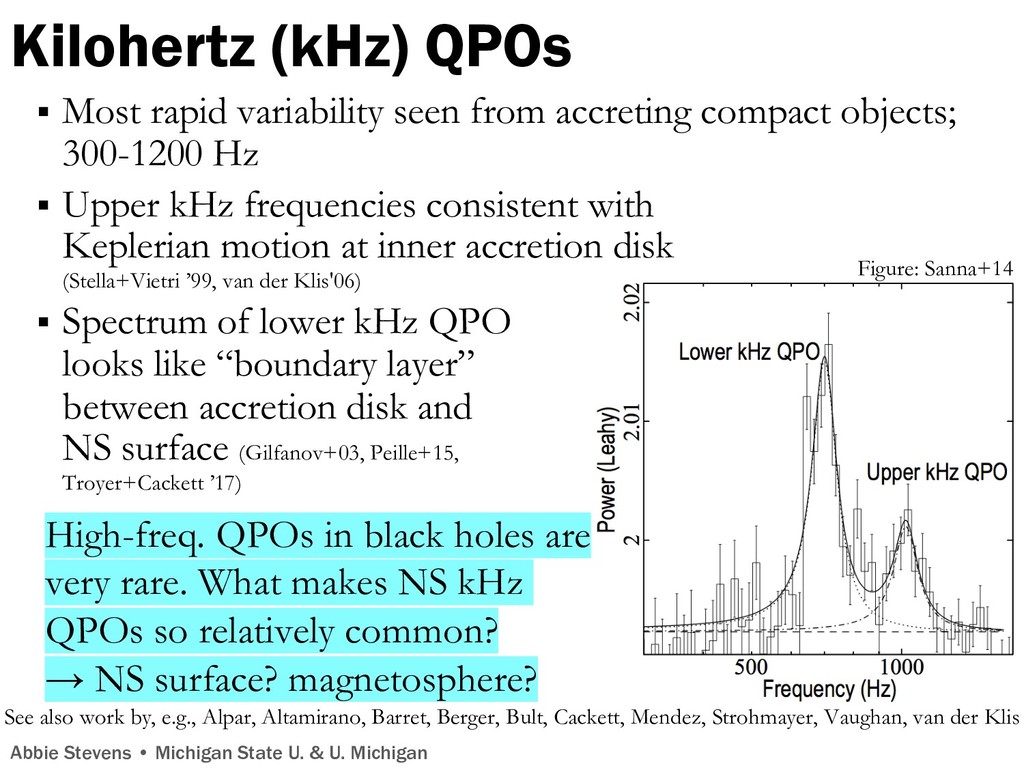
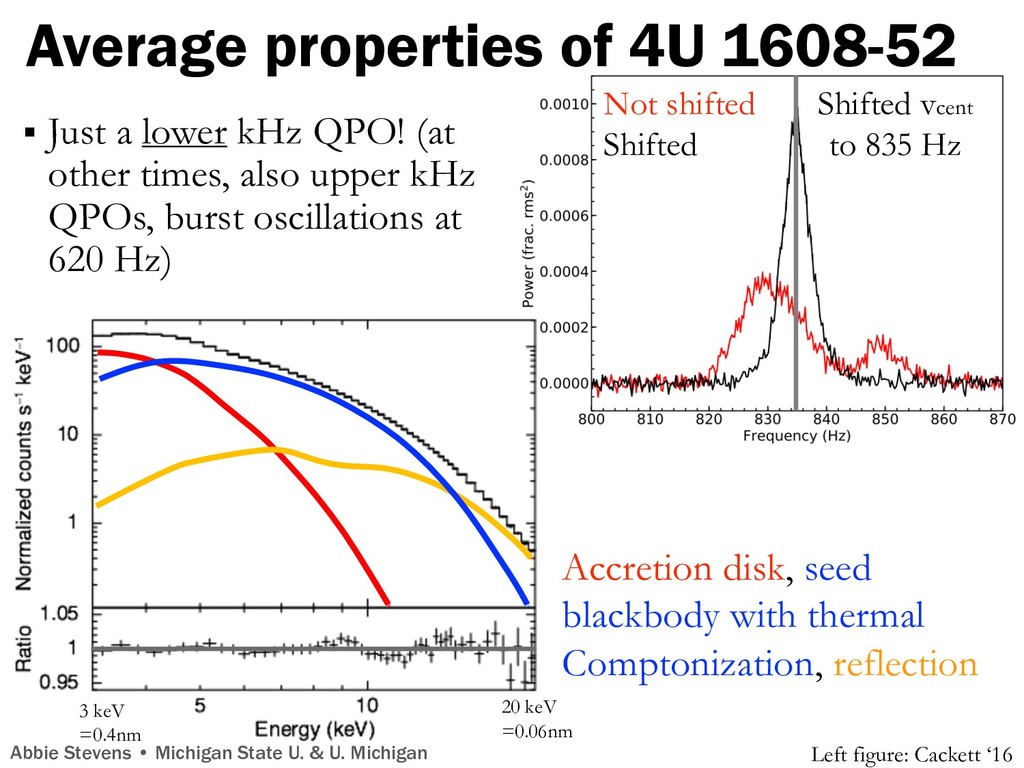
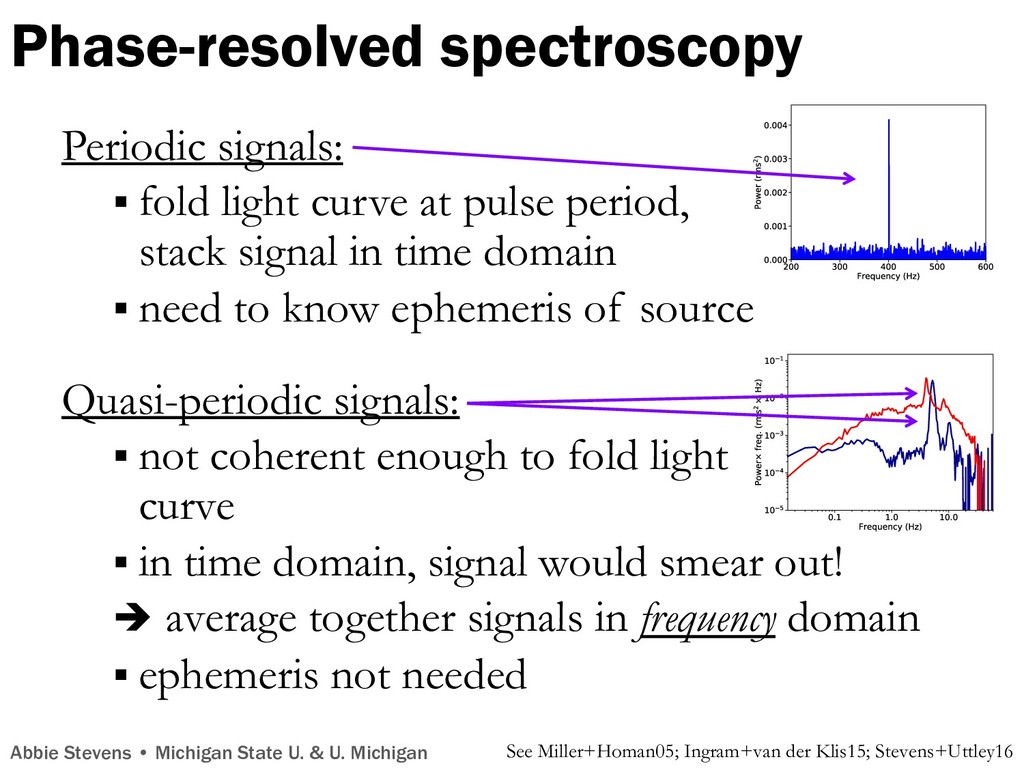
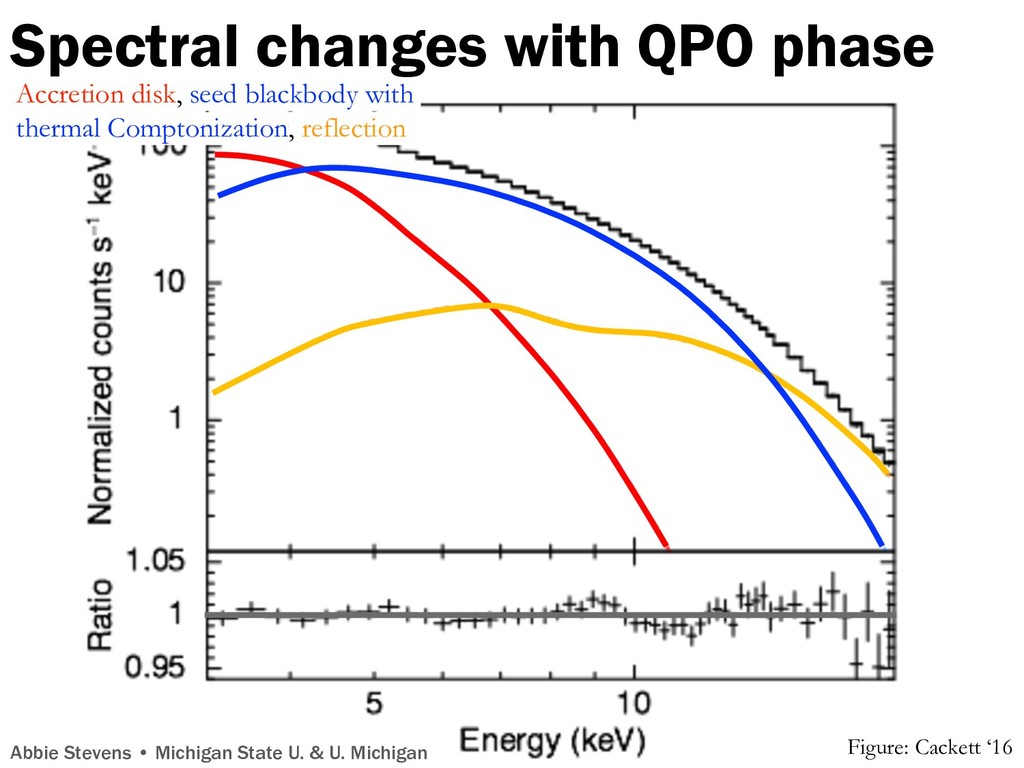
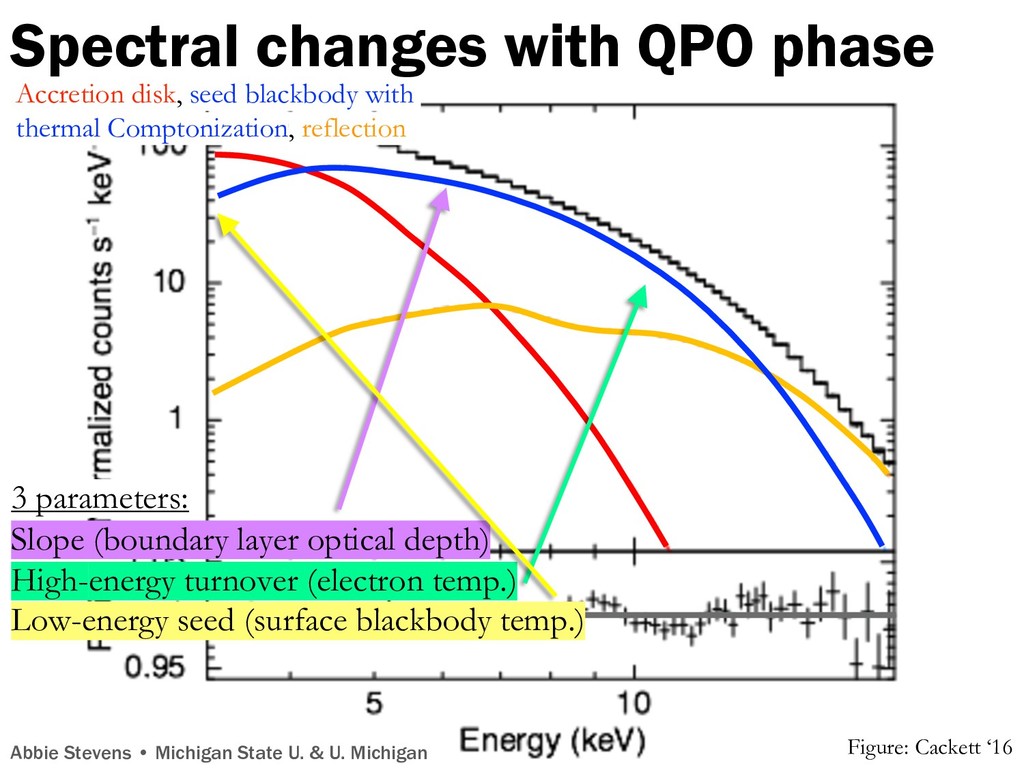
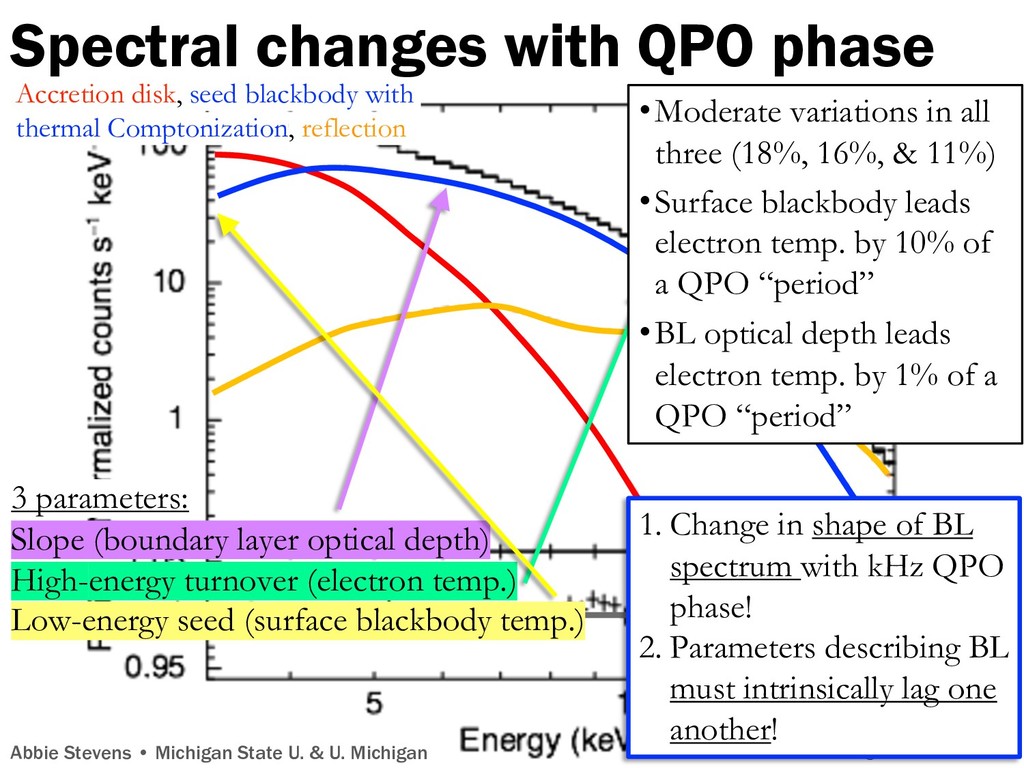
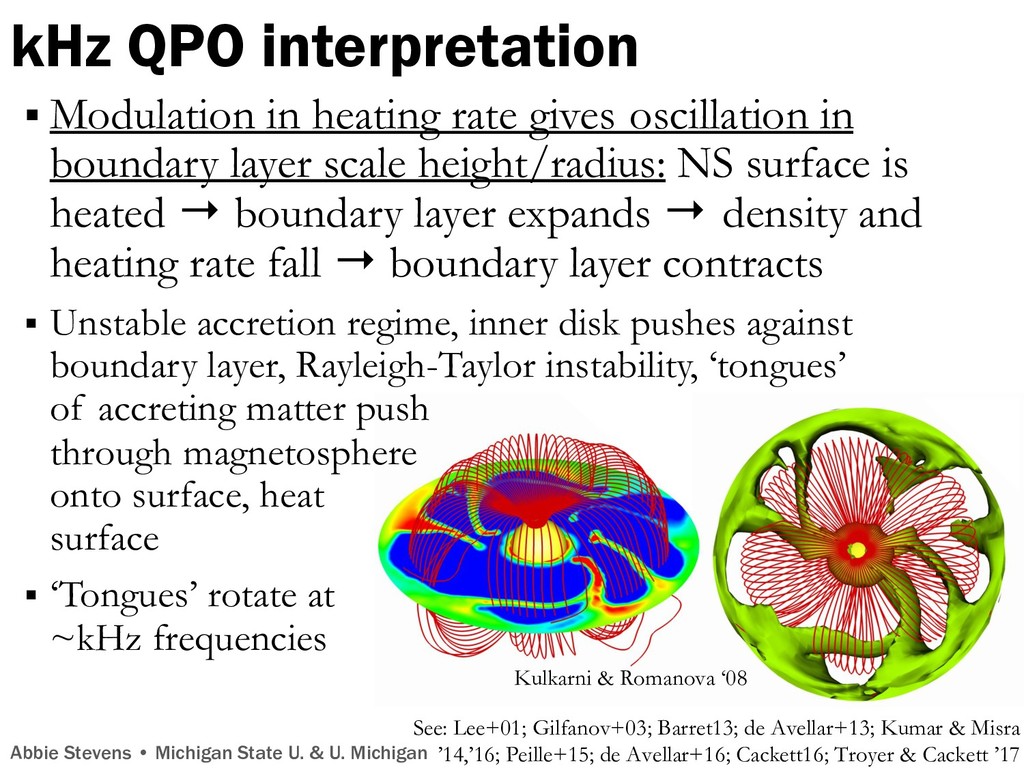
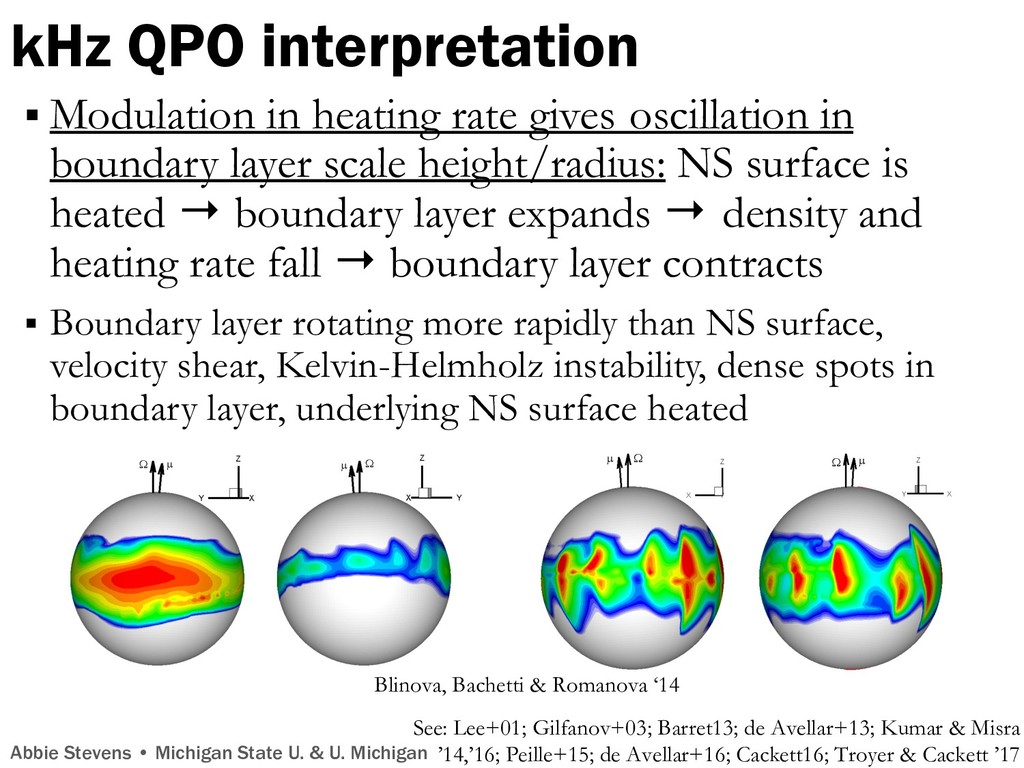
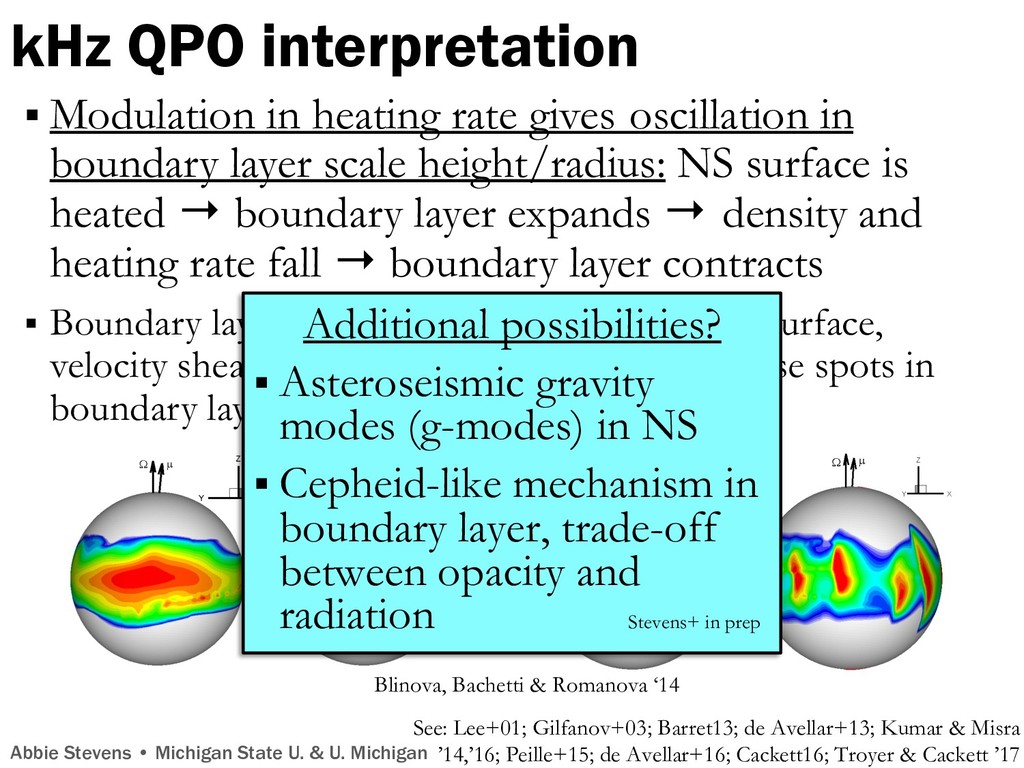
Abstract: Kilohertz quasi-periodic oscillations (kHz QPOs) are the most rapid (quasi-)coherent kind of variability that have been detected in the light curves of accreting neutron star X-ray binaries. Previous spectral-timing work revealed that the lower kHz QPO emission is a Comptonized blackbody, consistent with that expected from the boundary layer between the accretion flow and neutron star surface; further studies indicate that the lower kHz QPO arises from an energy-dependent variability that is more complex than just an overall brightness modulation. To better interpret the spectral variability, we present phase-resolved spectroscopy of a kHz QPO for the first time, using a method based on the energy-dependent cross-correlation function. We find that the Comptonized spectral shape changes as a function of QPO phase, and the variations of the spectral parameters must intrinsically lag one another. These spectral variations could be explained by radial oscillations in the boundary layer caused by unstable accretion onto the neutron star, which could be due to plasma instabilities, asteroseismic modes, or an opacity-radiation trade-off like in the variable star mechanism. These possibilities can be explored in greater detail with current and future X-ray missions such as AstroSat, NICER, eXTP, and STROBE-X.

Dr. Abbie Stevens

June 28, 2019
Tweet

More Decks by Dr. Abbie Stevens

Other Decks in Science

Transcript

  1. A changing boundary layer in a kHz quasi-periodic oscillation Dr.

    Abbie Stevens NSF Astronomy & Astrophysics Postdoctoral Fellow Michigan State University & University of Michigan P. Uttley (U. Amsterdam), D. Altamirano (U. Southampton) [email protected] @abigailstev github.com/abigailstev Image: NASA/JPL-Caltech
  2. Stellar remnants Abbie Stevens • Michigan State U. & U.

    Michigan Image: R.N. Bailey, CC BY 4.0, WikiMedia 2 2 Compact objects
  3. Neutron stars (NSs) Abbie Stevens • Michigan State U. &

    U. Michigan § Compact remnant of a massive star ~8-20 MSun § Radius ~ 12 km (7.5 mi), mass ~ 1.5 MSun § Densityavg. ~ 1014 g/cm3 (the density of an atomic nucleus!) § Surface accelerationgravity ~ 1012 m/s2 § Magnetic field ~ 108 - 1015 Gauss (104-1011 Tesla) § Spin frequencies up to 100’s of Hz Watts+16
  4. Fourier transforms Abbie Stevens • Michigan State U. & U.

    Michigan § X-ray light from neutron stars in X-ray binaries varies on timescales from microseconds to years § Shorter (< 1 minute) variability: Fourier analysis! § Study time domain f in the frequency domain f § Break down light curve into sine waves, take amplitude of sines at each frequency ^ Gif: L. Barbosa via wikiMedia
  5. Fourier transforms Abbie Stevens • Michigan State U. & U.

    Michigan § X-ray light from neutron stars in X-ray binaries varies on timescales from microseconds to years § Shorter (< 1 minute) variability: Fourier analysis! § Study time domain f in the frequency domain f § Break down light curve into sine waves, take amplitude of sines at each frequency ^ Problem solution solve (hard) Transformed problem Transformed solution solve (easy) Fourier transform inverse Fourier transform
  6. Fourier analysis 1016 1018 1020 1022 1024 5000 104 1.5×10⁴

    Count/sec Time (s) Start Time 10168 18:16:52:570 Stop Time 10168 18:17:08:180 Bin time: 0.1562E−01 s Time domain Light curve Frequency/Fourier domain Power density spectrum FOURIER TRANSFORM2 Abbie Stevens • Michigan State U. & U. Michigan Light curve broken into equal-length chunks (64 seconds), take power spectrum of each chunk, average those together
  7. X-ray variability: Hard to see by eye 1014 1016 1018

    1020 1022 5000 104 1.5×10⁴ Count/sec Time (s) CYGNUS_X−1 Start Time 10168 18:16:52:578 Stop Time 10168 18:17:02:547 Bin time: 0.3125E−01 s 1696 1698 1700 1702 1704 4000 5000 6000 7000 Count/sec Time (s) GRS1915+105 Start Time 12339 7:28:14:582 Stop Time 12339 7:28:24:542 Bin time: 0.4000E−01 s Light curves Abbie Stevens • Michigan State U. & U. Michigan
  8. X-ray variability: Hard to see by eye 1014 1016 1018

    1020 1022 5000 104 1.5×10⁴ Count/sec Time (s) CYGNUS_X−1 Start Time 10168 18:16:52:578 Stop Time 10168 18:17:02:547 Bin time: 0.3125E−01 s 1696 1698 1700 1702 1704 4000 5000 6000 7000 Count/sec Time (s) GRS1915+105 Start Time 12339 7:28:14:582 Stop Time 12339 7:28:24:542 Bin time: 0.4000E−01 s Light curves Power density spectra Noise: Cygnus X-1 Signal: GRS 1915+105 Abbie Stevens • Michigan State U. & U. Michigan
  9. QPOs → Damped harmonic oscillators Abbie Stevens • Michigan State

    U. & U. Michigan y = cos(⍵t) QPO = quasi-periodic oscillation
  10. QPOs → Damped harmonic oscillators Abbie Stevens • Michigan State

    U. & U. Michigan y = cos(⍵t) x e-bt b=0 b=0.08 QPO = quasi-periodic oscillation
  11. QPOs → Damped harmonic oscillators Abbie Stevens • Michigan State

    U. & U. Michigan y = cos(⍵t) x e-bt b=0 b=0.08 b=0.22 QPO = quasi-periodic oscillation
  12. QPOs → Damped harmonic oscillators Abbie Stevens • Michigan State

    U. & U. Michigan y = cos(⍵t) x e-bt b=0 b=0.08 b=0.22 b=0.5 QPO = quasi-periodic oscillation
  13. QPOs → Damped harmonic oscillators Abbie Stevens • Michigan State

    U. & U. Michigan y = cos(⍵t) x e-bt The stronger the damping, the wider the peak b=0 b=0.08 b=0.22 b=0.5 b=1.0 QPO = quasi-periodic oscillation
  14. QPOs → Damped harmonic oscillators Abbie Stevens • Michigan State

    U. & U. Michigan y = cos(⍵t) x e-bt The stronger the damping, the wider the peak Astrophysics: What is the cause of the oscillation? What is the cause of the damping/dissipation? What else are we not accounting for? b=0 b=0.08 b=0.22 b=0.5 b=1.0 QPO = quasi-periodic oscillation
  15. X-ray telescopes X-ray UV IR Microwave Radio X-ray telescopes Image:

    Cool Cosmos/Caltech Abbie Stevens • Michigan State U. & U. Michigan (-rays over here) Optical
  16. X-ray telescopes X-ray UV IR Microwave Radio X-ray telescopes Image:

    Cool Cosmos/Caltech Abbie Stevens • Michigan State U. & U. Michigan (-rays over here) Optical AstroSat RXTE NICER
  17. § Most rapid variability seen from accreting compact objects; 300-1200

    Hz § Upper kHz frequencies consistent with Keplerian motion at inner accretion disk (Stella+Vietri ’99, van der Klis'06) § Spectrum of lower kHz QPO looks like “boundary layer” between accretion disk and NS surface (Gilfanov+03, Peille+15, Troyer+Cackett ’17) See also work by, e.g., Alpar, Altamirano, Barret, Berger, Bult, Cackett, Mendez, Strohmayer, Vaughan, van der Klis Figure: Sanna+14 Kilohertz (kHz) QPOs Abbie Stevens • Michigan State U. & U. Michigan NS Accretion disk (not to scale) Boundary layer
  18. § Most rapid variability seen from accreting compact objects; 300-1200

    Hz § Upper kHz frequencies consistent with Keplerian motion at inner accretion disk (Stella+Vietri ’99, van der Klis'06) § Spectrum of lower kHz QPO looks like “boundary layer” between accretion disk and NS surface (Gilfanov+03, Peille+15, Troyer+Cackett ’17) See also work by, e.g., Alpar, Altamirano, Barret, Berger, Bult, Cackett, Mendez, Strohmayer, Vaughan, van der Klis Figure: Sanna+14 Kilohertz (kHz) QPOs Abbie Stevens • Michigan State U. & U. Michigan High-freq. QPOs in black holes are very rare. What makes NS kHz QPOs so relatively common? → NS surface? magnetosphere?
  19. Elapsed time (in 32 second segments) 4U 1608-52 dynamical power

    spectrum Orbit gap in time Abbie Stevens • Michigan State U. & U. Michigan § Archival data from RXTE, March 1996; 6.24 ks (1h44m)
  20. Abbie Stevens • Michigan State U. & U. Michigan Elapsed

    time (in 32 second segments) 4U 1608-52 dynamical power spectrum § Archival data from RXTE, March 1996; 6.24 ks (1h44m)
  21. Average properties of 4U 1608-52 Not shifted Shifted Abbie Stevens

    • Michigan State U. & U. Michigan Shifted vcent to 835 Hz Left figure: Cackett ‘16 Accretion disk, seed blackbody with thermal Comptonization, reflection § Just a lower kHz QPO! (at other times, also upper kHz QPOs, burst oscillations at 620 Hz) 3 keV =0.4nm 20 keV =0.06nm
  22. Quasi-periodic signals: § not coherent enough to fold light curve

    § in time domain, signal would smear out! è average together signals in frequency domain § ephemeris not needed Phase-resolved spectroscopy Periodic signals: § fold light curve at pulse period, stack signal in time domain § need to know ephemeris of source See Miller+Homan05; Ingram+van der Klis15; Stevens+Uttley16 Abbie Stevens • Michigan State U. & U. Michigan
  23. Spectral changes with QPO phase Abbie Stevens • Michigan State

    U. & U. Michigan Figure: Cackett ‘16 Accretion disk, seed blackbody with thermal Comptonization, reflection
  24. Spectral changes with QPO phase Abbie Stevens • Michigan State

    U. & U. Michigan Figure: Cackett ‘16 3 parameters: Slope (boundary layer optical depth) High-energy turnover (electron temp.) Low-energy seed (surface blackbody temp.) Accretion disk, seed blackbody with thermal Comptonization, reflection
  25. Spectral changes with QPO phase Abbie Stevens • Michigan State

    U. & U. Michigan Figure: Cackett ‘16 Accretion disk, seed blackbody with thermal Comptonization, reflection 3 parameters: Slope (boundary layer optical depth) High-energy turnover (electron temp.) Low-energy seed (surface blackbody temp.) •Moderate variations in all three (18%, 16%, & 11%) •Surface blackbody leads electron temp. by 10% of a QPO “period” •BL optical depth leads electron temp. by 1% of a QPO “period” 1. Change in shape of BL spectrum with kHz QPO phase! 2. Parameters describing BL must intrinsically lag one another!
  26. kHz QPO interpretation Abbie Stevens • Michigan State U. &

    U. Michigan See: Lee+01; Gilfanov+03; Barret13; de Avellar+13; Kumar & Misra ’14,’16; Peille+15; de Avellar+16; Cackett16; Troyer & Cackett ’17 § Modulation in heating rate gives oscillation in boundary layer scale height/radius: NS surface is heated → boundary layer expands → density and heating rate fall → boundary layer contracts
  27. kHz QPO interpretation Kulkarni & Romanova ‘08 Abbie Stevens •

    Michigan State U. & U. Michigan See: Lee+01; Gilfanov+03; Barret13; de Avellar+13; Kumar & Misra ’14,’16; Peille+15; de Avellar+16; Cackett16; Troyer & Cackett ’17 § Modulation in heating rate gives oscillation in boundary layer scale height/radius: NS surface is heated → boundary layer expands → density and heating rate fall → boundary layer contracts § Unstable accretion regime, inner disk pushes against boundary layer, Rayleigh-Taylor instability, ‘tongues’ of accreting matter push through magnetosphere onto surface, heat surface § ‘Tongues’ rotate at ~kHz frequencies
  28. § Modulation in heating rate gives oscillation in boundary layer

    scale height/radius: NS surface is heated → boundary layer expands → density and heating rate fall → boundary layer contracts § Boundary layer rotating more rapidly than NS surface, velocity shear, Kelvin-Helmholz instability, dense spots in boundary layer, underlying NS surface heated See: Lee+01; Gilfanov+03; Barret13; de Avellar+13; Kumar & Misra ’14,’16; Peille+15; de Avellar+16; Cackett16; Troyer & Cackett ’17 kHz QPO interpretation Blinova, Bachetti & Romanova ‘14 Abbie Stevens • Michigan State U. & U. Michigan
  29. § Modulation in heating rate gives oscillation in boundary layer

    scale height/radius: NS surface is heated → boundary layer expands → density and heating rate fall → boundary layer contracts § Boundary layer rotating more rapidly than NS surface, velocity shear, Kelvin-Helmholz instability, dense spots in boundary layer, underlying NS surface heated See: Lee+01; Gilfanov+03; Barret13; de Avellar+13; Kumar & Misra ’14,’16; Peille+15; de Avellar+16; Cackett16; Troyer & Cackett ’17 kHz QPO interpretation Blinova, Bachetti & Romanova ‘14 Abbie Stevens • Michigan State U. & U. Michigan Additional possibilities? § Asteroseismic gravity modes (g-modes) in NS § Cepheid-like mechanism in boundary layer, trade-off between opacity and radiation Stevens+ in prep
  30. Stingray: spectral-timing software § Open-source, community-driven and -developed, python, Astropy-affiliated

    package § Stingray: Python library of analysis tools § HENDRICS: shell scripting interface § DAVE: graphical user interface § Tutorials in Jupyter(/iPython) notebooks § github.com/StingraySoftware § Leads: D. Huppenkothen, M. Bachetti, A.L. Stevens, S. Migliari, P. Balm § Google Summer of Code students: S. Sharma (‘18); O. Hammad and H. Rashid (‘17); U. Khan, H. Mishra, and D. Sodhi (‘16) § Other major contributors: E. Martinez Ribeiro, R. Valles Abbie Stevens • Michigan State U. & U. Michigan → Now published: Huppenkothen et al. 2019, ApJ, in press!
  31. Summary § Neutron stars and black holes are extreme §

    X-ray binaries are awesome! One of the best tools to study matter in strong gravitational fields § kHz QPOs can probe interactions between inner accretion disk, boundary layer, and NS surface § Using X-ray spectral-timing analysis on archival data to decipher emission mechanisms for QPOs § “Lower” kHz QPOs: oscillation in scale height/ radius of neutron star boundary layer § StingraySoftware.github.io spectral-timing software GitHub: abigailStev Email: [email protected] Twitter: @abigailStev ✉ Abbie Stevens • Michigan State U. & U. Michigan