Upgrade to Pro — share decks privately, control downloads, hide ads and more …

Advanced Maps Techniques

Advanced Maps Techniques

Droidcon Paris 2015 Talk

Adrien Couque

November 09, 2015
Tweet

More Decks by Adrien Couque

Other Decks in Technology

Transcript

  1. Types of maps “Ten years ago, maps were all about

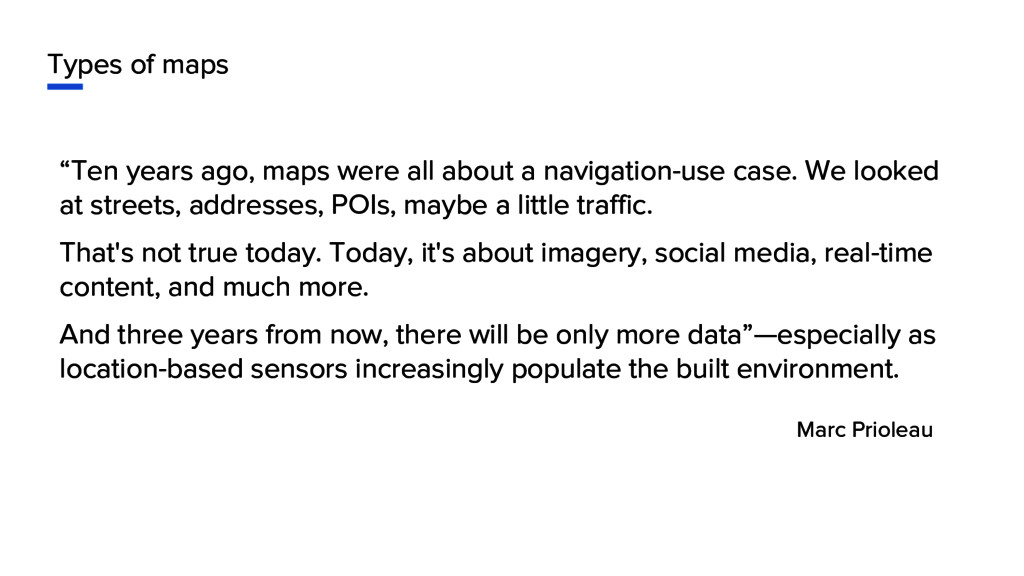
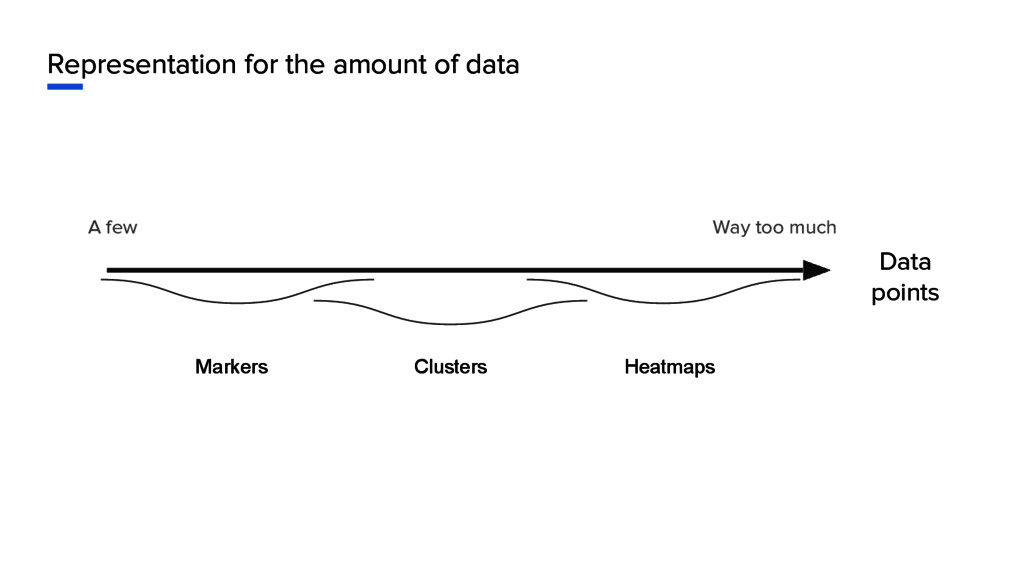
    a navigation-use case. We looked at streets, addresses, POIs, maybe a little traffic. That's not true today. Today, it's about imagery, social media, real-time content, and much more. And three years from now, there will be only more data”—especially as location-based sensors increasingly populate the built environment. Marc Prioleau
  2. ParisData datasets • Museums 59 elements, 39 kB • Theaters

    88 elements, 38 kB • Schools 670 elements, 285 kB • Green spaces 942 elements, 5.9 MB • Addresses 145459 elements, 88.2 MB • ...
  3. General Transit Feed Specification (GTFS) Standard format for public transportation

    data. Zip archive of CSV files: • agency.txt • stops.txt • routes.txt • trips.txt • stop_times.txt • calendar.txt Optional: fares, transfers, shapes (map)
  4. Be careful about the licenses Open Database License (ODbL): Constraints:

    attribute, share-alike (copyleft), keep open Used by: OpenStreetMap, ParisData, Stif Etalab / License ouverte: Constraints: attribute Used by: ParisData License NIO: Constraints: ? Used by: Navitia
  5. Data representation: clusters ClusterManager clusterManager = new ClusterManager<MyItem>(this, getMap()); getMap().setOnCameraChangeListener(mClusterManager);

    InputStream inputStream = getResources().openRawResource(R.raw.radar_search); List<MyItem> items = new MyItemReader().read(inputStream); mClusterManager.addItems(items);
  6. Data representation: areas Standards: • GeoJSON (ParisData) • • •

    • WKT (Navitia : Stif) • KML (Google Earth)
  7. Data representation: GeoJSON try { GeoJsonLayer layer = new GeoJsonLayer(map,

    new JSONObject("...")); layer.addLayerToMap(); } catch (JSONException e) { e.printStackTrace(); }
  8. List<LatLng> coordinates = getCoordinatesList(); HeatmapTileProvider provider = new HeatmapTileProvider.Builder() .data(coordinates)

    .build(); TileOverlayOptions overlayOptions = new TileOverlayOptions().tileProvider(provider); getMap().addTileOverlay(overlayOptions);
  9. Representation for the amount of data A few Way too

    much Data points Markers Clusters Heatmaps
  10. The Great Subway Map War of 1978: http://www.theverge.com/2015/10/29/9630862/new-york-city- subway-maps-mta-google-gps Arriving

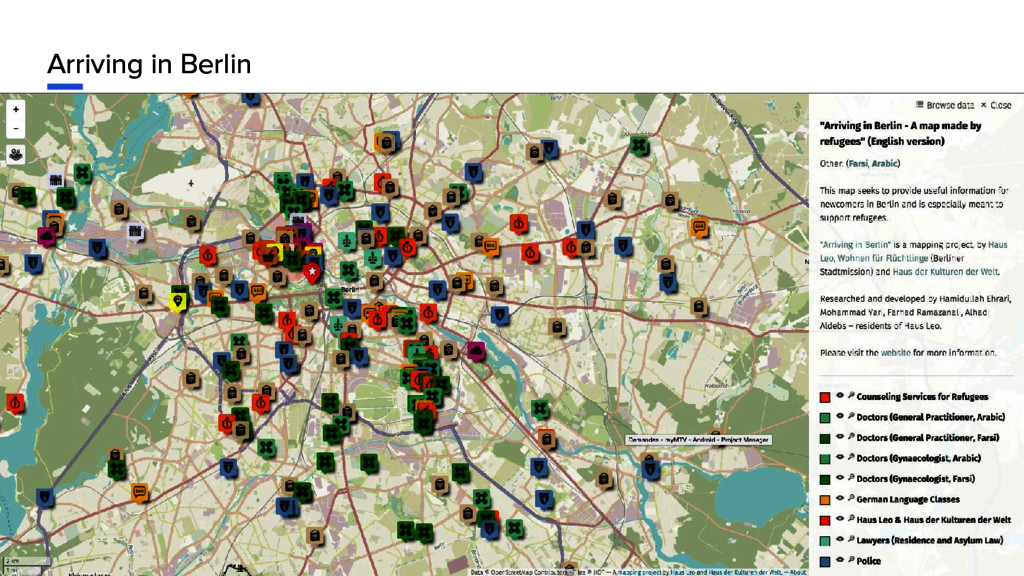
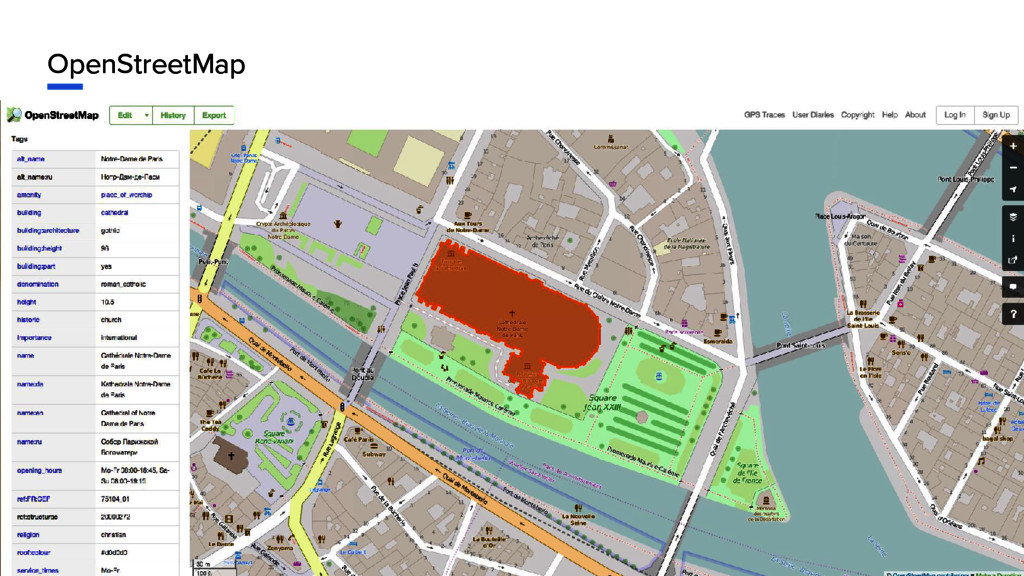
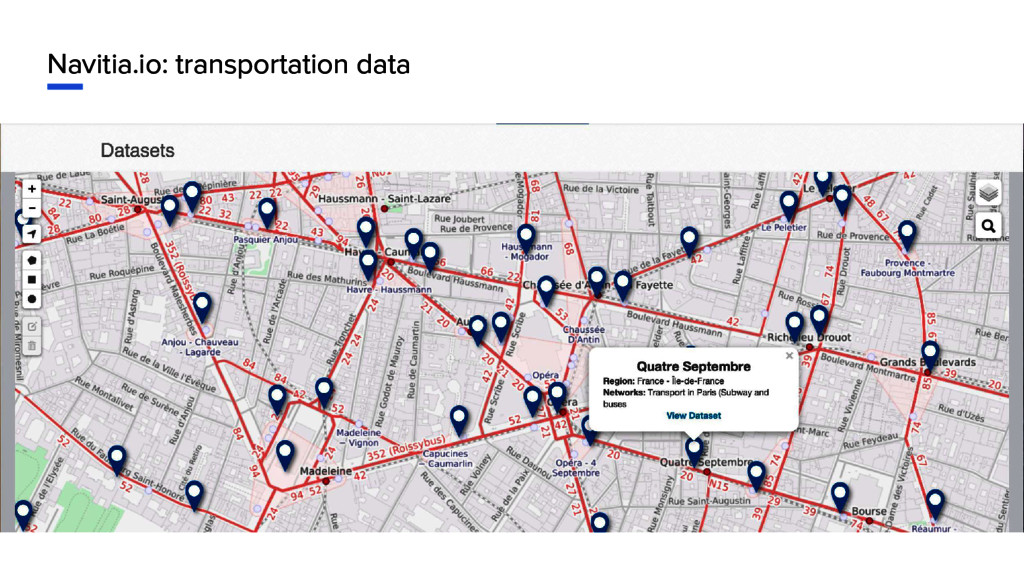
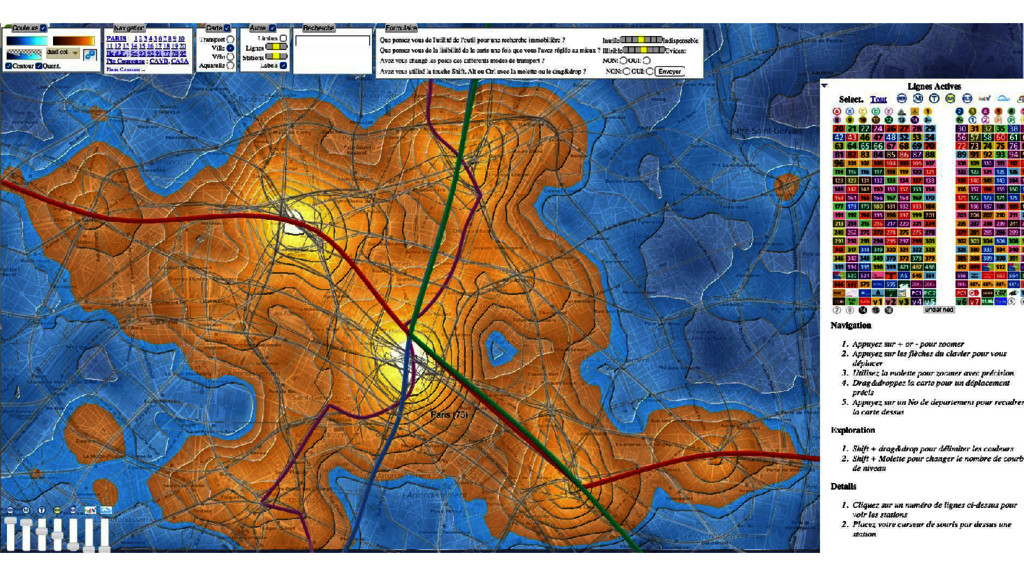
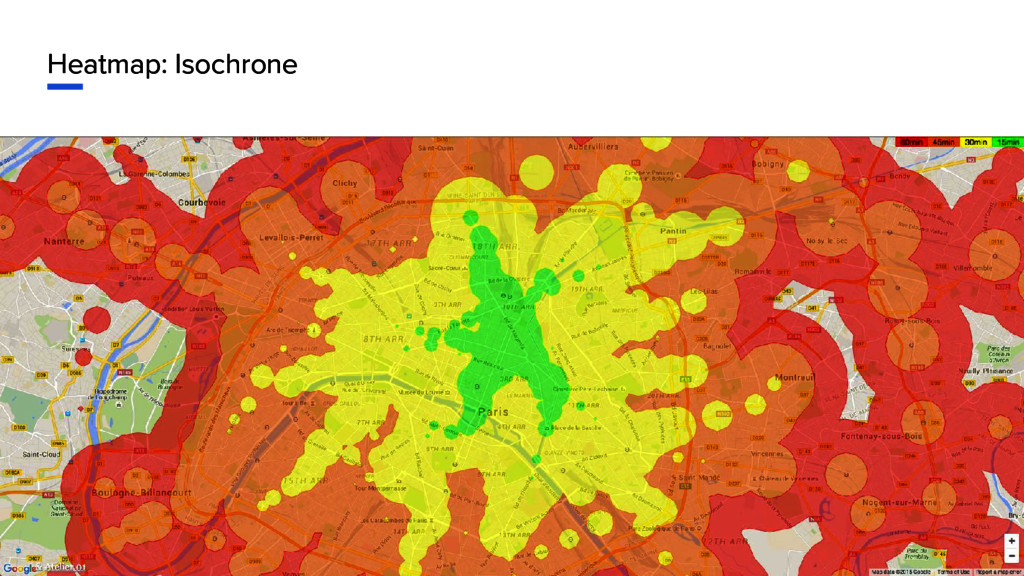
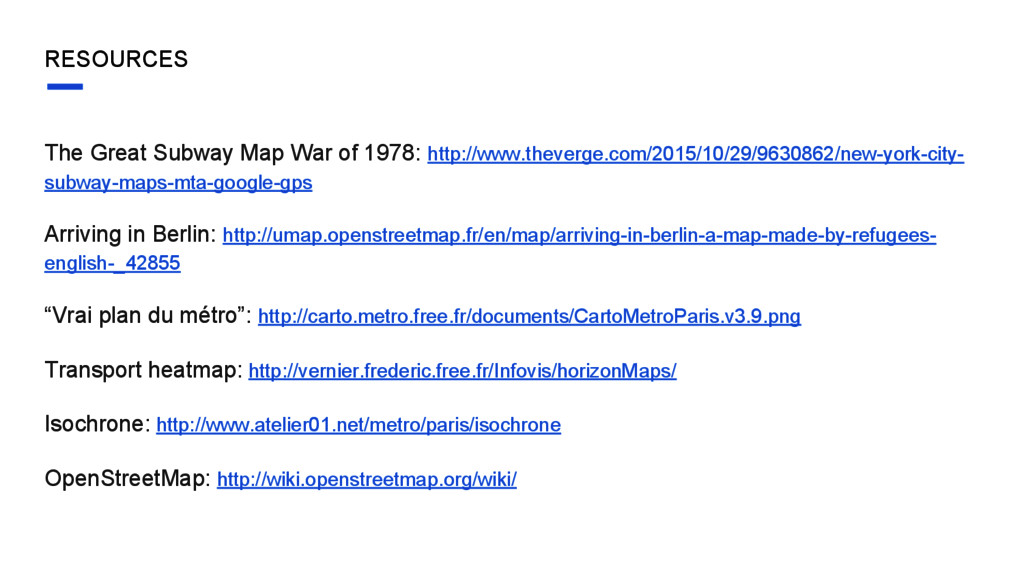
    in Berlin: http://umap.openstreetmap.fr/en/map/arriving-in-berlin-a-map-made-by-refugees- english-_42855 “Vrai plan du métro”: http://carto.metro.free.fr/documents/CartoMetroParis.v3.9.png Transport heatmap: http://vernier.frederic.free.fr/Infovis/horizonMaps/ Isochrone: http://www.atelier01.net/metro/paris/isochrone OpenStreetMap: http://wiki.openstreetmap.org/wiki/ RESOURCES