Upgrade to Pro — share decks privately, control downloads, hide ads and more …

Using Maps, Models and Open Science in Plant Pathology

Using Maps, Models and Open Science in Plant Pathology

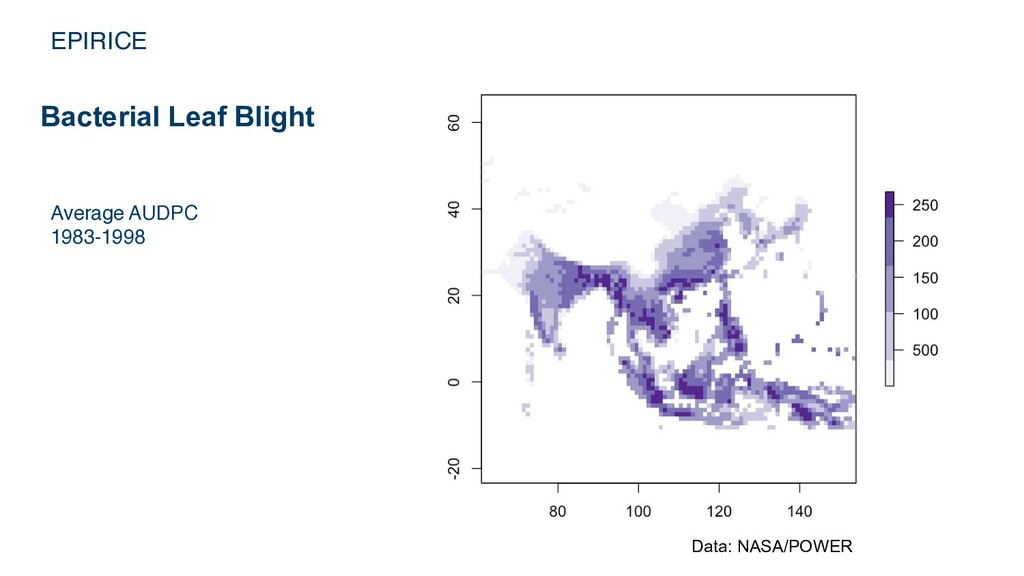
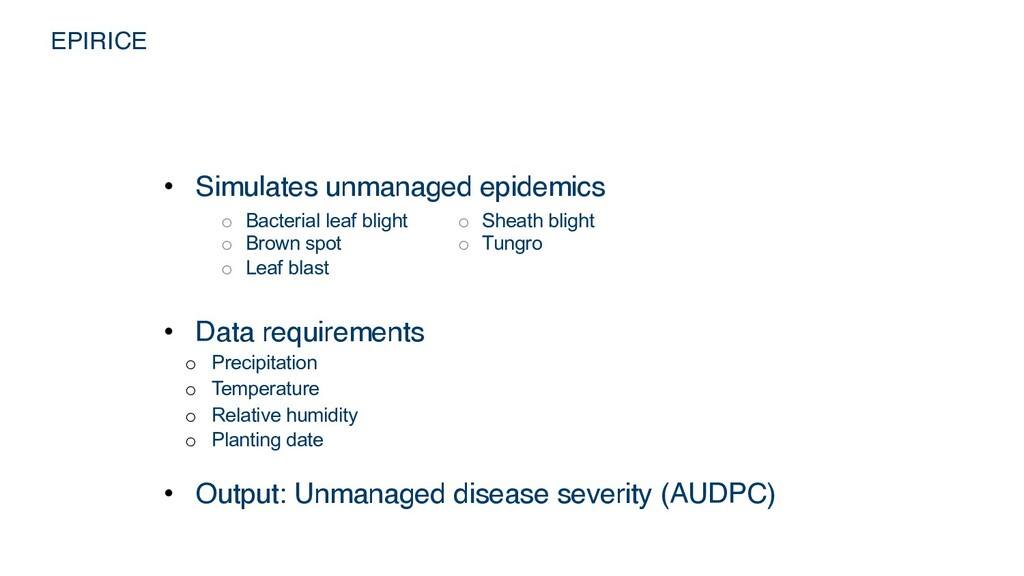
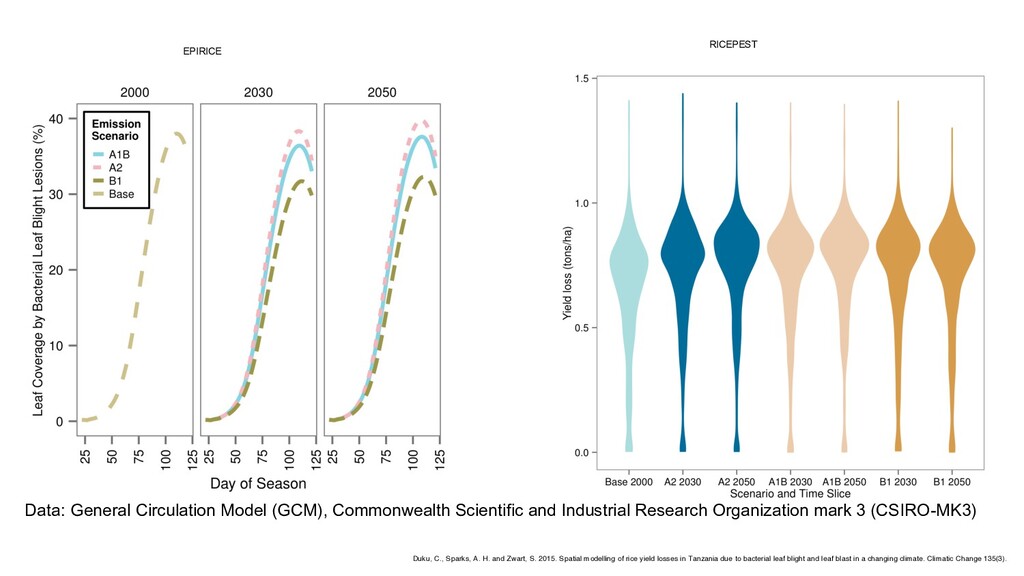
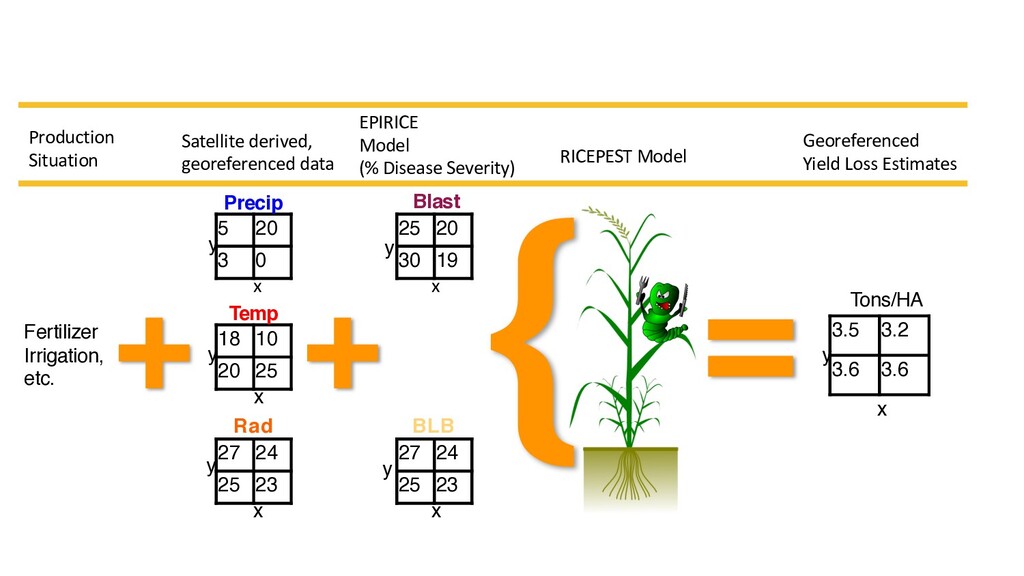
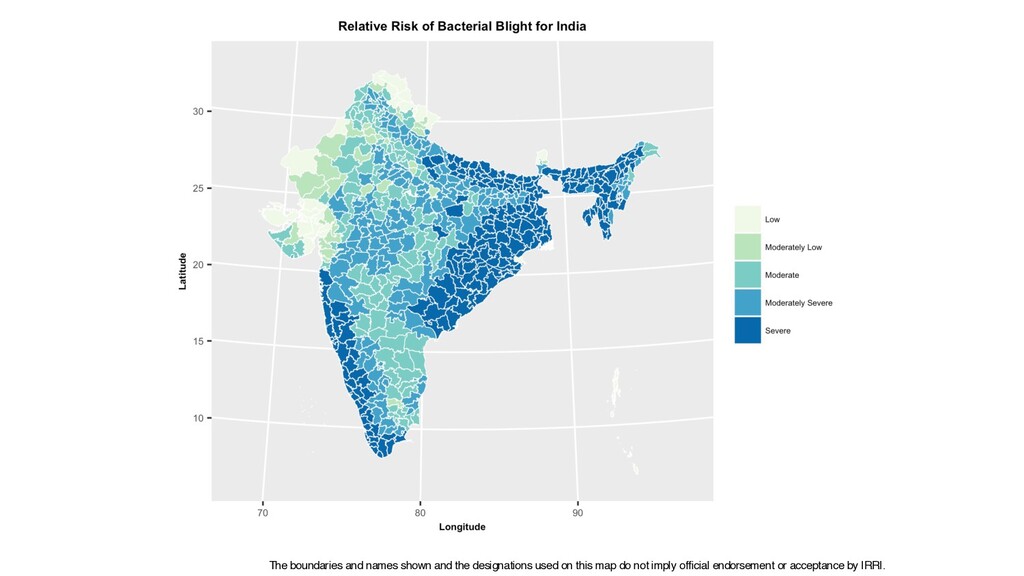
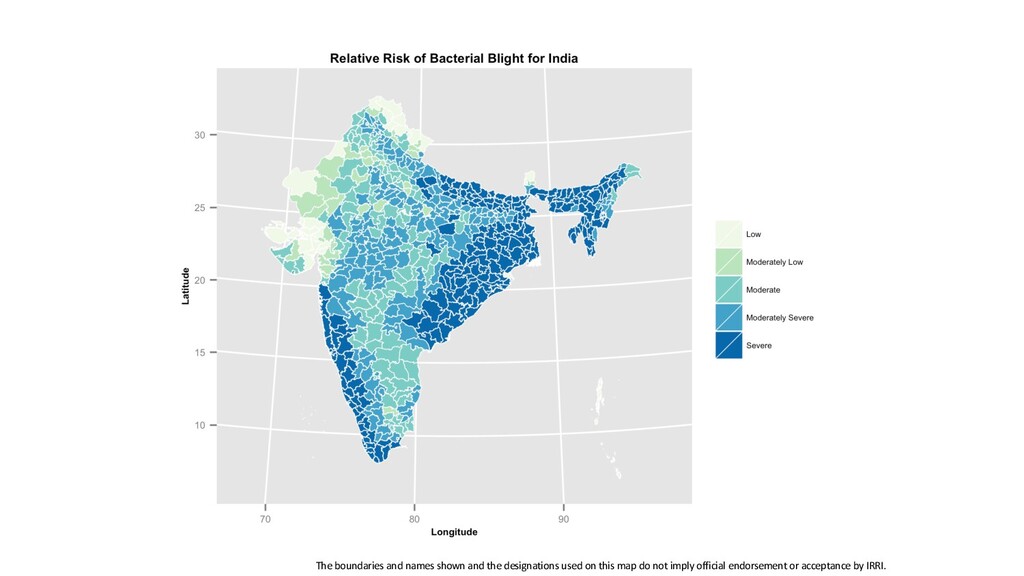
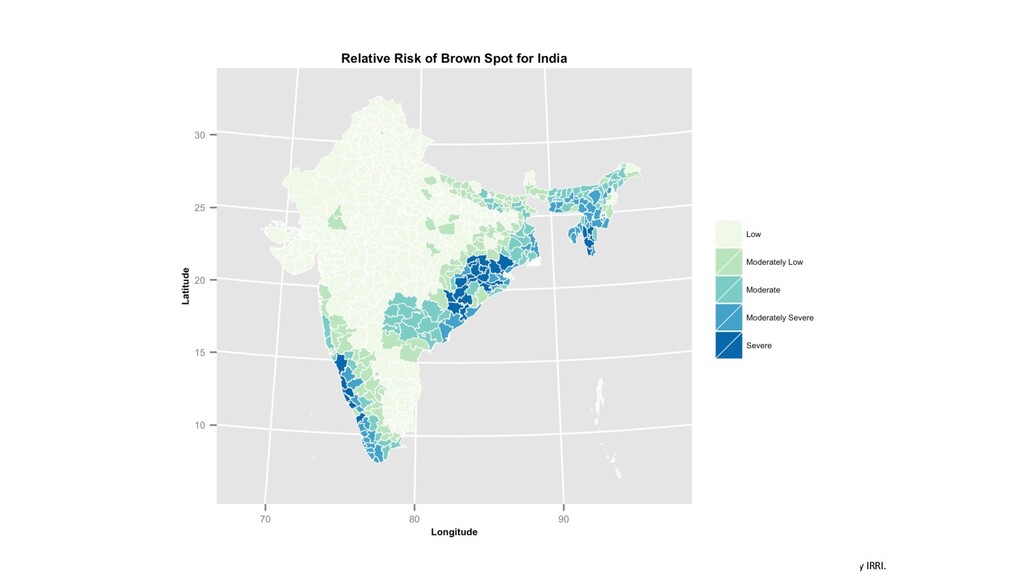
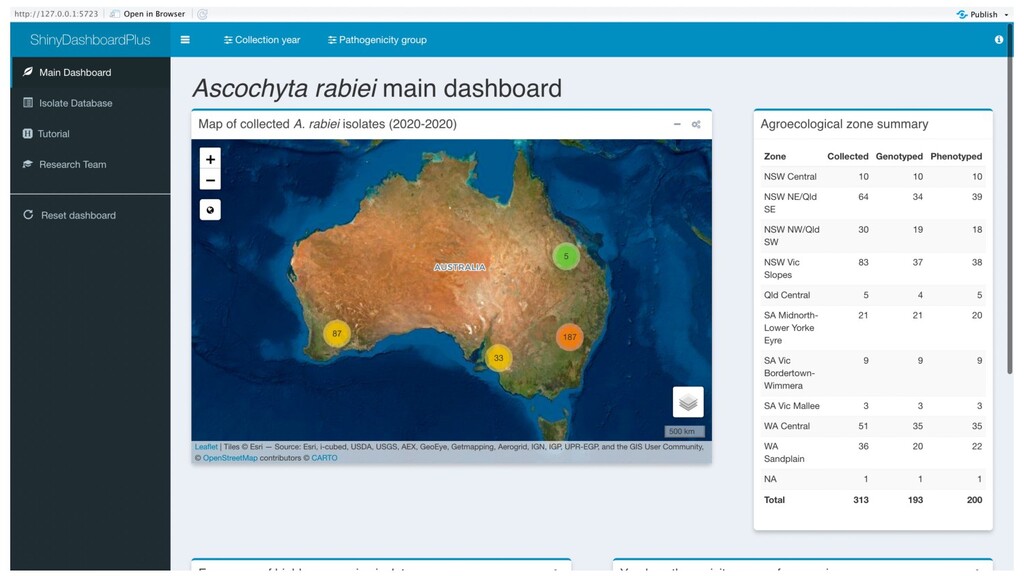
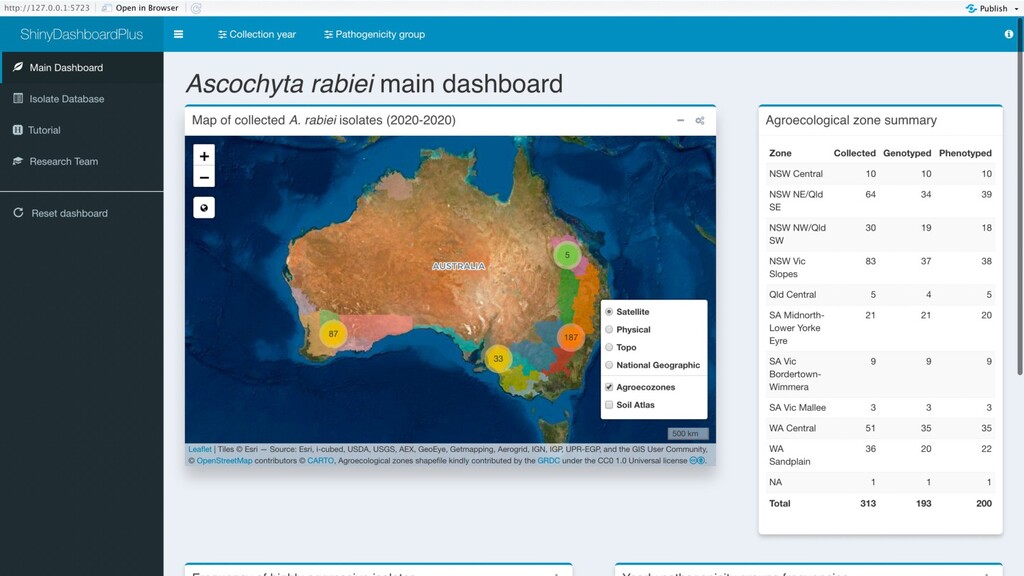
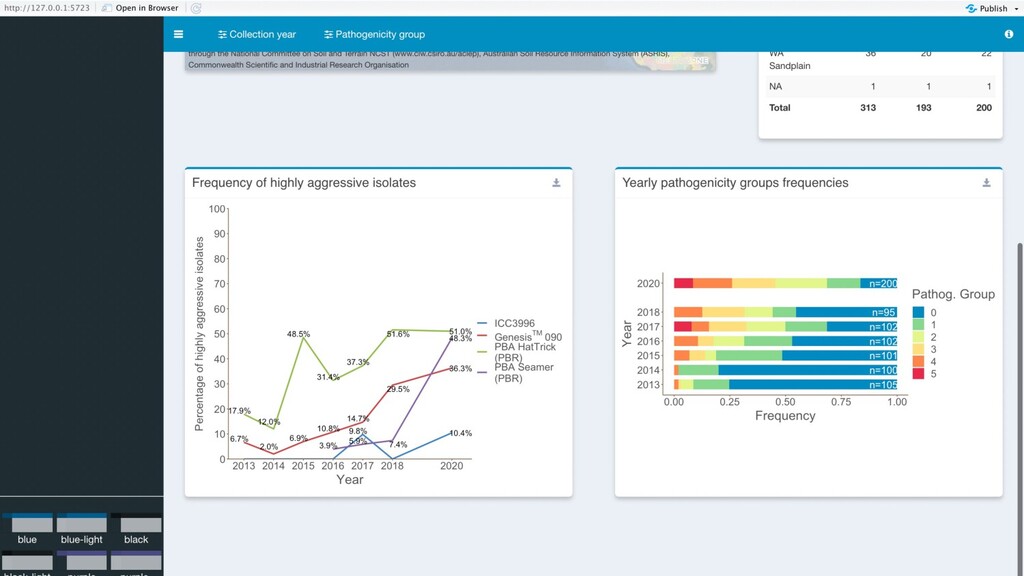
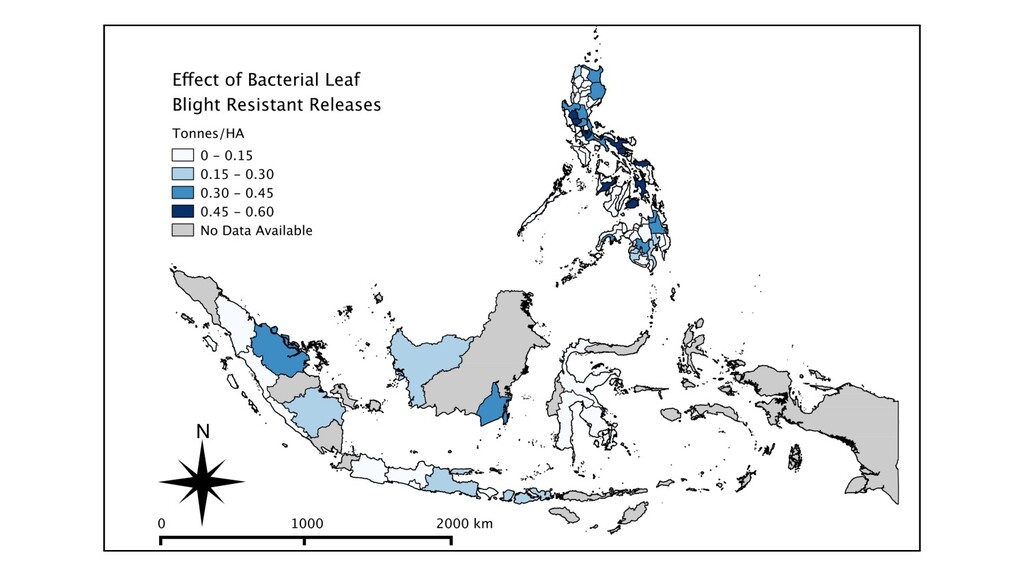
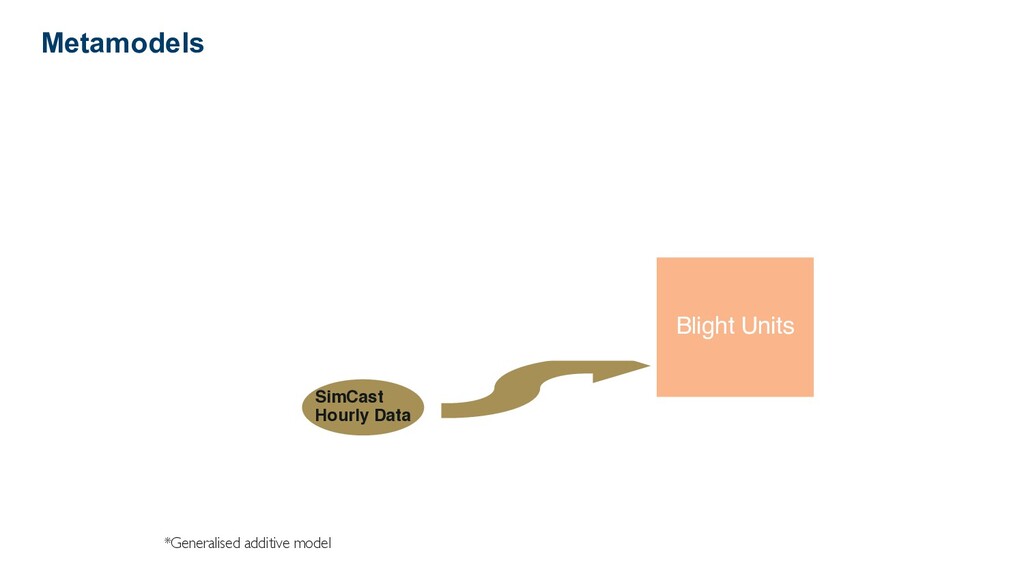
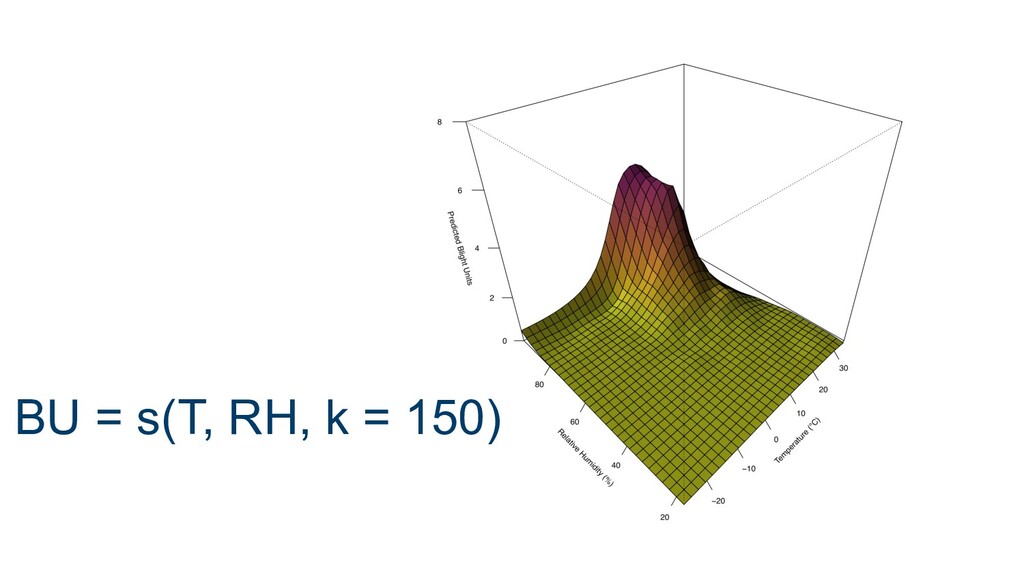
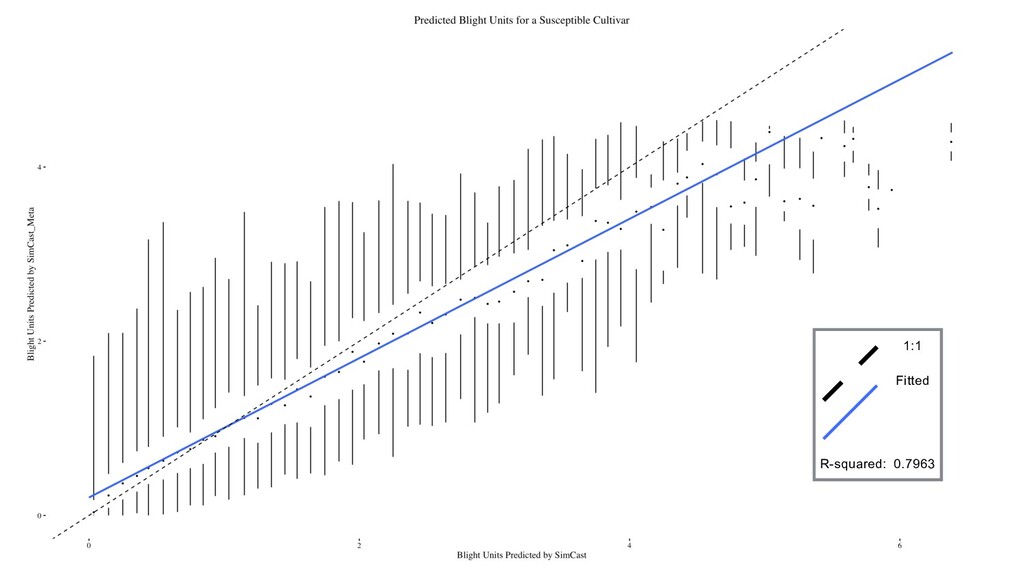
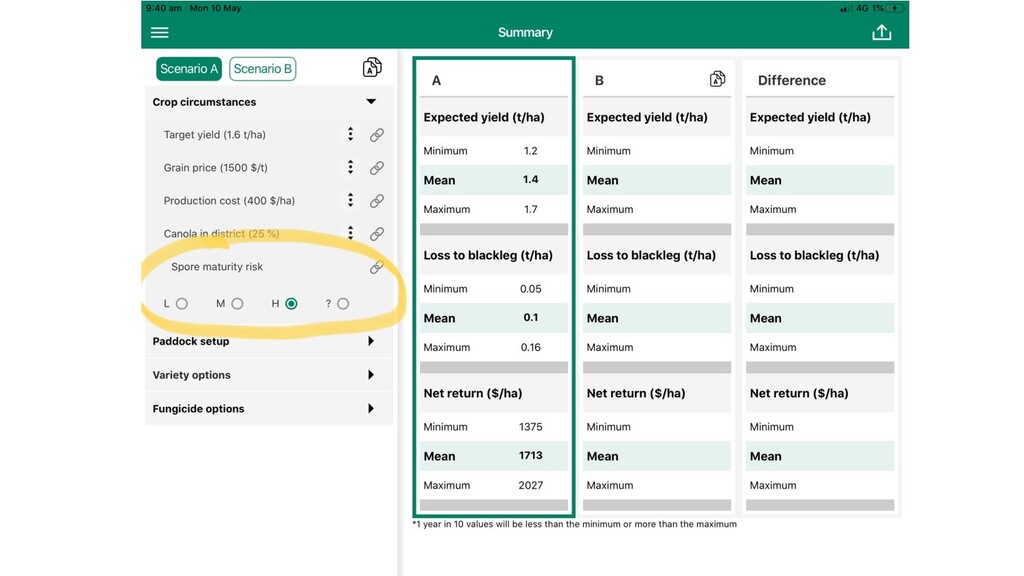
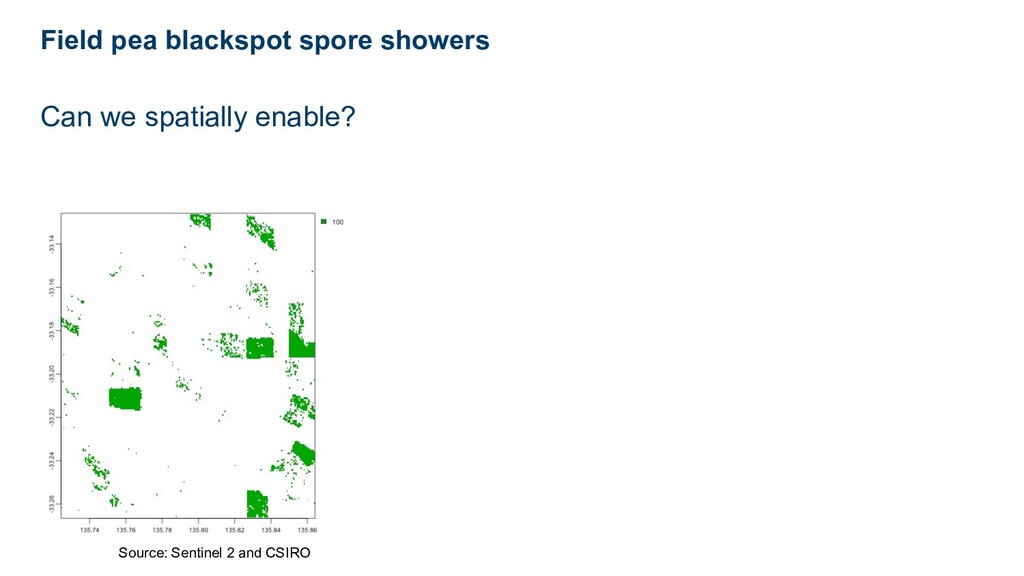
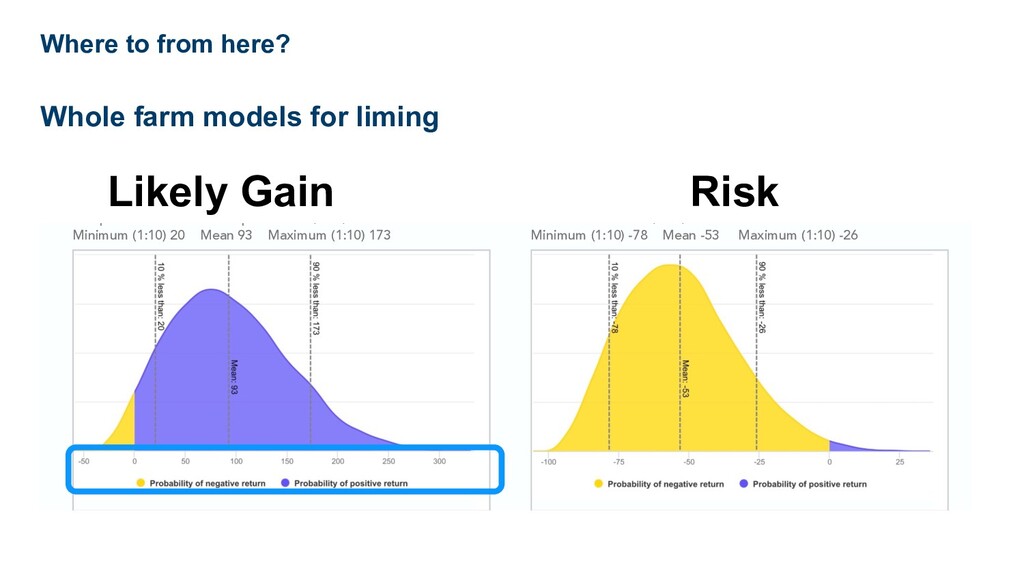
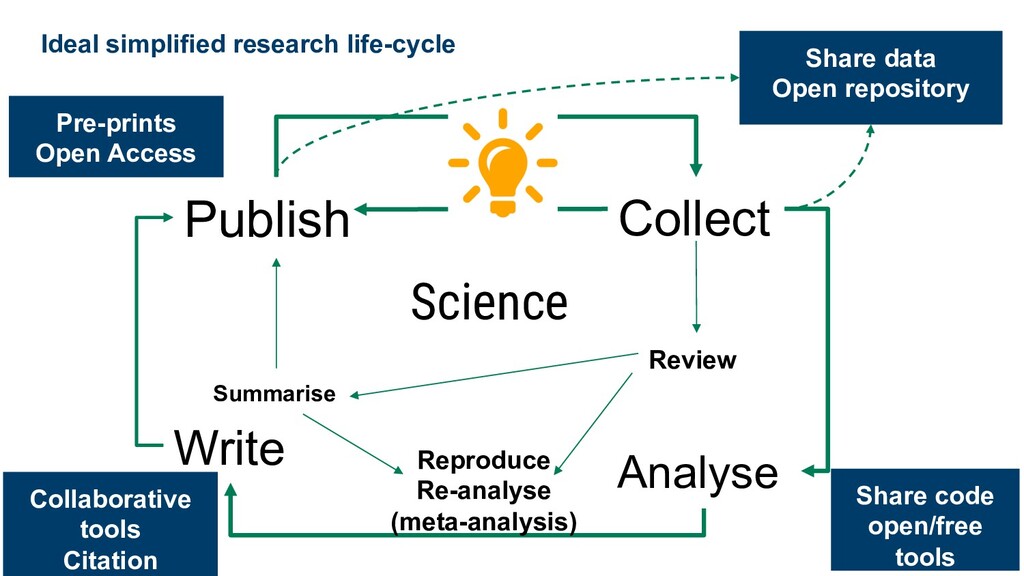
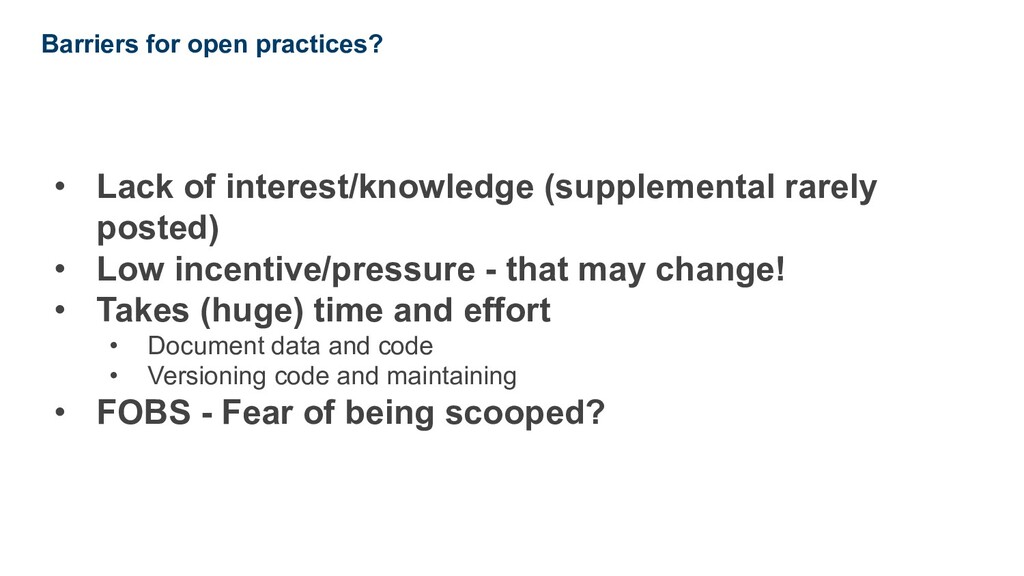
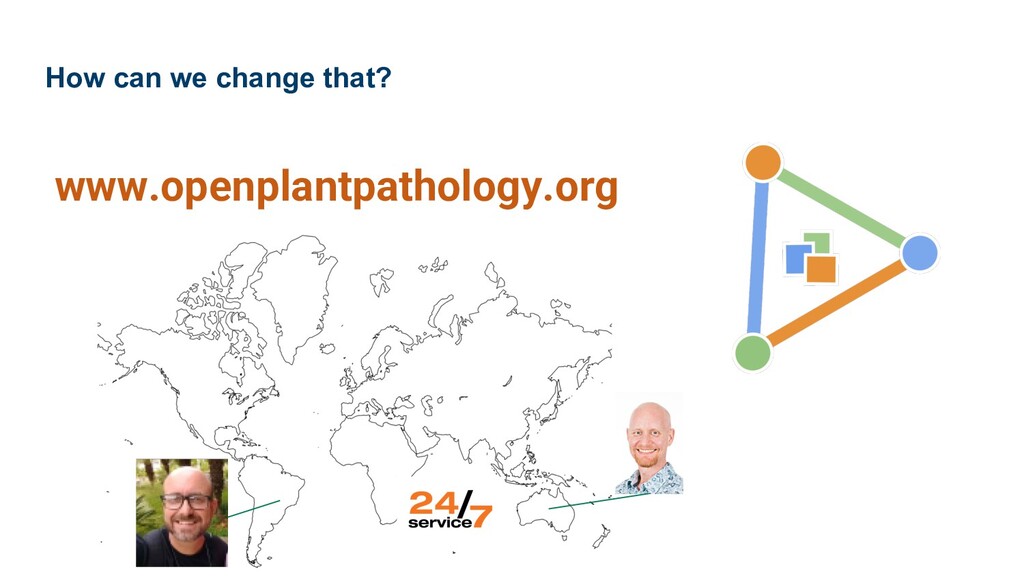
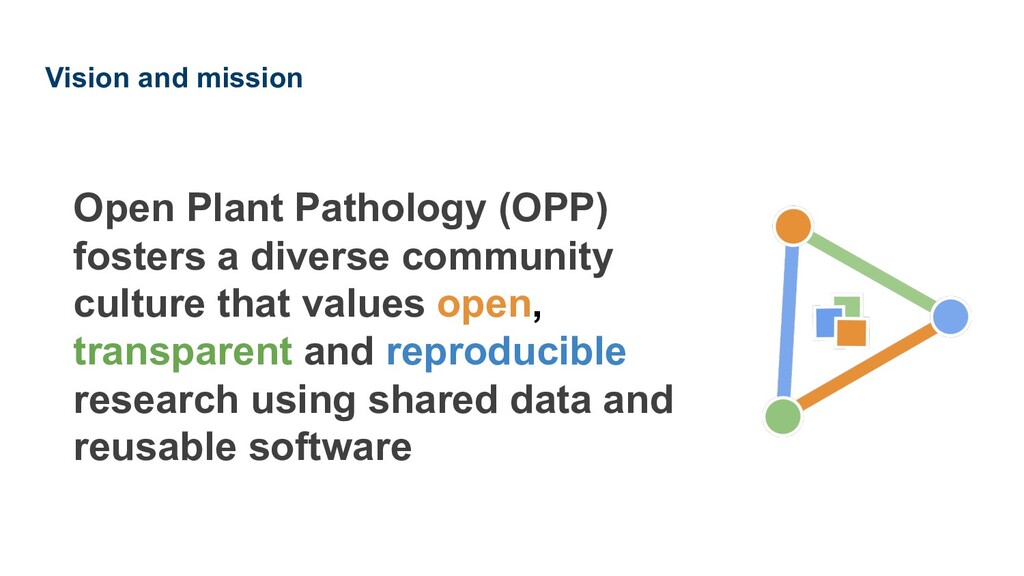
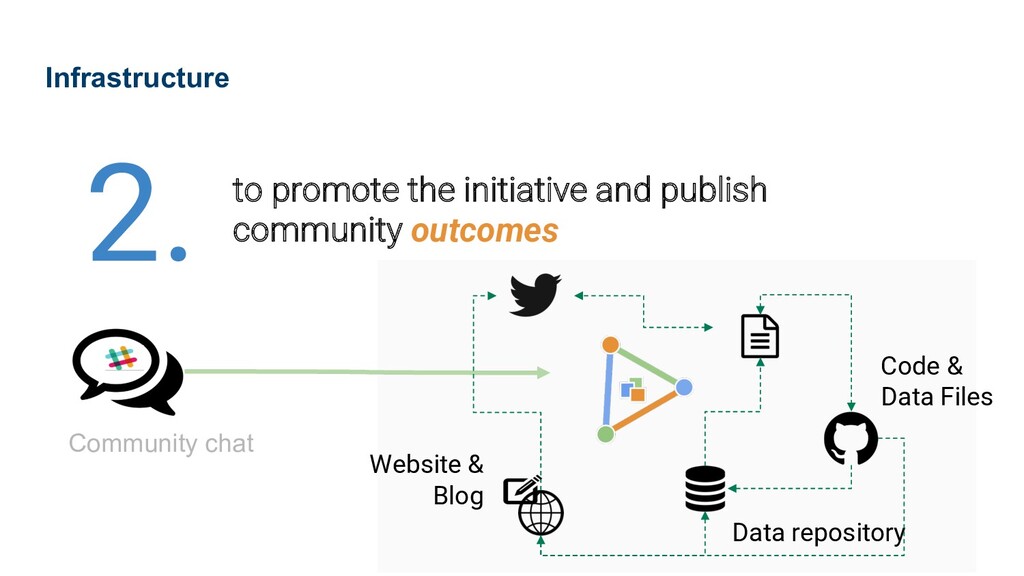
Decisions in agriculture are made every day that require information to maximise benefit, reduce risk, and increase production or profitability. This demand for information is a driving factor behind the creation of many plant disease models. Models are used to make tactical on-farm decisions, including how and when plant diseases could or should be controlled while also informing high-level policymaking decisions to determine where to focus breeding efforts both geographically and for future investments. Because of the broad range of modelling applications, many different approaches have been used in botanical epidemiology from non-parametric statistical models such as generalised additive models (GAM) to empirical crop growth models with functions for yield losses due to pests and disease. While these approaches are effective in communicating with end-users, often much more impact can be realised by openly sharing the data and code behind the models when it is possible. Recognising this, along with Emerson Del Ponte from the University of Viçosa, Brazil, in 2018 I co-founded Open Plant Pathology, a community of plant pathology, plant disease epidemiology, pathogen population biology, microbial ecology and genomics researchers that supports the several forms of open science practices in plant pathology. I will present a variety of modelling approaches covering a range of crops and diseases that support decision making at scales from in-season sprays to long-term breeding program prioritisations, which need to account for climate change and the possible related changes in plant disease and how and why we should be sharing our data and code.

Adam H. Sparks

October 21, 2021
Tweet

More Decks by Adam H. Sparks

Other Decks in Science

Transcript

  1. Guiding policy How does climate change affect rice diseases in

    Tanzania? Mitigating The Impact Of Climate Change On Rice Disease Resistance In East Africa [MICCORDEA Project]
  2. = Losses due to pest injuries Actual Yield - Production-Situation

    Driven Crop growth model (Attainable Yield) RICEPEST
  3. • Simulates yield losses due to pests • Data requirements

    o Radiation o Temperature • Output: Attainable and Actual yield o Sheath blight o Sheath rot o Weeds o Bacterial leaf blight o Brown spot o Leaf blast o Neck blast o Brown plant hopper o Defoliators o White heads o Dead heart o Stem borer o Disease severity o Production Situation RICEPEST
  4. • Simulates unmanaged epidemics • Data requirements o Precipitation o

    Temperature o Relative humidity o Planting date • Output: Unmanaged disease severity (AUDPC) o Sheath blight o Tungro o Bacterial leaf blight o Brown spot o Leaf blast EPIRICE
  5. Duku, C., Sparks, A. H. and Zwart, S. 2015. Spatial

    modelling of rice yield losses in Tanzania due to bacterial leaf blight and leaf blast in a changing climate. Climatic Change 135(3). EPIRICE RICEPEST Data: General Circulation Model (GCM), Commonwealth Scientific and Industrial Research Organization mark 3 (CSIRO-MK3)
  6. 5 20 3 0 18 10 20 25 27 24

    25 23 RICEPEST Model { = 3.5 3.2 3.6 3.6 Satellite derived, georeferenced data x y x y x y Georeferenced Yield Loss Estimates x y Precip Temp Rad Tons/HA Fertilizer Irrigation, etc. Production Situation EPIRICE Model (% Disease Severity) 25 20 30 19 27 24 25 23 + x y x y Blast BLB +
  7. Duku, C., Sparks, A. H. and Zwart, S. 2015. Spatial

    modelling of rice yield losses in Tanzania due to bacterial leaf blight and leaf blast in a changing climate. Climatic Change 135(3). Change in yield loss due to BLB
  8. FAO’s Global Administrative Unit Layers (GAUL) NCEI’s Global Surface Summary

    of the Day – GSOD 2001-2008*, interpolated NASA/JAXA Tropical Rainfall Measuring Mission (TRMM) 2001- 2008* Data sources
  9. The boundaries and names shown and the designations used on

    this map do not imply official endorsement or acceptance by IRRI.
  10. The boundaries and names shown and the designations used on

    this map do not imply official endorsement or acceptance by IRRI.
  11. The boundaries and names shown and the designations used on

    this map do not imply official endorsement or acceptance by IRRI.
  12. The boundaries and names shown and the designations used on

    this map do not imply official endorsement or acceptance by IRRI.
  13. N

  14. • Forms of data available • Policy needs • Climate

    change evaluations Yuan-Min Shen, Taichung District Agricultural Research and Extension Station, Bugwood.org Modelling and global mapping of potato late blight
  15. BU = s(T, RH, k = 150) Metamodel (GAM*) Daily

    or Monthly Data SimCast Hourly Data Blight Units Data: CRU CL2.0* and World Climate Research Programme’s (WCRP) Coupled Model Intercomparison Project phase 3 (CMIP3)
  16. Can we spatially enable? Field pea blackspot spore showers Source:

    Sentinel 2 and CSIRO Melloy and Sparks (unpublished)
  17. Where to from here? Whole farm models for liming Acid

    Management Strategy Comparison All net return forecasts are relative to an “acidification not managed” strategy whereby no addition of lime occurs. Net present value of future production ($/ha) Minimum (1:10) 20 Mean 93 Maximum (1:10) 173 Lime applied at 1.5 times acidification rate on paddocks below target pH and at 1.0 times acidification rate on paddocks at target pH on a target 5 year cycle with additions proportional to previous season’s cash flow Strategy 1 Remediation responsive to cash flow Minimum cash flow ($/ha) Minimum (1:10) -78 Mean -53 Maximum (1:10) -26 Likely Gain Risk
  18. Science Collect Analyse Publish Write Review Summarise Reproduce Re-analyse (meta-analysis)

    Share data Open repository Share code open/free tools Collaborative tools Citation Pre-prints Open Access Ideal simplified research life-cycle
  19. • Sponsors/journals require data (standard in molecular) • Allows reproducibility

    (data and/or methods) • Technology (less cumbersome) is becoming available • Enhanced visibility/transparency • Multiple citable outcomes: data, code, manuscript, etc. Why embrace Open Practices?
  20. • Lack of interest/knowledge (supplemental rarely posted) • Low incentive/pressure

    - that may change! • Takes (huge) time and effort • Document data and code • Versioning code and maintaining • FOBS - Fear of being scooped? Barriers for open practices?
  21. Open Plant Pathology (OPP) fosters a diverse community culture that

    values open, transparent and reproducible research using shared data and reusable software Vision and mission
  22. By creating a social network with a welcoming and sharing

    scientific community openplantpathology.slack.com Expanding network Sharing knowledge Brainstorming Building capacity (Hopefully!) more transparent, reproducible, efficient and reliable Plant Pathology research 1. Social Workspace
  23. to promote the initiative and publish community outcomes Community chat

    Website & Blog Data repository Code & Data Files 2. Infrastructure
  24. ICPP2018 - Workshops • Network Analysis in Plant Pathology •

    Applications of Information Theory in Plant Disease Management: Theory and Practice • Introduction to Multivariate Statistics Using R • Population Genomics in R APPS 2019 - Workshop • R Markdown for Scientists Previous activities
  25. Repositories • AfricaRice/IRRI Tanzania work • https://github.com/adamhsparks/MICCORDEA • STRASA mapping

    disease in India • https://github.com/adamhsparks/STRASA-Biotic-Stress-Maps • Metamodelling potato late blight • https://github.com/adamhsparks/Global-Late-Blight-MetaModelling
  26. R Package Resources epicrop, the EPIRICE (and hopefully EPIWHEAT) model

    https://github.com/adamhsparks/epicrop GSODR/nasapower, global daily weather data https://github.com/ropensci/GSODR (station) https://github.com/ropensci/nasapower (satellite/model) chirps, rainfall from TRMM https://github.com/ropensci/chirps (satellite/model) getCRUCL2.0, CRU Climate data https://github.com/ropensci/getCRUCLdata hagis, Plant pathogen pathotype complexities, distributions and analysis https://github.com/openplantpathology/hagis
  27. Thank you Visit dpird.wa.gov.au Important disclaimer The Chief Executive Officer

    of the Department of Primary Industries and Regional Development and the State of Western Australia accept no liability whatsoever by reason of negligence or otherwise arising from the use or release of this information or any part of it. © State of Western Australia 2018