Share
Embed
Candidacy I slides
Adina
September 26, 2019
Transcript
62 slides
-
Exploiting TESS data to Understand Young Stars Adina Feinstein NSF
Graduate Research Fellow Advisors: Jacob Bean & Benjamin Montet !1 Candidacy I September 26, 2019 -
The Transiting Exoplanet Survey Satellite (TESS) is a four+ year,
nearly all-sky survey monitoring millions of stars. !2 -
The Transiting Exoplanet Survey Satellite (TESS) is a four+ year,
nearly all-sky survey monitoring millions of stars. !2 27 days 54 days 81 days 108 days 189 days 351 days -
!3 The entire 96° x 24° sector is observed in
the TESS Full-Frame Images (FFIs). -
Predictions indicate the detection of thousands of exoplanets which will
not be covered in the 2-minute data. !4 (Barclay et al. 2018) -
!5 Although TESS’s primary objective is to find exoplanets, it
is a great data set for other fields. Exoplanet Solar System Extragalactic Stellar Astrophysics -
!6 Outline 1. Developing eleanor, a tool for light curve
extraction from TESS 2. Robustly identifying and characterizing flares of young stars 3. Connecting flares and spots to understand stellar activity -
!7 Outline 1. Developing eleanor, a tool for light curve
extraction from TESS 2. Robustly identifying and characterizing flares of young stars 3. Connecting flares and spots to understand stellar activity -
Introducing eleanor, an open-source tool for light curve extraction from
the FFIs. !8 Feinstein, A. D., Montet, B. T., Foreman-Mackey, D., et al. 2019, PASP, 131, 094502 https://GitHub.com/afeinstein20/eleanor -
Introducing eleanor, an open-source tool for light curve extraction from
the FFIs. !8 Feinstein, A. D., Montet, B. T., Foreman-Mackey, D., et al. 2019, PASP, 131, 094502 https://GitHub.com/afeinstein20/eleanor -
!9 All FFIs for a given sector are about 1TB
of data, which is not user friendly. -
!9 All FFIs for a given sector are about 1TB
of data, which is not user friendly. -
!11 From the “postcards” we create Target Pixel Files (TPFs)
which we perform aperture photometry on. (Feinstein et al. 2019) -
!12 We provide four different types of light curves for
the community to use. (Feinstein et al. 2019) -
!13 We completed a quick search of Sectors 1 and
2 for new planet candidates. (Feinstein et al. 2019) Normalized Flux 0.8 1.0 1.2 0.99 1.00 1.01 0.99 1.00 1.01 0.98 1.00 0.98 1.00 1.02 Time [BJD-2457000] Time from Mid-Transit [Days] 1325 1330 1335 1340 1345 1350 -0.2 -0.1 0.0 0.1 0.2 TIC 350844139 TIC 394340349 TIC 139771134 TIC 159835004 TIC 38907808 -
!14 The eleanor package is a powerful tool for those
not interested in stars and exoplanets as well. (Feinstein et al. 2019: See also Fausnaugh et al. 2019; Vallely et al. 2019) Time [BJD-2457000] Flux SN2018fhw SN2018eph SN2018exc MOA 2018-LMC-002 MOA 2018-LMC-003 60 50 40 140 130 120 140 130 120 2900 2800 2700 300 200 100 1330 1340 1350 1360 1370 1380 -
!15 Combining the FFIs and the two-minute data can allow
for further confirmation of exciting systems. Planet Transit Stellar Eclipse (Kostov, Welsh, Feinstein et al. in prep) !15 -
!15 Combining the FFIs and the two-minute data can allow
for further confirmation of exciting systems. Planet Transit Stellar Eclipse (Kostov, Welsh, Feinstein et al. in prep) !15 -
!15 Combining the FFIs and the two-minute data can allow
for further confirmation of exciting systems. Planet Transit Stellar Eclipse (Kostov, Welsh, Feinstein et al. in prep) !15 -
!15 Combining the FFIs and the two-minute data can allow
for further confirmation of exciting systems. Planet Transit Stellar Eclipse (Kostov, Welsh, Feinstein et al. in prep) !15 -
!15 Combining the FFIs and the two-minute data can allow
for further confirmation of exciting systems. Planet Transit Stellar Eclipse (Kostov, Welsh, Feinstein et al. in prep) !15 -
!16 The eleanor data products are being transferred to Mikulski
Archive for Space Telescopes (MAST), but the software is available now. -
!18 Future plans including using eleanor to find young planets
for Rossiter-McLaughlin studies with MAROON-X. -
!19 Outline 1. Developing eleanor, a tool for light curve
extraction from TESS 2. Robustly identifying and characterizing flares of young stars 3. Connecting flares and spots to understand stellar activity -
!20 What is the relationship between stellar flare energy and
age? Spectral type? -
!21 What is the relationship between stellar flare energy and
age? Spectral type? -
!22 Similar studies with Kepler demonstrated a relationship between spectral
type, rotation period, and flare energy. (Davenport, 2016) 1.66 1.13 0.86 0.73 0.62 0.47 0.28 Mass [MSun ] Maximum Log(Flare Energy [ergs]) 32 33 34 35 36 37 38 39 40 -
!22 Similar studies with Kepler demonstrated a relationship between spectral
type, rotation period, and flare energy. (Davenport, 2016) 1.66 1.13 0.86 0.73 0.62 0.47 0.28 Mass [MSun ] Maximum Log(Flare Energy [ergs]) 32 33 34 35 36 37 38 39 40 -
!22 Similar studies with Kepler demonstrated a relationship between spectral
type, rotation period, and flare energy. (Yang & Liu, 2019) (Davenport, 2016) 1.66 1.13 0.86 0.73 0.62 0.47 0.28 Mass [MSun ] Maximum Log(Flare Energy [ergs]) 32 33 34 35 36 37 38 39 40 -
!22 Similar studies with Kepler demonstrated a relationship between spectral
type, rotation period, and flare energy. (Yang & Liu, 2019) (Davenport, 2016) 1.66 1.13 0.86 0.73 0.62 0.47 0.28 Mass [MSun ] Maximum Log(Flare Energy [ergs]) 32 33 34 35 36 37 38 39 40 -
!23 What is the relationship between stellar flare energy and
age? Spectral type? -
!24 We have completed a literature search for young moving
group members with ages 1-750 Myr. -
!25 What is the relationship between stellar flare energy and
age? Spectral type? -
!26 Previous flare studies have relied on sigma clipping methods
to identify flares. -
!26 Previous flare studies have relied on sigma clipping methods
to identify flares. (Chang, Byun, & Hartman, 2015) -
!26 Previous flare studies have relied on sigma clipping methods
to identify flares. (Chang, Byun, & Hartman, 2015) :( -
!27 What is the most complete method for detecting flares
of all energies? -
!28 Machine learning can be used when searching for signals
with a characteristic shape. -
!28 Machine learning can be used when searching for signals
with a characteristic shape. (Pearson et al. 2017) -
!28 Machine learning can be used when searching for signals
with a characteristic shape. (Pearson et al. 2017) -
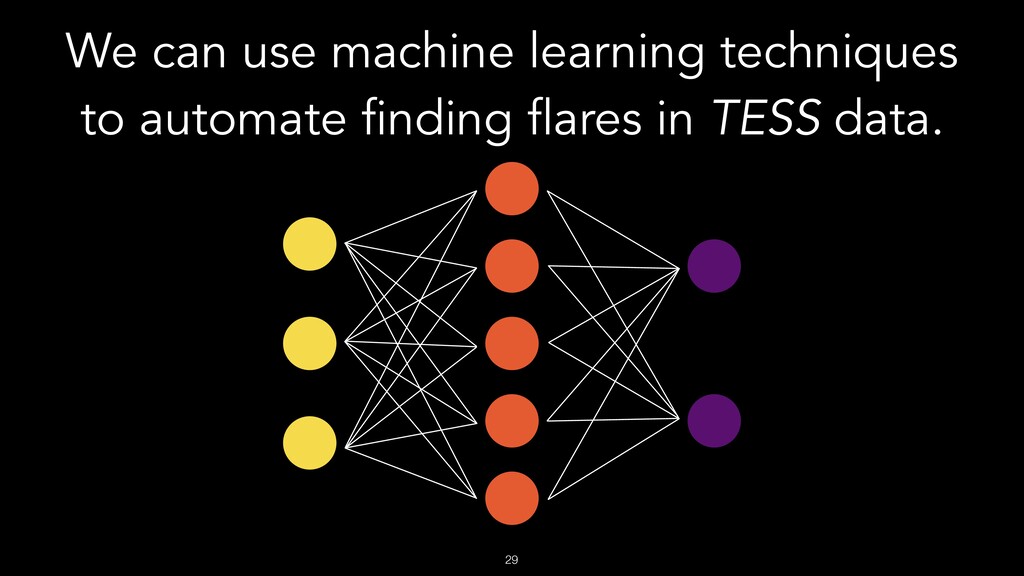
We can use machine learning techniques to automate finding flares
in TESS data. !29 -
!30 We simulate spot modulation and flares of different amplitudes
to pass in as the training set. -
!31 Every light curve receives a label that the neural
network learns over several epochs. -
!32 Feeding in a test training set assigns a probability
that the object is or is not a flare. -
!33 We determine the probability that each data point is
a part of a potential flare. -
!33 We determine the probability that each data point is
a part of a potential flare. -
!34 The first results of applying the neural network to
a TESS two-minute target are promising. -
!35 https://GitHub.com/afeinstein20/stella Zooming in, we can see the confidence of
the neural network with identifying large flares. -
!36 Outline 1. Developing eleanor, a tool for light curve
extraction from TESS 2. Robustly identifying and characterizing flares of young stars 3. Connecting flares and spots to understand stellar activity -
!37 In the same year, two papers presented conflicting results
on where flares occur with relation to spots. -
!37 In the same year, two papers presented conflicting results
on where flares occur with relation to spots. (Doyle et al. 2018) -
!37 In the same year, two papers presented conflicting results
on where flares occur with relation to spots. (Doyle et al. 2018) -
!37 In the same year, two papers presented conflicting results
on where flares occur with relation to spots. (Doyle et al. 2018) (Roettenbacher et al. 2018) 1-5% increase > 5% increase -
!37 In the same year, two papers presented conflicting results
on where flares occur with relation to spots. (Doyle et al. 2018) (Roettenbacher et al. 2018) 1-5% increase > 5% increase -
!37 In the same year, two papers presented conflicting results
on where flares occur with relation to spots. (Doyle et al. 2018) (Roettenbacher et al. 2018) 1-5% increase > 5% increase Sample size: 32 Sample size: 119 -
!38 The take-away figure will show the location of flares
with respect to the phase of spot modulation. -
!39 Summary • We have created an open-source software package
for extracting light curves from the TESS FFIs. • Light curve data products will be hosted on MAST for community use. • Currently, I am exploring flare properties of young (1-750 Myr) stars observed by TESS using a neural network, with the hopes of answering how flares are related to starspots.