PDA worked in UCD • Which subjects spent the most money? • Print PDA versus electronic PDA • The pros and the cons of PDA • PDA Workflow • Relevance Ranking & PDA
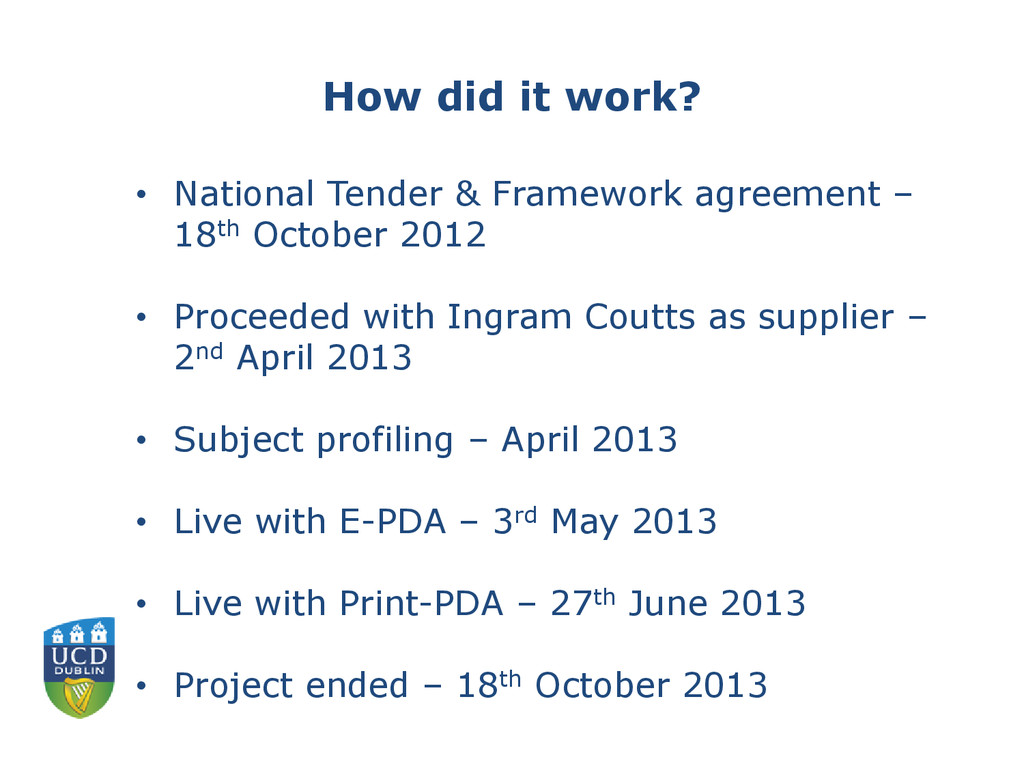
– 18th October 2012 • Proceeded with Ingram Coutts as supplier – 2nd April 2013 • Subject profiling – April 2013 • Live with E-PDA – 3rd May 2013 • Live with Print-PDA – 27th June 2013 • Project ended – 18th October 2013
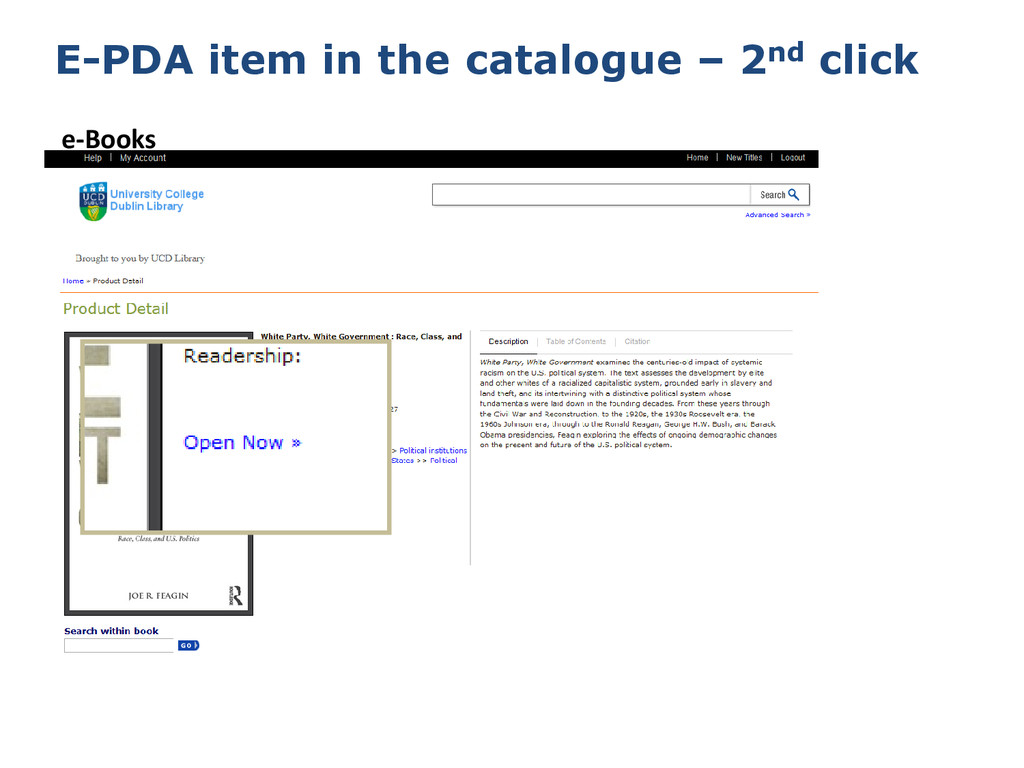
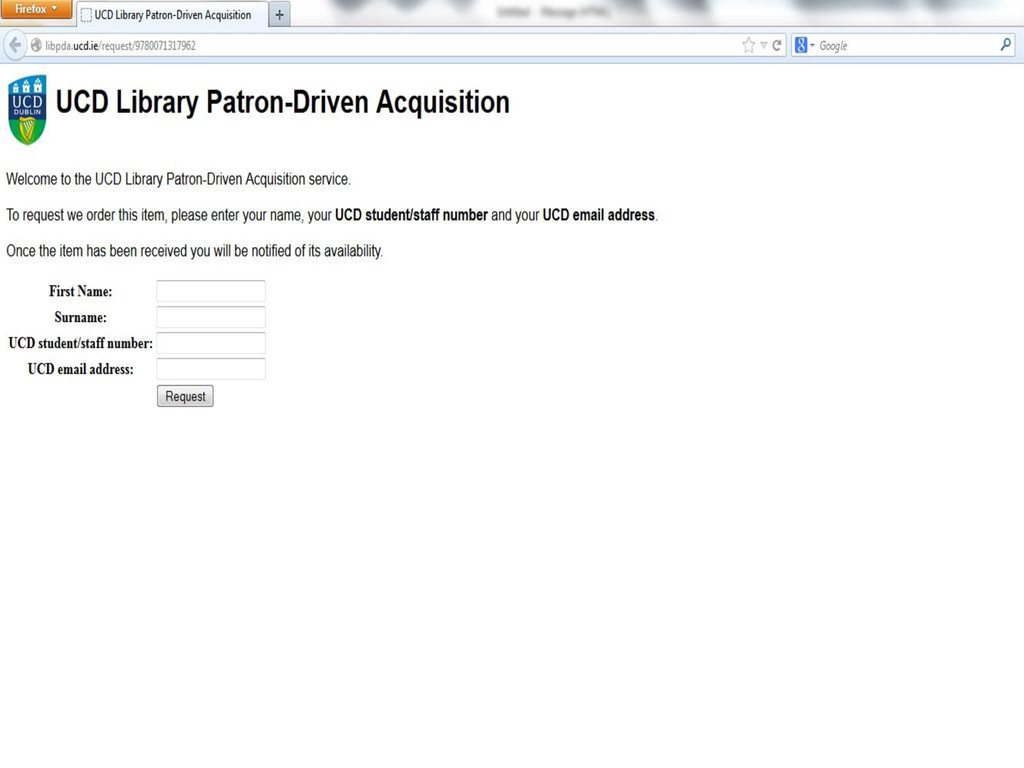
which last 24 hours Passing here a second time triggers a seamless purchase 3 concurrent users Perpetual access E-PDA item in the catalogue – 2nd click
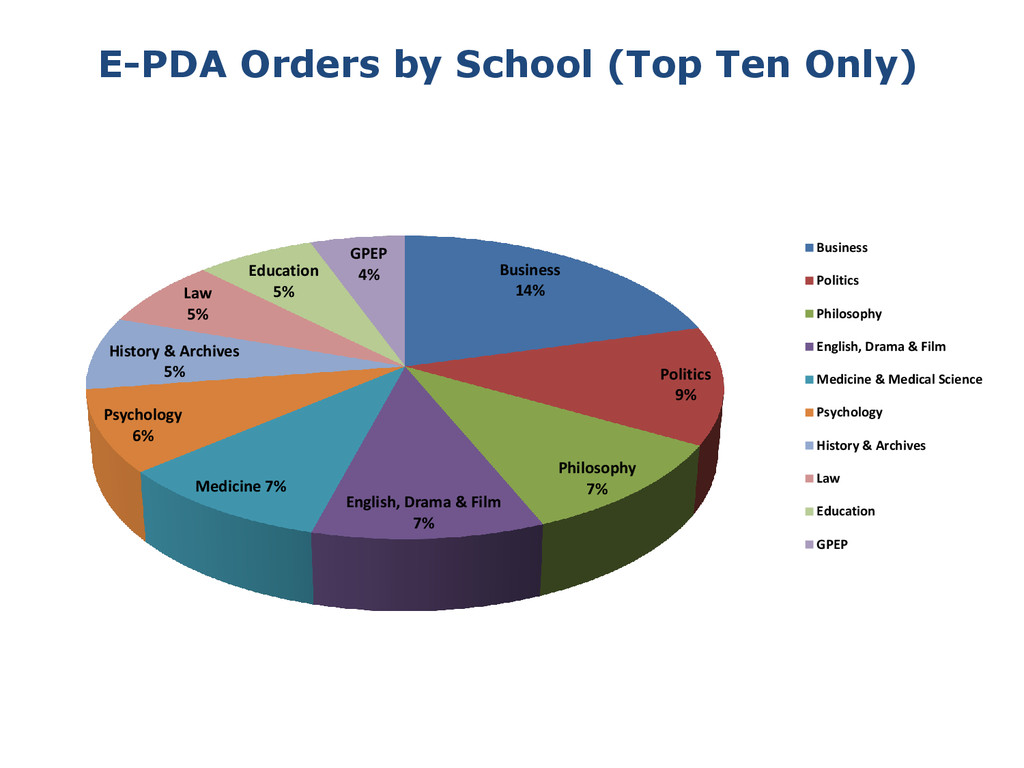
7% Medicine 7% Psychology 6% History & Archives 5% Law 5% Education 5% GPEP 4% Business Politics Philosophy English, Drama & Film Medicine & Medical Science Psychology History & Archives Law Education GPEP E-PDA Orders by School (Top Ten Only)
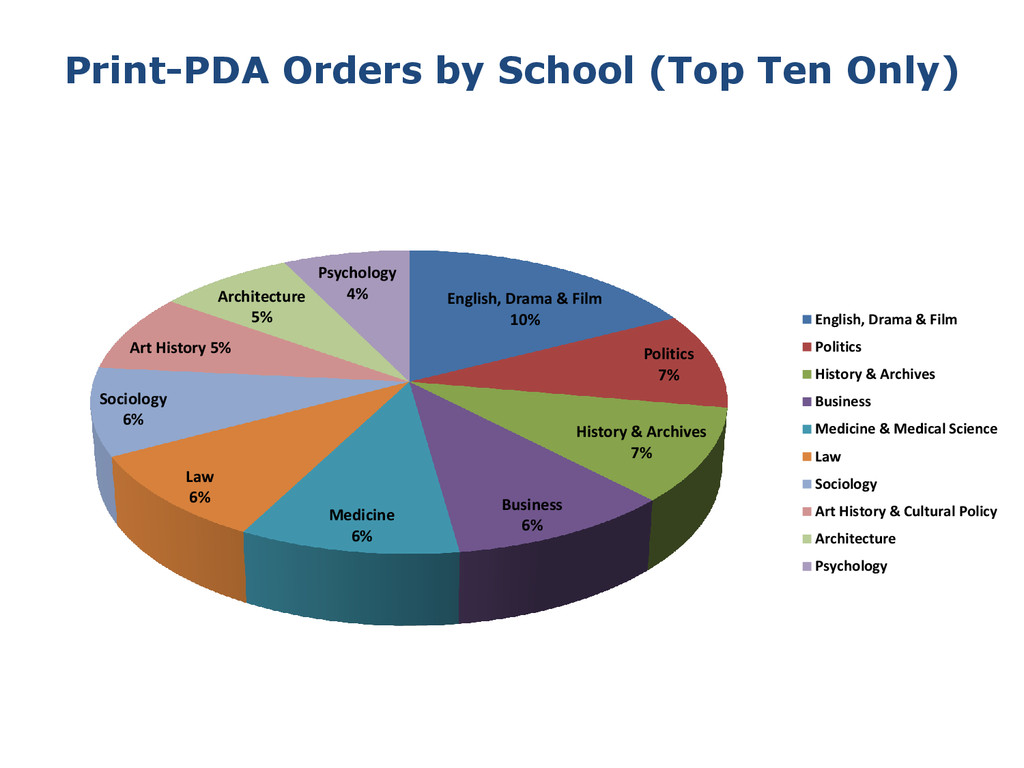
Film 10% Politics 7% History & Archives 7% Business 6% Medicine 6% Law 6% Sociology 6% Art History 5% Architecture 5% Psychology 4% English, Drama & Film Politics History & Archives Business Medicine & Medical Science Law Sociology Art History & Cultural Policy Architecture Psychology
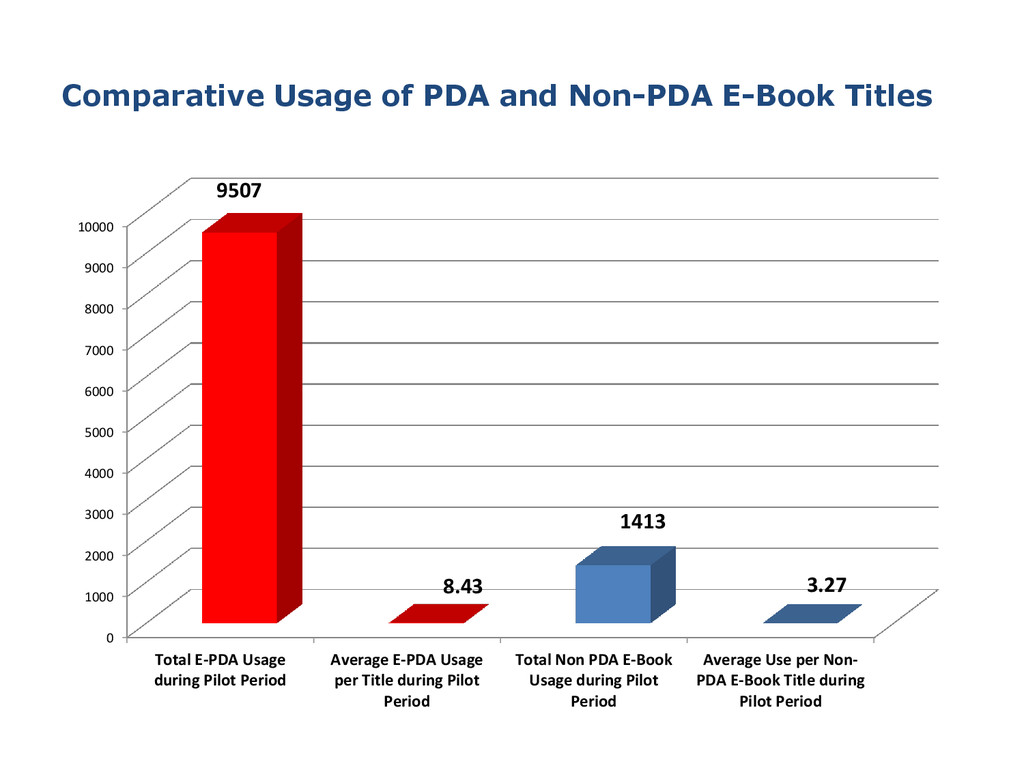
2000 3000 4000 5000 6000 7000 8000 9000 10000 Total E-PDA Usage during Pilot Period Average E-PDA Usage per Title during Pilot Period Total Non PDA E-Book Usage during Pilot Period Average Use per Non- PDA E-Book Title during Pilot Period 9507 8.43 1413 3.27
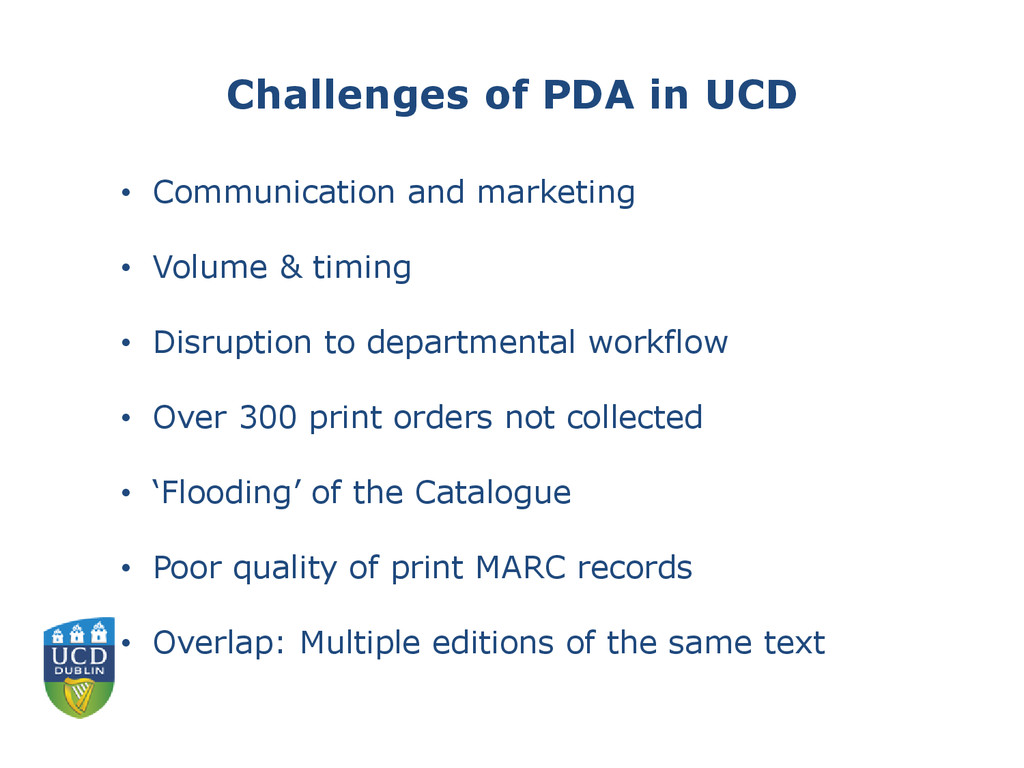
Volume & timing • Disruption to departmental workflow • Over 300 print orders not collected • ‘Flooding’ of the Catalogue • Poor quality of print MARC records • Overlap: Multiple editions of the same text
![Thank you [email protected] 01-7167575 @eoinmc73](https://files.speakerdeck.com/presentations/1717e460c951013130852e590c444dc4/slide_20.jpg)