Upgrade to Pro — share decks privately, control downloads, hide ads and more …

Debugging Performance The Right Way! - WCAhmedabad2018

Debugging Performance The Right Way! - WCAhmedabad2018

Ahmedabad WordPress Meetup

December 01, 2018
Tweet

More Decks by Ahmedabad WordPress Meetup

Other Decks in Technology

Transcript

  1. Dhaval Shah Founder at Mindmantra Digital A digital wrangler who

    loves web and WordPress just like you. #WCAHMEDABAD
  2. Which metrics to analyze? ➔ Which are the regions from

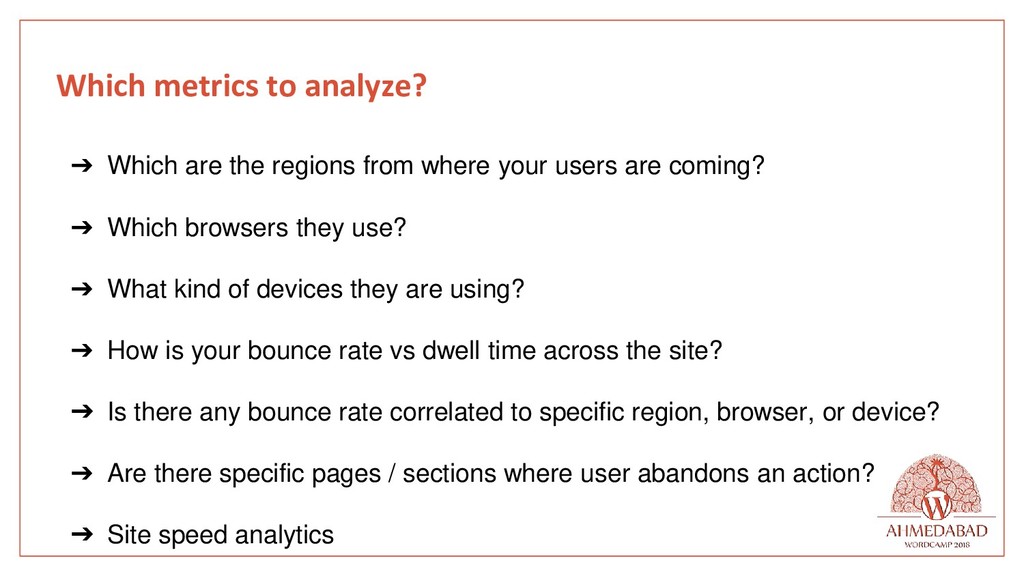
    where your users are coming? ➔ Which browsers they use? ➔ What kind of devices they are using? ➔ How is your bounce rate vs dwell time across the site? ➔ Is there any bounce rate correlated to specific region, browser, or device? ➔ Are there specific pages / sections where user abandons an action? ➔ Site speed analytics
  3. Uptime and Performance Monitoring Tools ( use in combination with

    Google Analytics ) ➔ updown.io (uptime monitoring) ➔ Pingdom (uptime and performance monitoring) ➔ Uptime Robot (uptime monitoring) ➔ StatusCake (uptime and performance monitoring) ➔ ManageWP (uptime and performance monitoring)
  4. Tools to start with.. ➔ WebPageTest.org ➔ GTMetrics ➔ Pingdom

    Tools ➔ PageSpeedInsights ➔ Google Lighthouse
  5. Key factors affecting connection performance... ➔ DNS resolution delay ➔

    Network latency ➔ Not using HTTP/2 ➔ SSL handshake ➔ No / Bad Browser Caching
  6. How to optimize for them? ➔ Use a better /

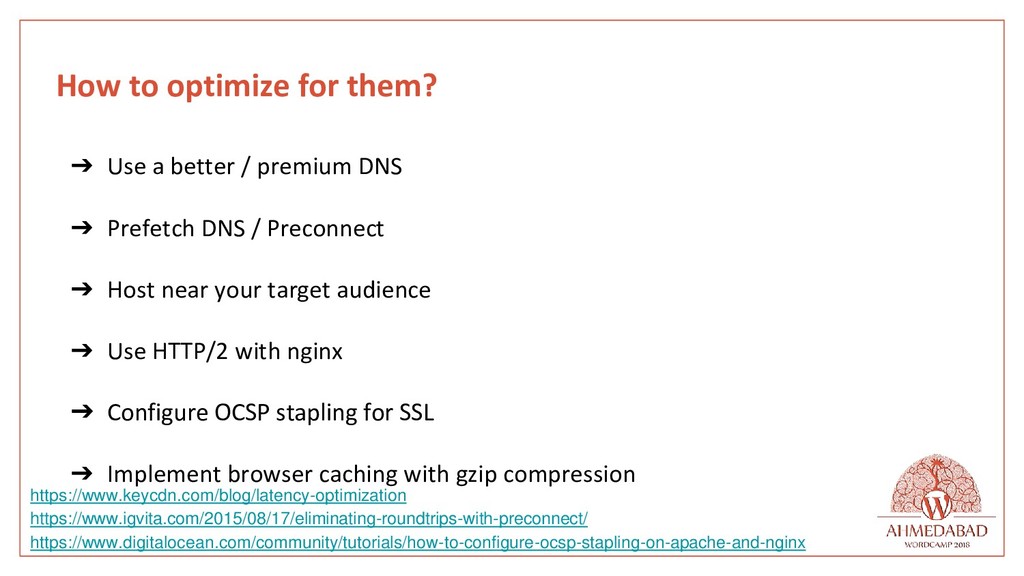
    premium DNS ➔ Prefetch DNS / Preconnect ➔ Host near your target audience ➔ Use HTTP/2 with nginx ➔ Configure OCSP stapling for SSL ➔ Implement browser caching with gzip compression https://www.keycdn.com/blog/latency-optimization https://www.igvita.com/2015/08/17/eliminating-roundtrips-with-preconnect/ https://www.digitalocean.com/community/tutorials/how-to-configure-ocsp-stapling-on-apache-and-nginx
  7. Key issues affecting page render ➔ Too external resources ➔

    Render blocking CSS and Javascript ➔ Unoptimized Animations (both CSS & JS) ➔ Web fonts ➔ Unoptimized images
  8. How to resolve them ➔ Limit external resources ➔ Inline

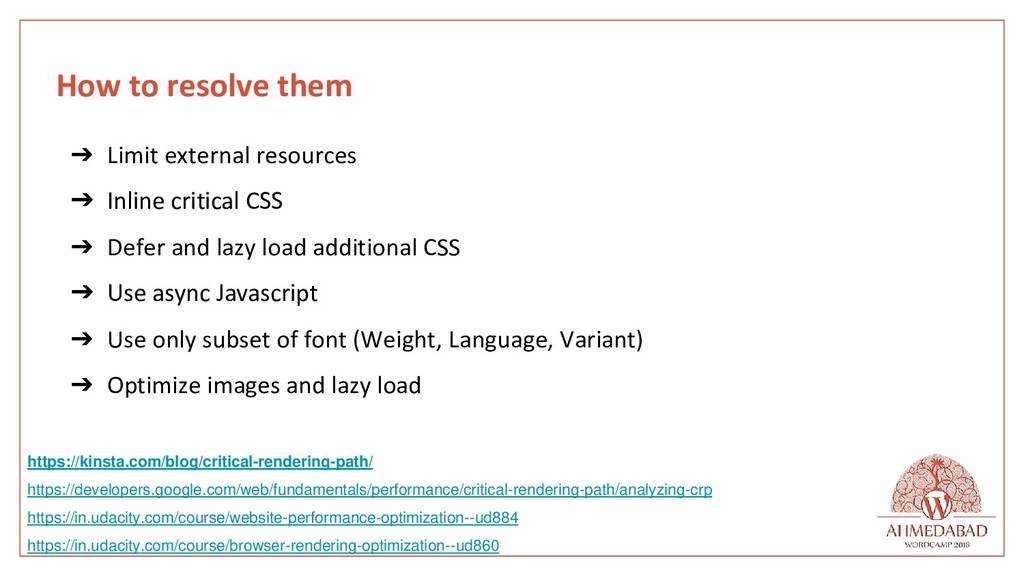
    critical CSS ➔ Defer and lazy load additional CSS ➔ Use async Javascript ➔ Use only subset of font (Weight, Language, Variant) ➔ Optimize images and lazy load https://kinsta.com/blog/critical-rendering-path/ https://developers.google.com/web/fundamentals/performance/critical-rendering-path/analyzing-crp https://in.udacity.com/course/website-performance-optimization--ud884 https://in.udacity.com/course/browser-rendering-optimization--ud860
  9. First determine which pages are critical Pages with highest traffic

    vs bounce rates, pages with high server response times
  10. Server Logs to Rescue nginx.conf log_format extensive '$host ' '$remote_addr

    - $remote_user [$time_local] ' '"$request" $status $body_bytes_sent ' '"$http_referer" "$http_user_agent" ' '$upstream_cache_status - ' '$request_time'; https://docs.nginx.com/nginx/admin-guide/monitoring/logging/ https://dzone.com/articles/using-nginx-logging-for-application-performance-mo
  11. WP-CLI to loop through plugins for p in $(wp plugin

    list --fields=name --status=active -- format=csv) do echo $p wp plugin deactivate $p for i in {1..5} do curl -so /dev/null -w "%{time_total}\n" \ -H "Pragma: no-cache" $(wp option get home) done wp plugin activate $p done https://wordpress.tv/2018/03/28/otto-kekalainen-improving-wordpress-performance-with- xdebug-and-php-profiling-2/
  12. WP-CLI Profile Command wp-cli profile -wp profile stage --allow-root https://github.com/wp-cli/profile-command

    https://guides.wp-bullet.com/using-wp-cli-wp-profile-to-diagnose-wordpress- performance-issues/
  13. PHP Code Profiling • Xdebug with webgrind (never in production)

    • XHProf • New Relic (Paid APM) • Blackfire (Paid* APM) * available for free for local development environments
  14. PHP Code Profiling - Code Graphs Hot Paths Most Intensive

    Nodes (functions) https://deliciousbrains.com/finding-bottlenecks-wordpress- code/ https://wordpress.tv/2018/03/28/otto-kekalainen- improving-wordpress-performance-with-xdebug-and-php- profiling-2/
  15. What we did not cover? (because they need their own

    talks) • Database optimization • Cache Debugging • Performance Budget • Performance Driven Development
  16. Key Takeaways • Performance is continuous process • Constantly Monitor

    For Performance • Plan Optimization based on data, not by hunch • Performance is part of development not an afterthought.