Upgrade to Pro — share decks privately, control downloads, hide ads and more …

Start your Engines - White box Monitoring for your Load Tests

Start your Engines - White box Monitoring for your Load Tests

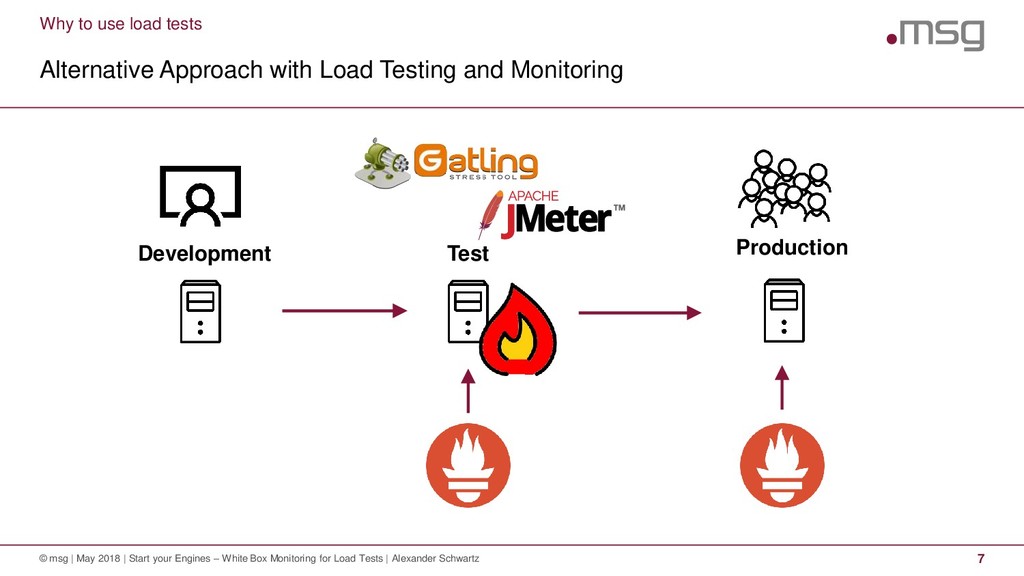
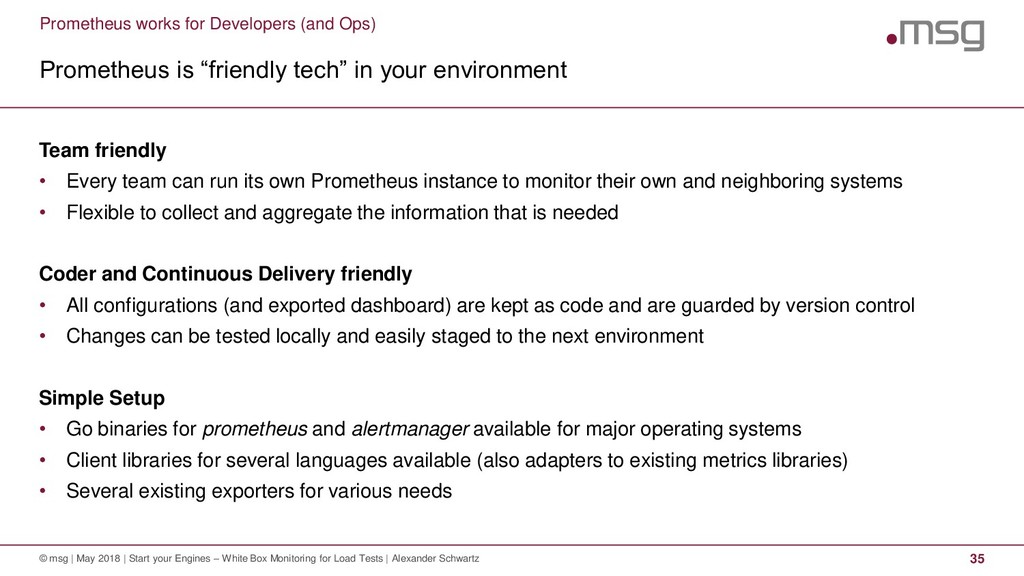
You think monitoring is only for production? Wrong: Add a metrics endpoint to your application to get insights during your load tests - and use them for free to monitor production!

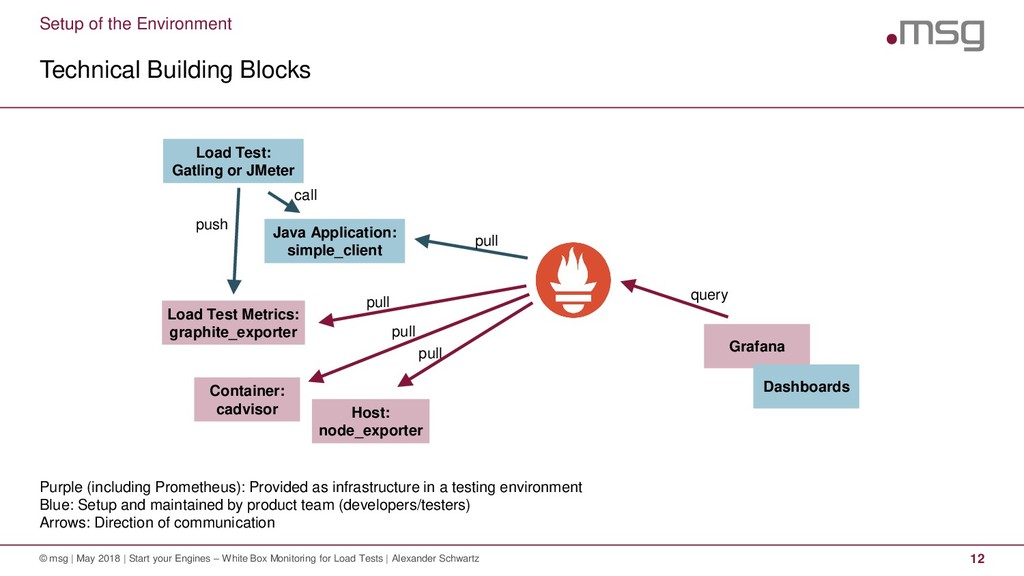
This talk shows how to setup up the load testing tools JMeter and Gatling to push their metrics to Prometheus. It also makes the case to expose metrics as part of core application development instead of treating them as a small add-on before go-live.

Alexander Schwartz

May 17, 2018
Tweet

More Decks by Alexander Schwartz

Other Decks in Technology

Transcript

  1. .consulting .solutions .partnership Start your Engines White Box Monitoring for

    your Load Tests Alexander Schwartz, Principal IT Consultant Continuous Lifecyle London 2018-05-17
  2. Start your Engines – Whitebox Monitoring for your Load Tests

    2 © msg | May 2018 | Start your Engines – White Box Monitoring for Load Tests | Alexander Schwartz Why to use load tests 1 Setup of the test environment 2 Demo 3 What to expect 4
  3. Start your Engines – Whitebox Monitoring for your Load Tests

    5 © msg | May 2018 | Start your Engines – White Box Monitoring for Load Tests | Alexander Schwartz Why to use load tests 1 Setup of the test environment 2 Demo 3 What to expect 4
  4. Why to use load tests Naive Approach © msg |

    May 2018 | Start your Engines – White Box Monitoring for Load Tests | Alexander Schwartz 6 Development Test Production
  5. Why to use load tests Alternative Approach with Load Testing

    and Monitoring © msg | May 2018 | Start your Engines – White Box Monitoring for Load Tests | Alexander Schwartz 7 Production Development Test
  6. Start your Engines – Whitebox Monitoring for your Load Tests

    8 © msg | May 2018 | Start your Engines – White Box Monitoring for Load Tests | Alexander Schwartz Why to use load tests 1 Setup of the test environment 2 Demo 3 What to expect 4
  7. Setup of the Environment Monitoring © msg | May 2018

    | Start your Engines – White Box Monitoring for Load Tests | Alexander Schwartz 9 Host & Application Metrics Alerts Dashboards
  8. Setup of the Environment Prometheus is a Monitoring System and

    Time Series Database © msg | May 2018 | Start your Engines – White Box Monitoring for Load Tests | Alexander Schwartz 10 Prometheus is an opinionated solution for instrumentation, collection, storage querying, alerting, dashboards, trending
  9. Prometheus Manifesto 1. PromCon 2016: Prometheus Design and Philosophy -

    Why It Is the Way It Is - Julius Volz https://youtu.be/4DzoajMs4DM / https://goo.gl/1oNaZV Prometheus values … © msg | May 2018 | Start your Engines – White Box Monitoring for Load Tests | Alexander Schwartz 11 operational systems monitoring (not only) for the cloud simple single node w/ local storage for a few weeks horizontal scaling, clustering, multitenancy raw logs and events, tracing of requests, magic anomaly detection, accounting, SLA reporting over over over over over configuration files Web UI, user management pulling data from single processes pushing data from processes, aggregation on nodes NoSQL query & data massaging multidimensional data everything as float64 point-and-click configurations, data silos, complex data types
  10. Setup of the Environment Purple (including Prometheus): Provided as infrastructure

    in a testing environment Blue: Setup and maintained by product team (developers/testers) Arrows: Direction of communication Technical Building Blocks © msg | May 2018 | Start your Engines – White Box Monitoring for Load Tests | Alexander Schwartz 12 Grafana Container: cadvisor Java Application: simple_client Load Test Metrics: graphite_exporter Load Test: Gatling or JMeter Dashboards Host: node_exporter push call pull pull pull pull query
  11. Setup of the Environment Targets as configured in Prometheus Configuration

    © msg | May 2018 | Start your Engines – White Box Monitoring for Load Tests | Alexander Schwartz 17 scrape_configs: - job_name: 'node-exporter' scrape_interval: 5s static_configs: - targets: ['172.17.0.1:9100']
  12. Setup CPU Metric as exported by the Node Exporter ©

    msg | May 2018 | Start your Engines – White Box Monitoring for Load Tests | Alexander Schwartz 18 # HELP node_cpu Seconds the cpus spent in each mode. # TYPE node_cpu counter node_cpu{cpu="cpu0",mode="guest"} 0 node_cpu{cpu="cpu0",mode="idle"} 4533.86 node_cpu{cpu="cpu0",mode="iowait"} 7.36 ... node_cpu{cpu="cpu0",mode="user"} 445.51 node_cpu{cpu="cpu1",mode="guest"} 0 node_cpu{cpu="cpu1",mode="idle"} 4734.47 ... node_cpu{cpu="cpu1",mode="iowait"} 7.41 node_cpu{cpu="cpu1",mode="user"} 576.91 ...
  13. Setup Multidimensional Metric as stored by Prometheus © msg |

    May 2018 | Start your Engines – White Box Monitoring for Load Tests | Alexander Schwartz 19 576.91 cpu: cpu1 instance: 172.17.0.1:9100 job: node-exporter __name__: node_cpu mode: user
  14. Setup Calculations based on metrics © msg | May 2018

    | Start your Engines – White Box Monitoring for Load Tests | Alexander Schwartz 20 Metric: node_cpu: Seconds the CPUs spent in each mode (Type: Counter). What percentage of a CPU is used per core? 1 - rate(node_cpu{mode='idle'} [5m]) What percentage of a CPU is used per instance? avg by (instance) (1 - rate(node_cpu{mode='idle'} [5m])) function filter parameter metric
  15. How to… Information about your containers © msg | May

    2018 | Start your Engines – White Box Monitoring for Load Tests | Alexander Schwartz 21 Presented by: cadvisor RAM Usage per container: Metric: container_memory_usage_bytes Expression: container_memory_usage_bytes{name=~'.+',id=~'/docker/.*'} CPU Usage per container: Metric: container_cpu_usage_seconds_total Expression: rate(container_cpu_usage_seconds_total [30s]) irate(container_cpu_usage_seconds_total [30s]) sum by (instance, name) (irate(container_cpu_usage_seconds_total{name=~'.+'} [15s]))
  16. How to… Information about your JVM © msg | May

    2018 | Start your Engines – White Box Monitoring for Load Tests | Alexander Schwartz 22 Presented by: Java simple_client RAM Usage of Java VM: Metric: jvm_memory_bytes_used Expressions: sum by (instance, job) (jvm_memory_bytes_used) sum by (instance, job) (jvm_memory_bytes_committed) CPU seconds used by Garbage Collection: Metric: jvm_gc_collection_seconds_sum Expression: sum by (job, instance) (irate(jvm_gc_collection_seconds_sum [10s]))
  17. <dependency> <groupId>io.prometheus</groupId> <artifactId>simpleclient_spring_boot</artifactId> <version>${simpleclient.version}</version> </dependency> How to… Information about your

    JVM © msg | May 2018 | Start your Engines – White Box Monitoring for Load Tests | Alexander Schwartz 23 Alternative 1: Add Prometheus‘ Java Simple Client for Spring Boot to serve standard JVM metrics using /prometheus actuator endpoint. @Configuration @EnablePrometheusEndpoint public class ApplicationConfig { @PostConstruct public void metrics() { DefaultExports.initialize(); /* ... */ } }
  18. How to… Information about your JVM © msg | May

    2018 | Start your Engines – White Box Monitoring for Load Tests | Alexander Schwartz 24 Alternative 2: Add a Micrometer.io to serve standard Spring metrics using /prometheus actuator endpoint. <dependency> <groupId>io.micrometer</groupId> <!-- use this with Spring Boot 1.5.x --> <artifactId>micrometer-spring-legacy</artifactId> <version>${micrometer.version}</version> </dependency> <dependency> <groupId>io.micrometer</groupId> <artifactId>micrometer-registry-prometheus</artifactId> <version>${micrometer.version}</version> </dependency>
  19. How to… Information about your Application Metrics © msg |

    May 2018 | Start your Engines – White Box Monitoring for Load Tests | Alexander Schwartz 25 Presented by: Micrometer and Spring Timings of a method call: Java Annotation: @Timed(value = "doSomething", description = "...") Metrics: doSomething_count doSomething_sum
  20. How to… Information about your Application Metrics © msg |

    May 2018 | Start your Engines – White Box Monitoring for Load Tests | Alexander Schwartz 26 Add a Configuration to collect timings from Annotations. @Configuration public class MetricsApplicationConfig { // as of now, this aspect needs to be created manually, see // https://github.com/micrometer-metrics/micrometer/issues/361 @Bean public TimedAspect timedAspect(MeterRegistry registry) { return new TimedAspect(registry); } }
  21. How to… Information about your Application Metrics © msg |

    May 2018 | Start your Engines – White Box Monitoring for Load Tests | Alexander Schwartz 27 Add @Timed annotations to any method of any Bean to collect metrics @Component public class ServiceClass { @Timed(value = "doSomething", description = "...") public void doSomething() { log.info("hi"); } }
  22. How to… Information about your External Interfaces © msg |

    May 2018 | Start your Engines – White Box Monitoring for Load Tests | Alexander Schwartz 28 Presented by: Java simple_client, Hystrix/Spring Hystrix Metrics: Java Annotation: @HystrixCommand Metrics: hystrix_command_total {command_name="externalCall", …} hystrix_command_event_total {command_name="externalCall", event="success", …} Expressions: histogram_quantile(0.99, rate(hystrix_command_latency_execute_seconds_bucket[1m]))
  23. How to… Information about your External Interfaces – Hystrix Metrics

    © msg | May 2018 | Start your Engines – White Box Monitoring for Load Tests | Alexander Schwartz 29 Register the Hystrix Publisher and add @HystrixCommand for resilience and timing of external calls. HystrixPrometheusMetricsPublisher.builder() /*...*/ .register(); @Component public class ExternalInterfaceAdapter { @HystrixCommand(commandKey = "externalCall", groupKey = "interfaceOne") public String call() { /* ... */ } }
  24. Start your Engines – Whitebox Monitoring for your Load Tests

    30 © msg | May 2018 | Start your Engines – White Box Monitoring for Load Tests | Alexander Schwartz Why to use load tests 1 Setup of the test environment 2 Demo 3 What to expect 4
  25. Demo © msg | May 2018 | Start your Engines

    – White Box Monitoring for Load Tests | Alexander Schwartz 31
  26. Start your Engines – Whitebox Monitoring for your Load Tests

    32 © msg | May 2018 | Start your Engines – White Box Monitoring for Load Tests | Alexander Schwartz Why to use load tests 1 Setup of the test environment 2 Demo 3 What to expect 4
  27. What to expect Metrics the teams used in their Dashboards

    to monitor tests © msg | May 2018 | Start your Engines – White Box Monitoring for Load Tests | Alexander Schwartz 33 From infrastructure: • CPU usage per container • RAM usage per container From application: • Standard runtime metrics • Counters • Gauges [gājez] for Queues and Pools • Dropwizard and Micrometer Metrics • Timings for dependent services from Neflix’ circuit breaker library Hystrix
  28. What to expect 1. http://www.brendangregg.com/usemethod.html 2. https://www.weave.works/blog/prometheus-and-kubernetes-monitoring-your-applications/ 3. https://landing.google.com/sre/book/chapters/monitoring-distributed-systems.html#xref_monitoring_golden-signals Lessons

    learned © msg | May 2018 | Start your Engines – White Box Monitoring for Load Tests | Alexander Schwartz 34 The approach worked well for us to pass the load tests: • Load Tool metrics correlated with application and infrastructure metrics • Inter-application communication captured by Hystrix • Self-service functionality for product teams to add applications and metrics … but to use the instrumentation also in production create awareness for: • Exported metrics should following Prometheus naming conventions • Collector for Dropwizard Metrics can’t fill HELP text of metrics • Counters and averages vs. histograms, summaries and percentiles • Consistent use of either USE Method (utilization – saturation – errors), RED Method (rate – errors – duration) or Google’s Four Golden Signals (latency – traffic – errors – saturation) for metrics
  29. Prometheus works for Developers (and Ops) Prometheus is “friendly tech”

    in your environment © msg | May 2018 | Start your Engines – White Box Monitoring for Load Tests | Alexander Schwartz 35 Team friendly • Every team can run its own Prometheus instance to monitor their own and neighboring systems • Flexible to collect and aggregate the information that is needed Coder and Continuous Delivery friendly • All configurations (and exported dashboard) are kept as code and are guarded by version control • Changes can be tested locally and easily staged to the next environment Simple Setup • Go binaries for prometheus and alertmanager available for major operating systems • Client libraries for several languages available (also adapters to existing metrics libraries) • Several existing exporters for various needs
  30. Links © msg | May 2018 | Start your Engines

    – White Box Monitoring for Load Tests | Alexander Schwartz 36 Prometheus: https://prometheus.io Java Simple Client https://github.com/prometheus/client_java Dropwizard Metrics http://metrics.dropwizard.io Prometheus Hystrix Metrics Publisher https://github.com/ahus1/prometheus-hystrix Micrometer.io https://micrometer.io @ahus1de Apache JMeter http://jmeter.apache.org/ Gatling http://gatling.io/ CAdvisor https://github.com/google/cadvisor Link to Videos and Slides https://www.ahus1.de/post/prometheus-and- grafana-talks
  31. .consulting .solutions .partnership Alexander Schwartz Principal IT Consultant +49 171

    5625767 [email protected] @ahus1de msg systems ag (Headquarters) Robert-Buerkle-Str. 1, 85737 Ismaning Germany www.msg.group