Upgrade to Pro — share decks privately, control downloads, hide ads and more …

The decksh tutorial

The decksh tutorial

A tutorial for decksh.

Avatar for Anthony Starks

Anthony Starks

August 17, 2026

More Decks by Anthony Starks

Other Decks in Design

Transcript

  1. Introduction decksh is a Domain-Specific Language (DSL) for making presentations,

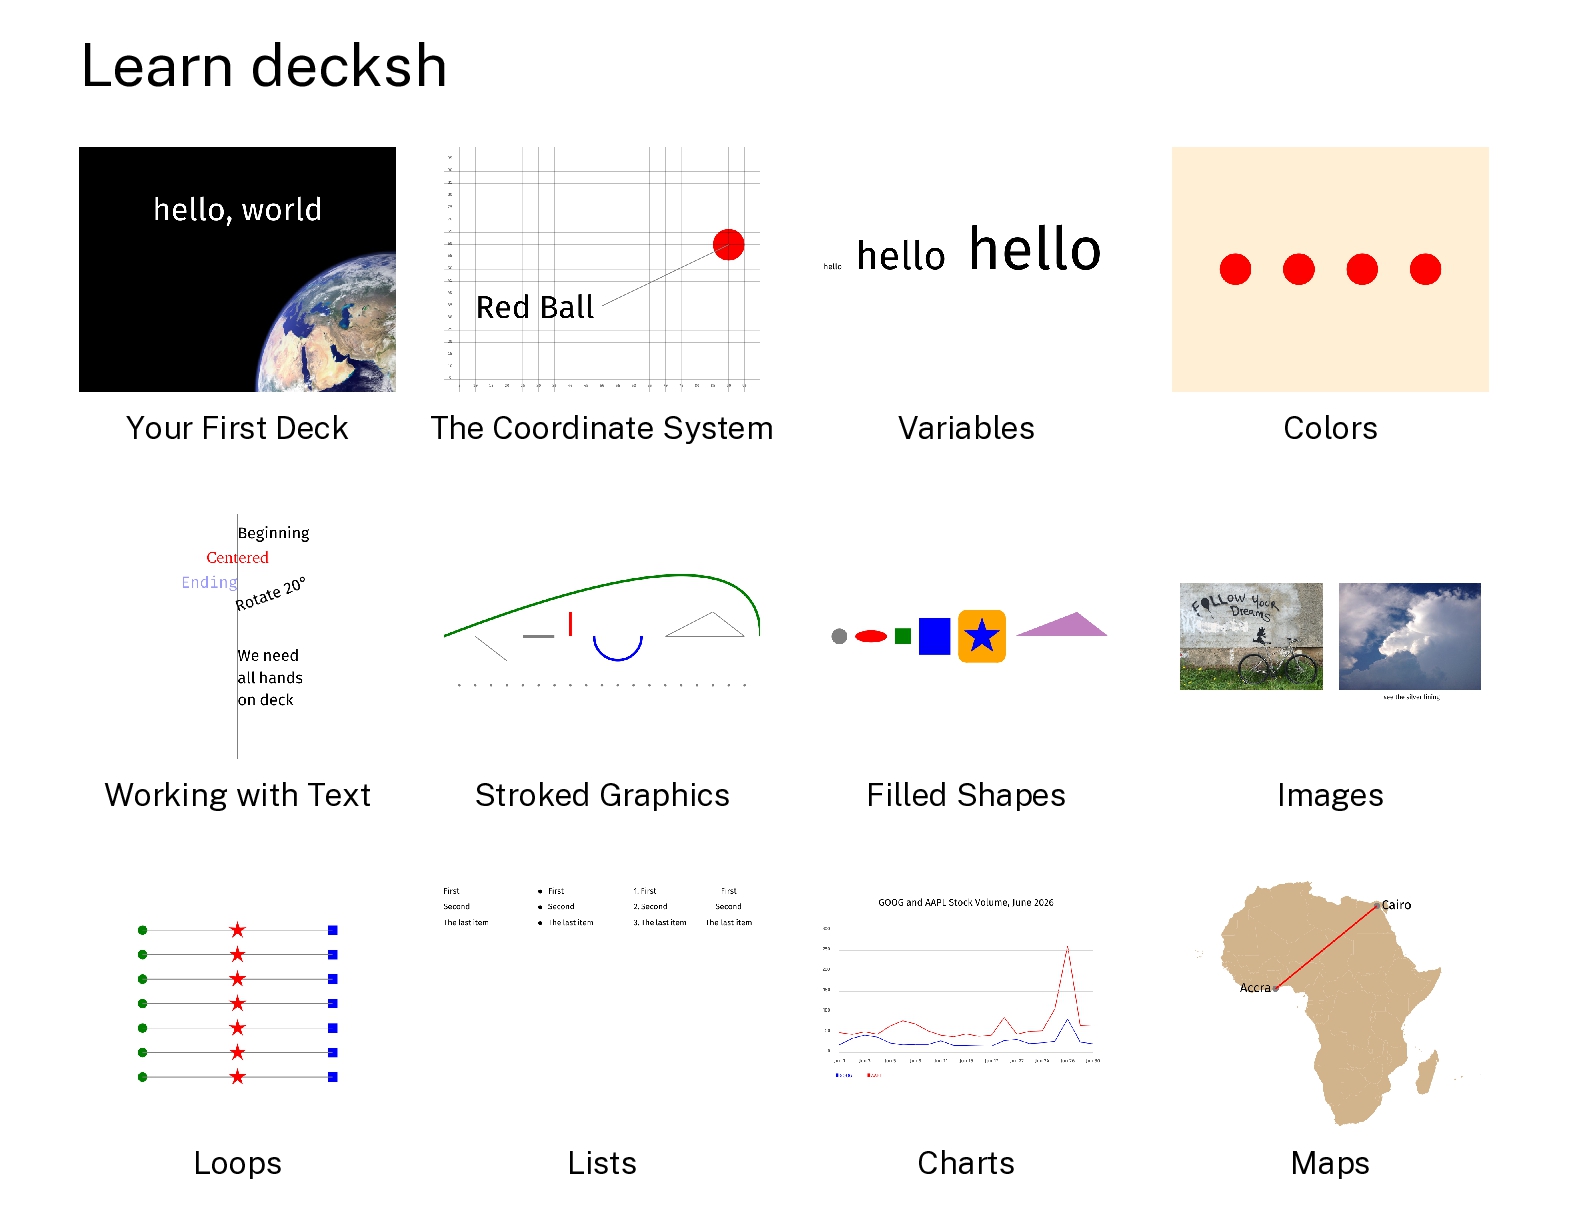
    visualizations, and information displays. decksh works differently from other presentation programs like PowerPoint or Keynote, in that you “program” your deck; that is you build up your slides by specifying high-level objects that represent the elements and attributes of your presentation (text, graphics, lists, charts, maps, etc). The elements are placed and sized using a scalable, percent-based coordinate system, and you can also use variables to describe positions and relationships between the elements. This tutorial describes installation and basic workflows, and then walks you through various aspects of the language including the coordinate system, the use of variables, colors, text, graphics, images, loops and lists. The tutorial concludes with more advanced topics like charts and maps. Each concept includes explanatory text, with copy-paste-able examples, and the resulting deck output. Program your presentations with clean design and precision. [1]
  2. Sections The Canvas Your First Deck Coordinates Variables Colors Text

    Stroked Graphics Filled Shapes Images Loops Lists Charts Maps Regions Tools Example Bonus You have to learn to look at the whole of something, not just the parts. [2]
  3. Gather your tools In order to make presentations with decksh

    you will need: (1) the decksh command-line tool, (2) a text editor to compose and edit the decksh code, (3) a place to execute decksh commands, (4) a PDF viewer to see the results. See “Installing and Running decksh/pdfdeck” (https://speakerdeck.com/ajstarks/pdfdeck) for installation instructions. Any editor that works with plain text files can be used to compose decksh code. Examples include vim, VS Code, Sublime Text, zed, BBEdit, and micro. All of these editors have syntax highlighting support for decksh, and some editors can automate deck creation. The general workflow is to compose your decksh code in the text editor, invoke the command to make the result, and then show the results in your PDF viewer. (lines beginning with '$' are the command line prompt) $ decksh first.dsh > first.xml $ pdfdeck first.xml $ open first.pdf The example on the right uses Sublime Text for the editor, ghostty for the terminal and Preview as the PDF viewer. We become what we behold. We shape our tools, and thereafter our tools shape us. [3]
  4. The Slide Canvas decksh uses a size independent coordinate system,

    but when designing your slides you should be aware of the canvas size, especially the aspect ratio. By default, pdfdeck uses a landscape US Letter size (8½ inches high and 11 inches wide), which translates to 792x612 points at 72 points per inch. Other presets include A3, A4, A5, US Legal (8½ x 14 inches) and Tabloid (11x17 inches). You can also use an arbitrary size such as 1600x900. Specify the pagesize using the pdfdeck command: $ pdfdeck -pagesize A4 ... $ pdfdeck -pagesize 1600x900 ... The shape of the slide canvas is useful when designing your decks. For example a widescreen format like 16:9 is useful for showing multiple images horizontally. Letter and A4 provide a good balance of horizontal and vertical space. Use the flexible canvas to your advantage. [4]
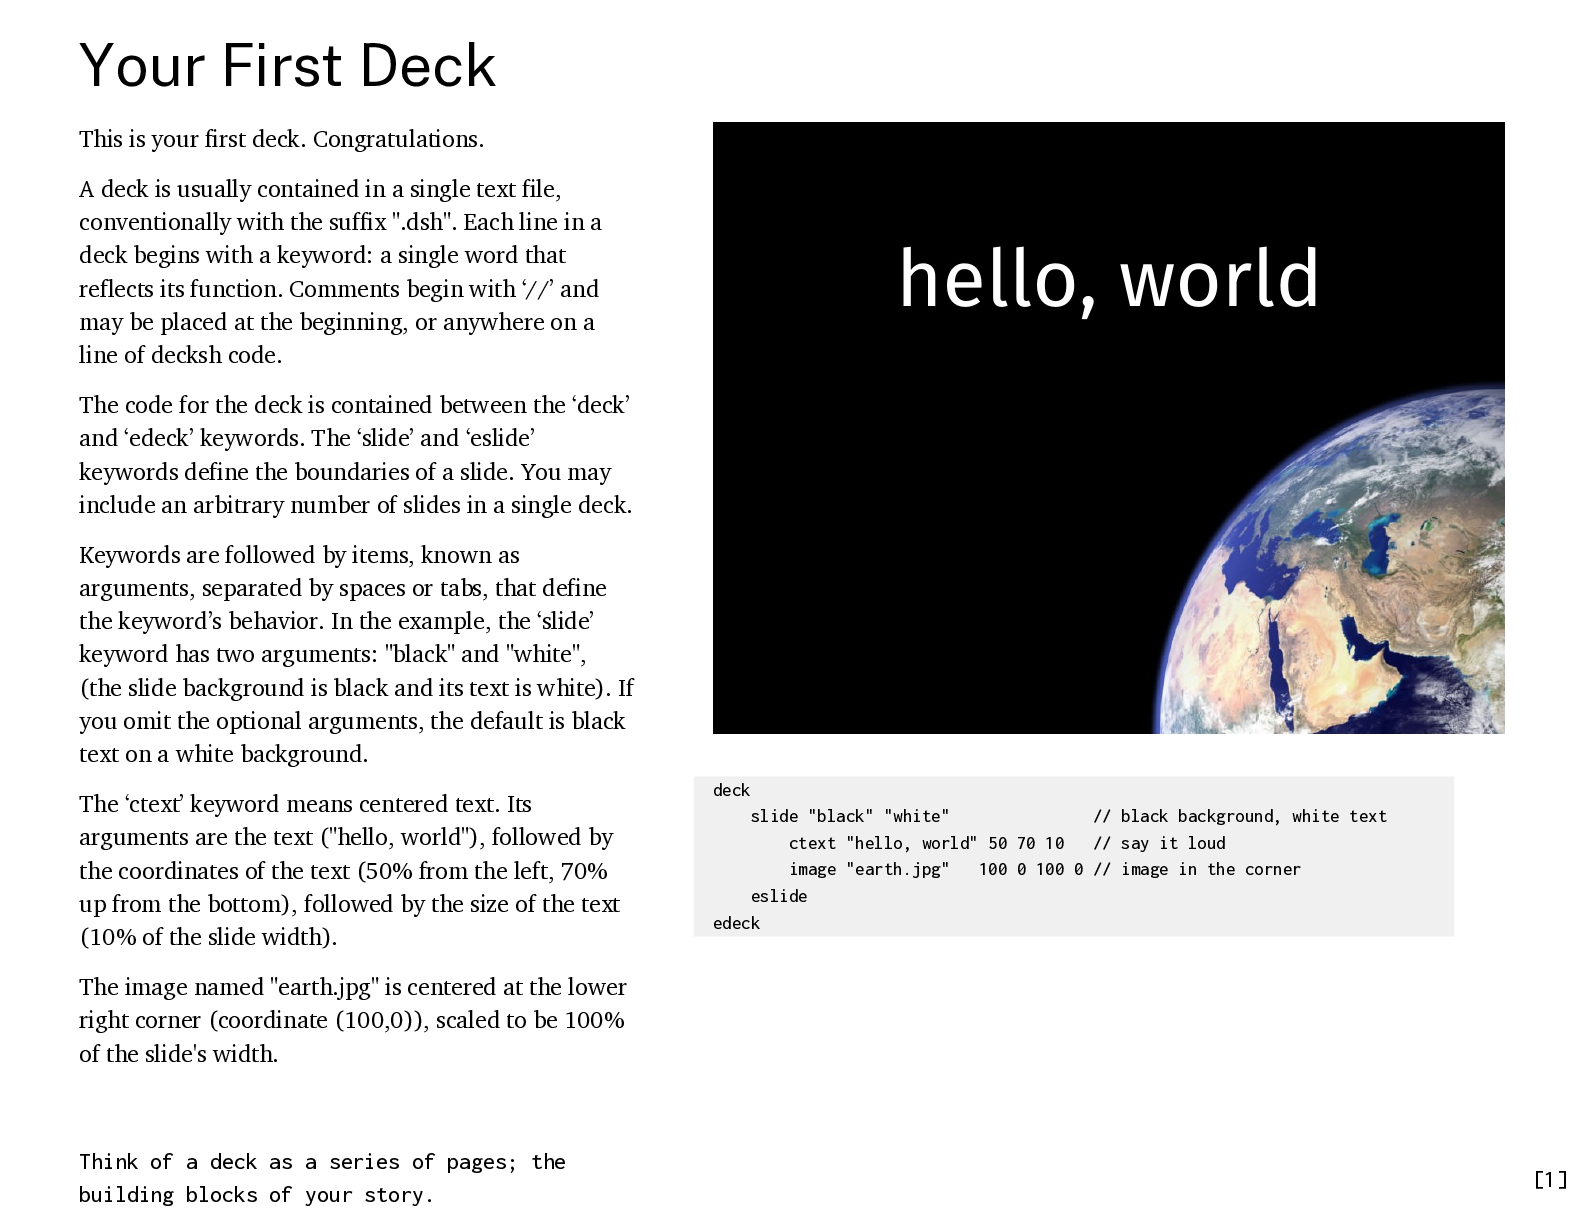
  5. Your First Deck This is your first deck. Congratulations. A

    deck is usually contained in a single text file, conventionally with the suffix ".dsh". Each line in a deck begins with a keyword: a single word that reflects its function. Comments begin with ‘//’ and may be placed at the beginning, or anywhere on a line of decksh code. The code for the deck is contained between the ‘deck’ and ‘edeck’ keywords. The ‘slide’ and ‘eslide’ keywords define the boundaries of a slide. You may include an arbitrary number of slides in a single deck. Keywords are followed by items, known as arguments, separated by spaces or tabs, that define the keyword’s behavior. In the example, the ‘slide’ keyword has two arguments: "black" and "white", (the slide background is black and its text is white). If you omit the optional arguments, the default is black text on a white background. The ‘ctext’ keyword means centered text. Its arguments are the text ("hello, world"), followed by the coordinates of the text (50% from the left, 70% up from the bottom), followed by the size of the text (10% of the slide width). deck slide "black" "white" // black background, white text ctext "hello, world" 50 70 10 // say it loud image "earth.jpg" 100 0 100 0 // image in the corner eslide edeck The image named "earth.jpg" is centered at the lower right corner (coordinate (100,0)), scaled to be 100% of the slide's width. Think of a deck as a series of pages; the building blocks of your story. [5]
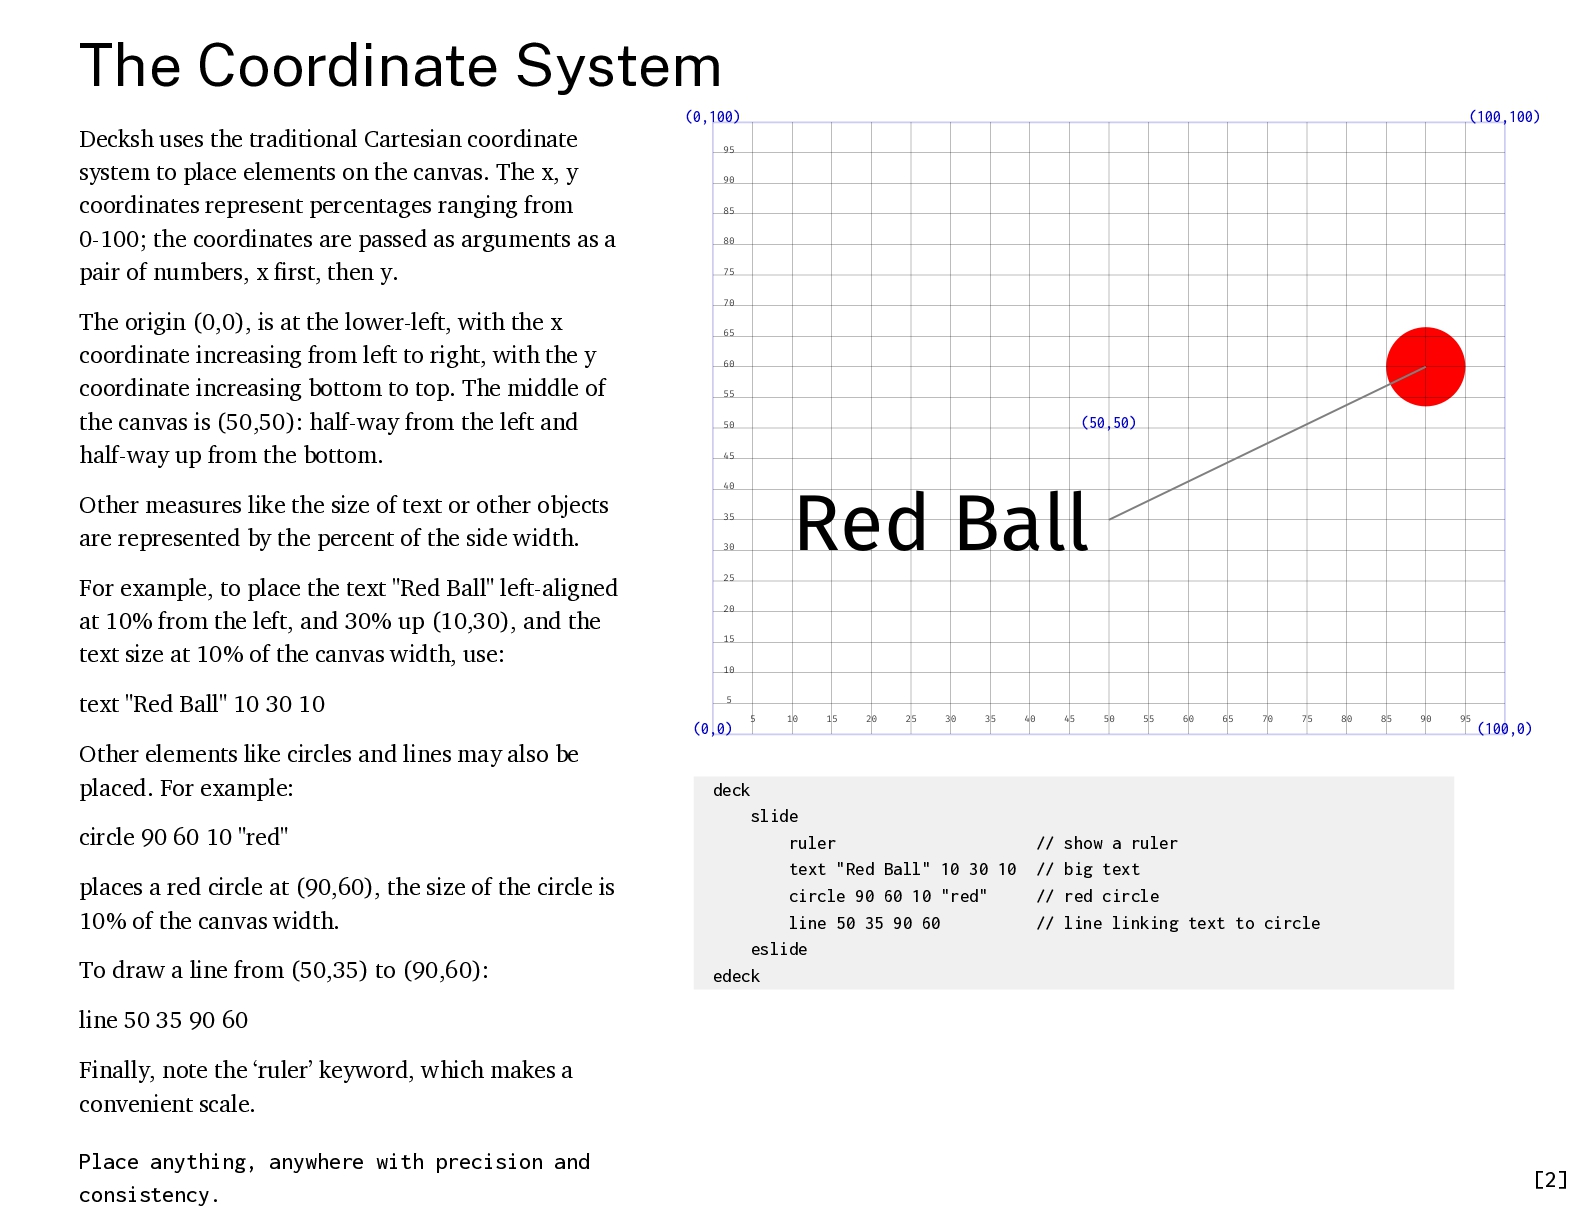
  6. The Coordinate System decksh uses the traditional Cartesian coordinate system

    to place elements on the canvas. The x, y coordinates represent percentages ranging from 0-100; the coordinates are passed as arguments as a pair of numbers, x first, then y. (0,100) The origin (0,0), is at the lower-left, with the x coordinate increasing from left to right, with the y coordinate increasing bottom to top. The middle of the canvas is (50,50): half-way from the left and half-way up from the bottom. (100,100) (50,50) Other measures like the size of text or other objects are represented by the percent of the side width. For example, to place the text "Red Ball" left-aligned at 10% from the left, and 30% up (10,30), and the text size at 10% of the canvas width, use: text "Red Ball" 10 30 10 Other elements like circles and lines may also be placed. For example: circle 90 60 10 "red" places a red circle at (90,60), the size of the circle is 10% of the canvas width. To draw a line from (50,35) to (90,60): (0,0) (100,0) deck slide ruler text "Red Ball" 10 30 10 circle 90 60 10 "red" line 50 35 90 60 eslide edeck // show a ruler // big text // red circle // line linking text to circle line 50 35 90 60 Finally, note the ‘ruler’ keyword, which makes a convenient scale. Place anything, anywhere with precision and consistency. [6]
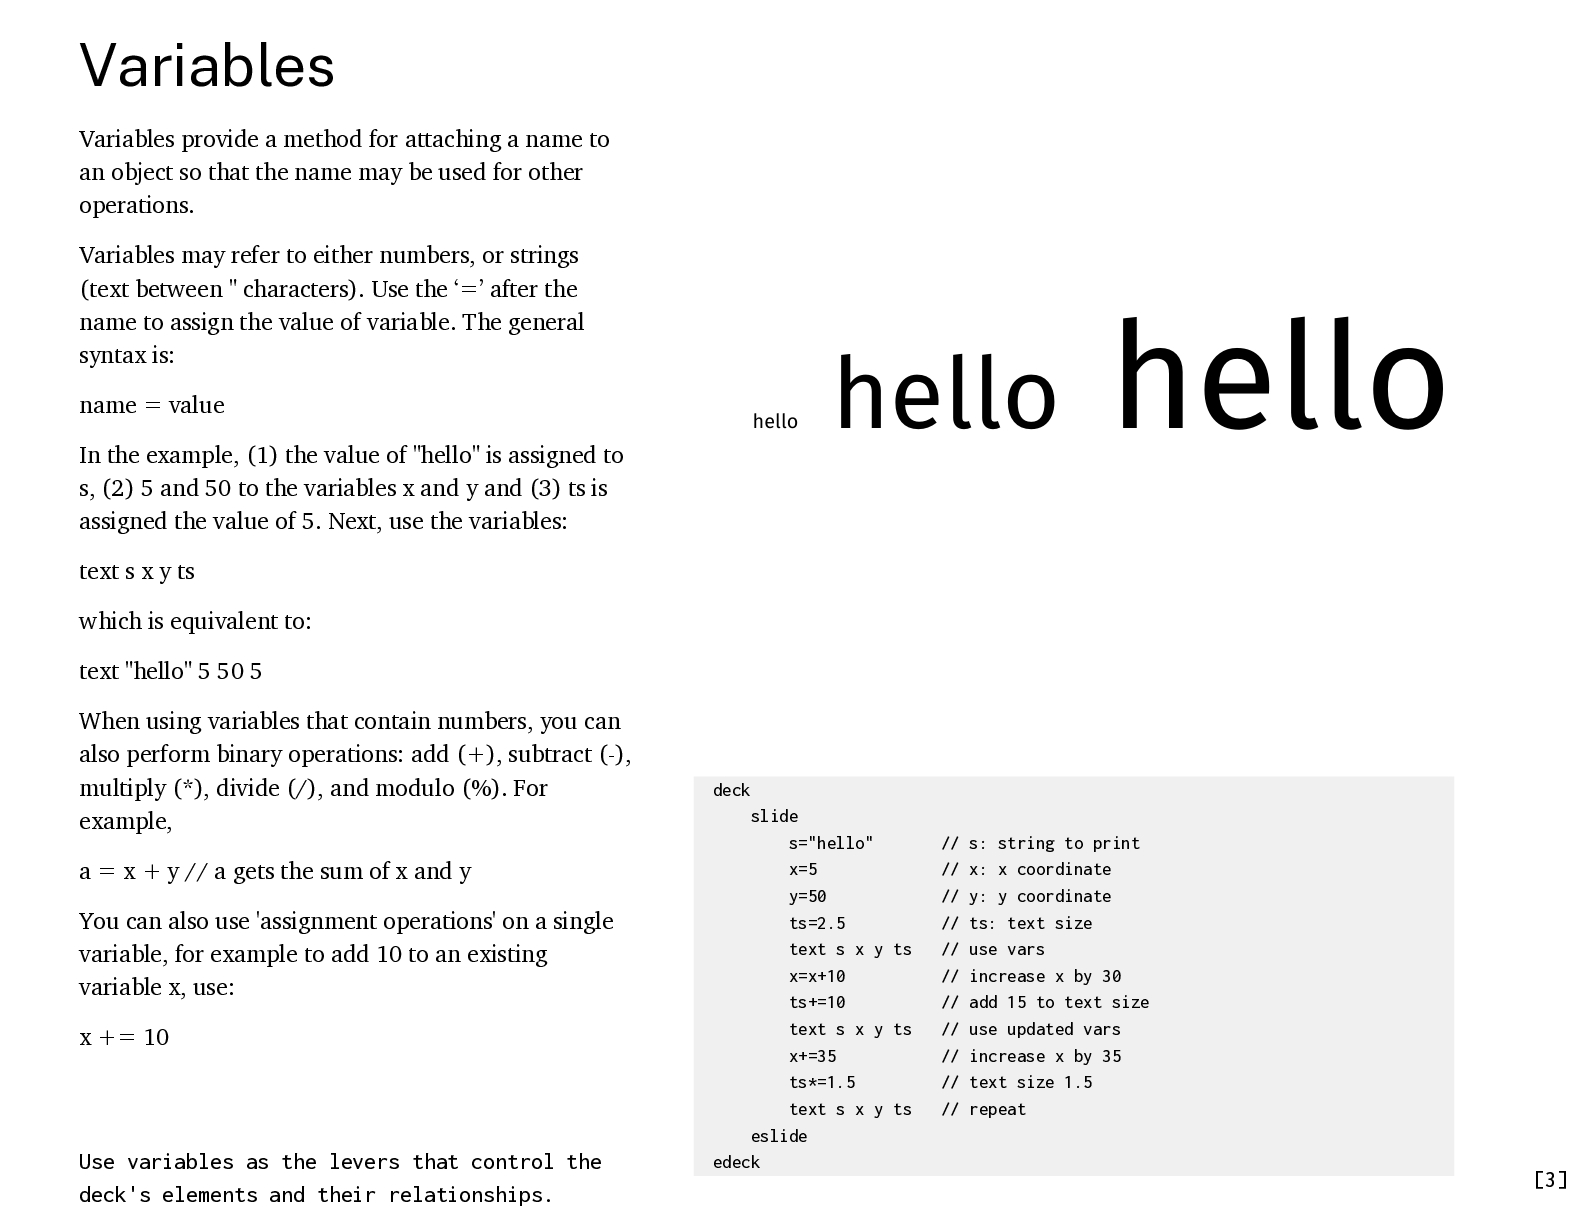
  7. Variables Variables provide a method for attaching a name to

    an object so that the name may be used for other operations. Variables may refer to either numbers, or strings (text between " characters). Use the ‘=’ after the name to assign the value of variable. The general syntax is: name = value In the example, the value of "hello" is assigned to s, 5 and 50 are assigned to x and y, and ts is assigned the value of 2.5. Next, use the variables: text s x y ts which is equivalent to: text "hello" 5 50 2.5 When using variables that contain numbers, you can also perform binary operations: add (+), subtract (-), multiply (*), divide (/), and modulo (%). For example, a = x + y // a gets the sum of x and y You can also use 'assignment operations' on a single variable, for example to add 10 to an existing variable x, use: x += 10 Use variables as the levers that control the deck's elements and their relationships. deck slide s="hello" x=5 y=50 ts=2.5 text s x y ts x=x+10 ts+=10 text s x y ts x+=35 ts*=1.5 text s x y ts eslide edeck // s: string to print // x: x coordinate // y: y coordinate // ts: text size // use vars // increase x by 10 // add 10 to text size // use updated vars // increase x by 35 // text size 1.5 // repeat [7]
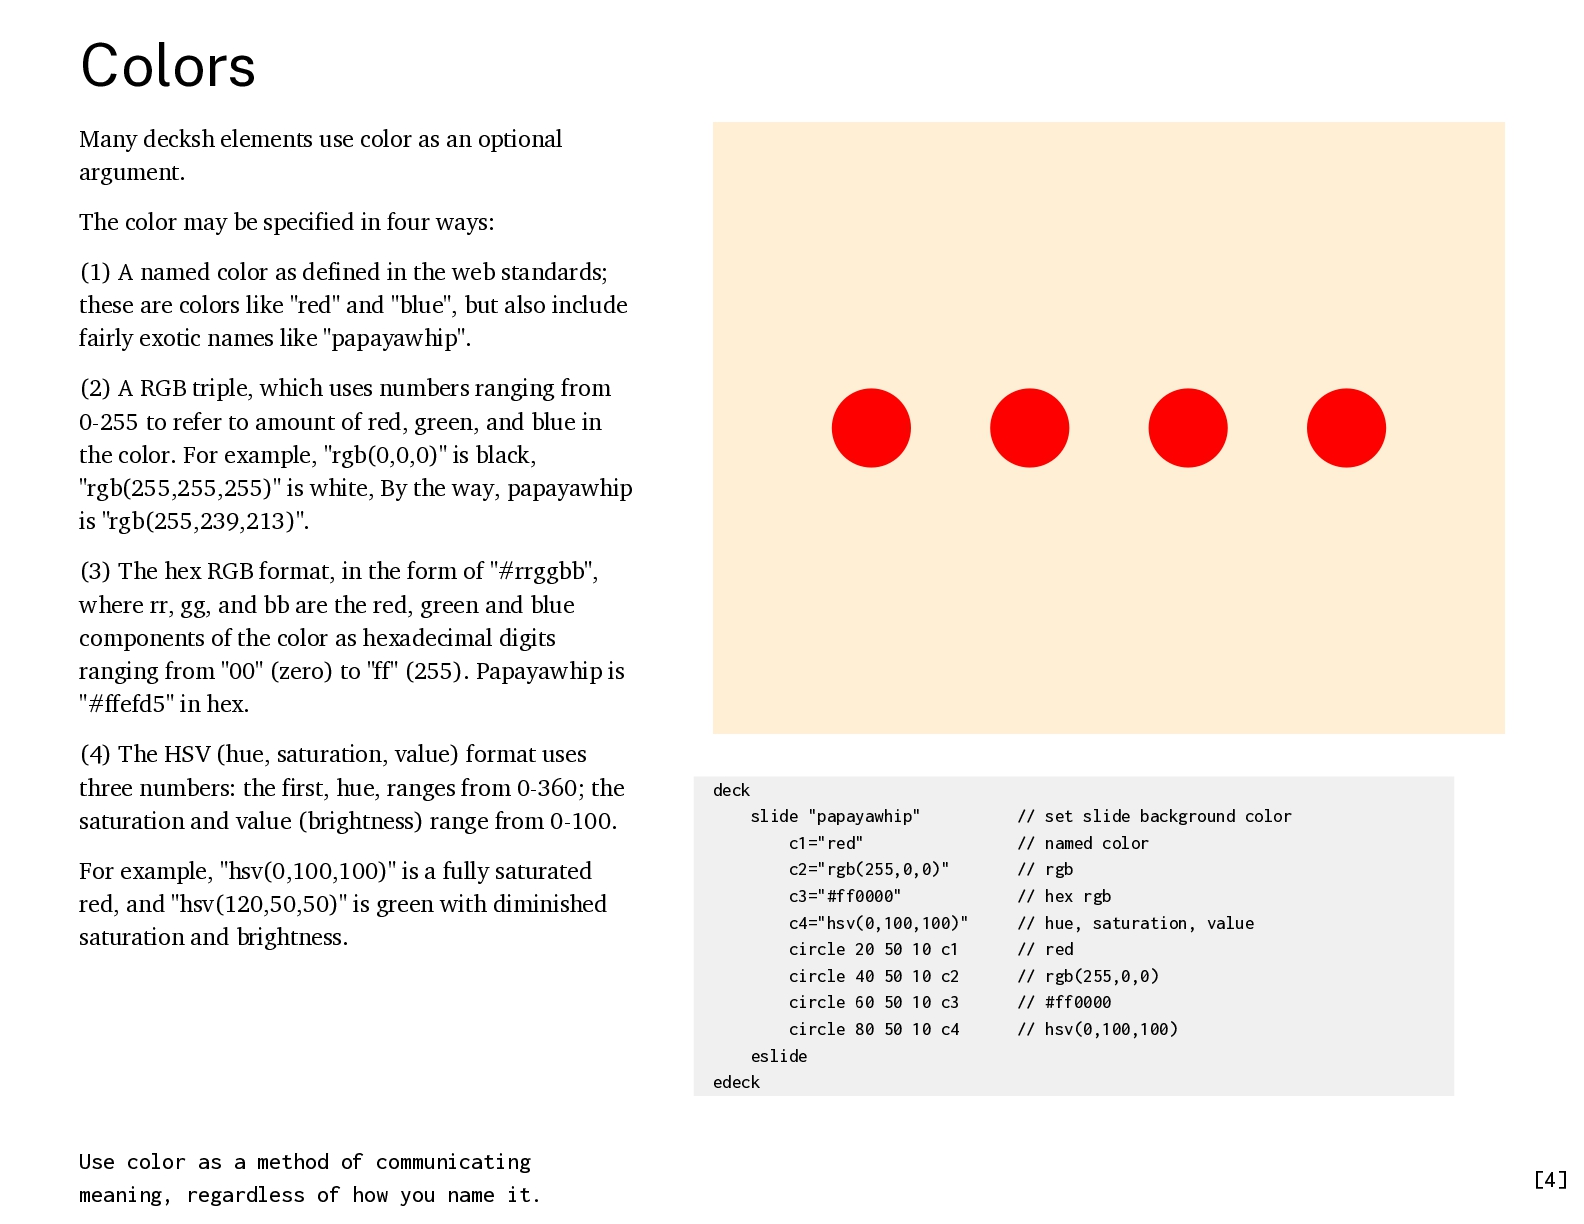
  8. Colors Many decksh elements use color as an optional argument.

    The color may be specified in four ways: (1) A named color as defined in the web standards; these are colors like "red" and "blue", but also include fairly exotic names like "papayawhip". (2) A RGB triple, which uses numbers ranging from 0-255 to refer to amount of red, green, and blue in the color. For example, "rgb(0,0,0)" is black, "rgb(255,255,255)" is white, By the way, papayawhip is "rgb(255,239,213)". (3) The hex RGB format, in the form of "#rrggbb", where rr, gg, and bb are the red, green and blue components of the color as hexadecimal digits ranging from "00" (zero) to "ff" (255). Papayawhip is "#ffefd5" in hex. (4) The HSV (hue, saturation, value) format uses three numbers: the first, hue, ranges from 0-360; the saturation and value (brightness) range from 0-100. For example, "hsv(0,100,100)" is a fully saturated red, and "hsv(120,50,50)" is green with diminished saturation and brightness. Use color as a method of communicating meaning, regardless of how you name it. deck slide "papayawhip" c1="red" c2="rgb(255,0,0)" c3="#ff0000" c4="hsv(0,100,100)" circle 20 50 10 c1 circle 40 50 10 c2 circle 60 50 10 c3 circle 80 50 10 c4 eslide edeck // set slide background color // named color // rgb // hex rgb // hue, saturation, value // red // rgb(255,0,0) // #ff0000 // hsv(0,100,100) [8]
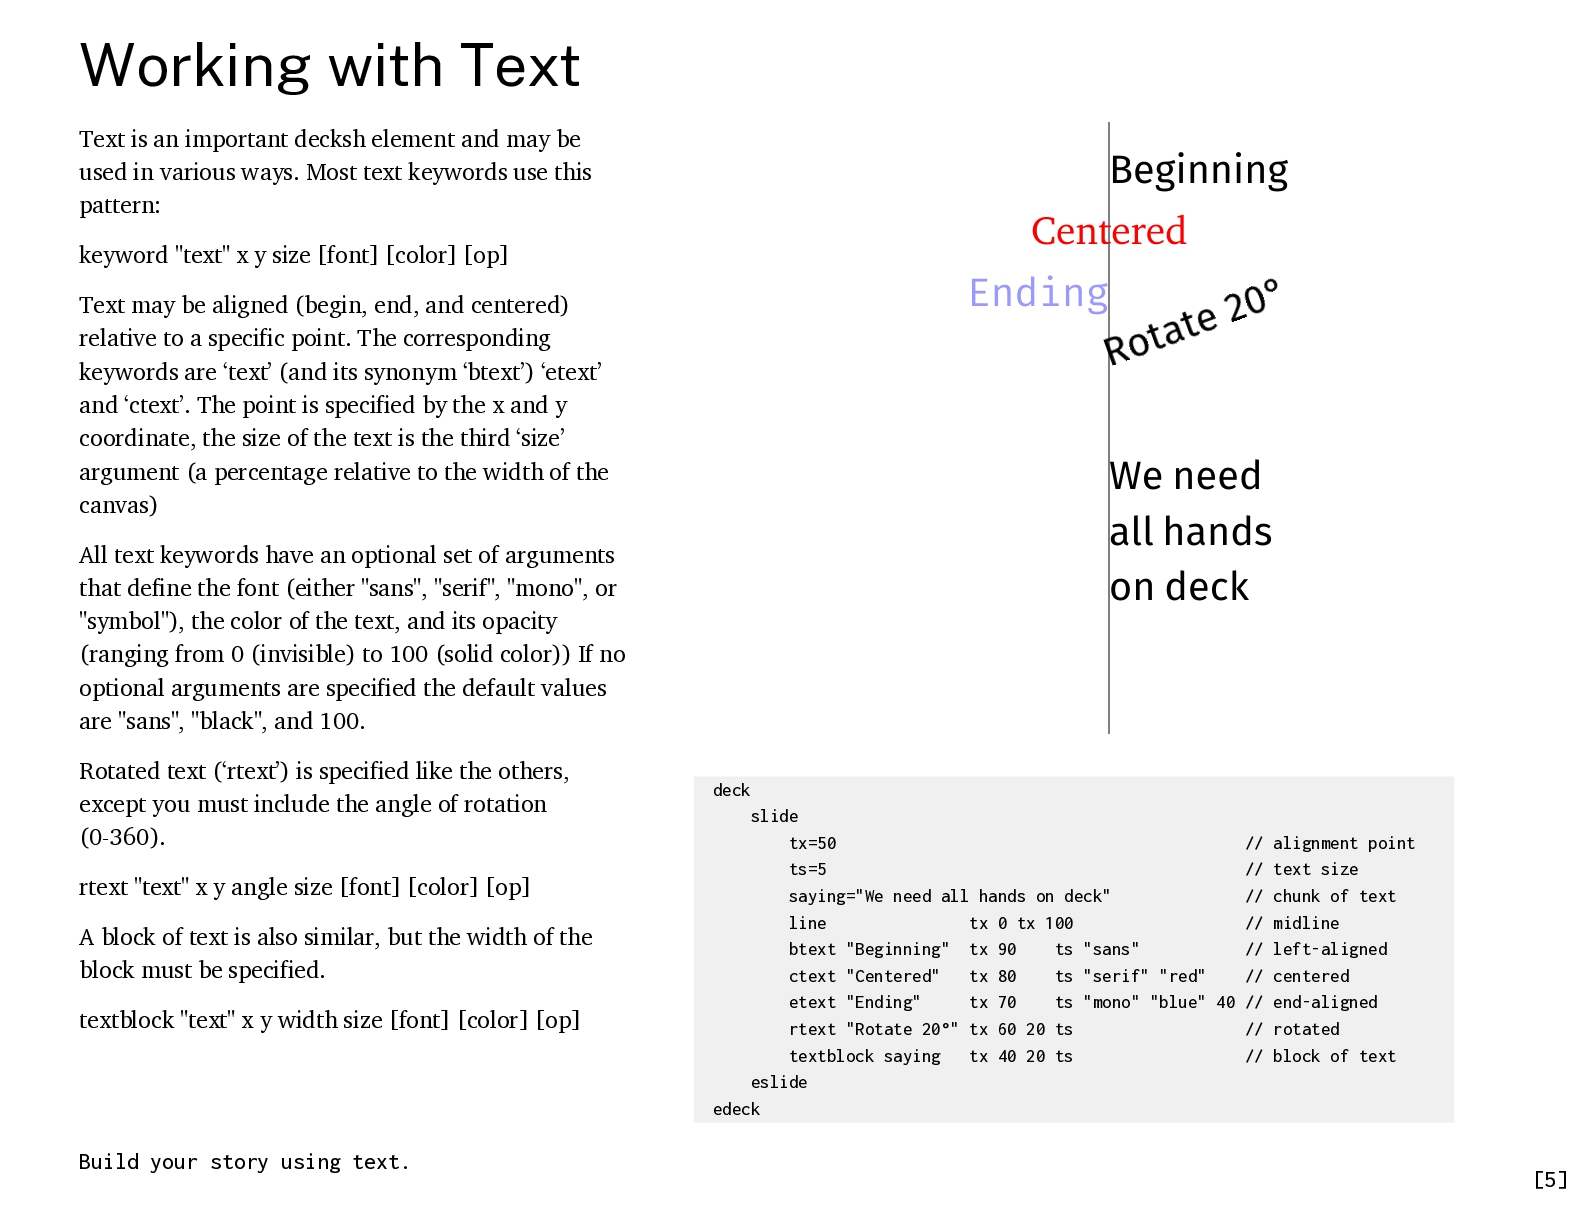
  9. Working with Text Text is an important decksh element and

    may be used in various ways. Most text keywords use this pattern: keyword "text" x y size [font] [color] [op] Text may be aligned (begin, end, and centered) relative to a specific point. The corresponding keywords are ‘text’ (and its synonym ‘btext’) ‘etext’ and ‘ctext’. The point is specified by the x and y coordinate, the size of the text is the third ‘size’ argument (a percentage relative to the width of the canvas) All text keywords have an optional set of arguments that define the font (either "sans", "serif", "mono", or "symbol"), the color of the text, and its opacity (ranging from 0 (invisible) to 100 (solid color)) If no optional arguments are specified the default values are "sans", "black", and 100. Rotated text (‘rtext’) is specified like the others, except you must include the angle of rotation (0-360). rtext "text" x y angle size [font] [color] [op] A block of text is also similar, but the width of the block must be specified. textblock "text" x y width size [font] [color] [op] Build your story using text. deck slide tx=50 // alignment point ts=5 // text size saying="We need all hands on deck" // chunk of text line tx 0 tx 100 // midline btext "Beginning" tx 90 ts "sans" // left-aligned ctext "Centered" tx 80 ts "serif" "red" // centered etext "Ending" tx 70 ts "mono" "blue" 40 // end-aligned rtext "Rotate 20°" tx 60 20 ts // rotated textblock saying tx 40 20 ts // block of text eslide edeck [9]
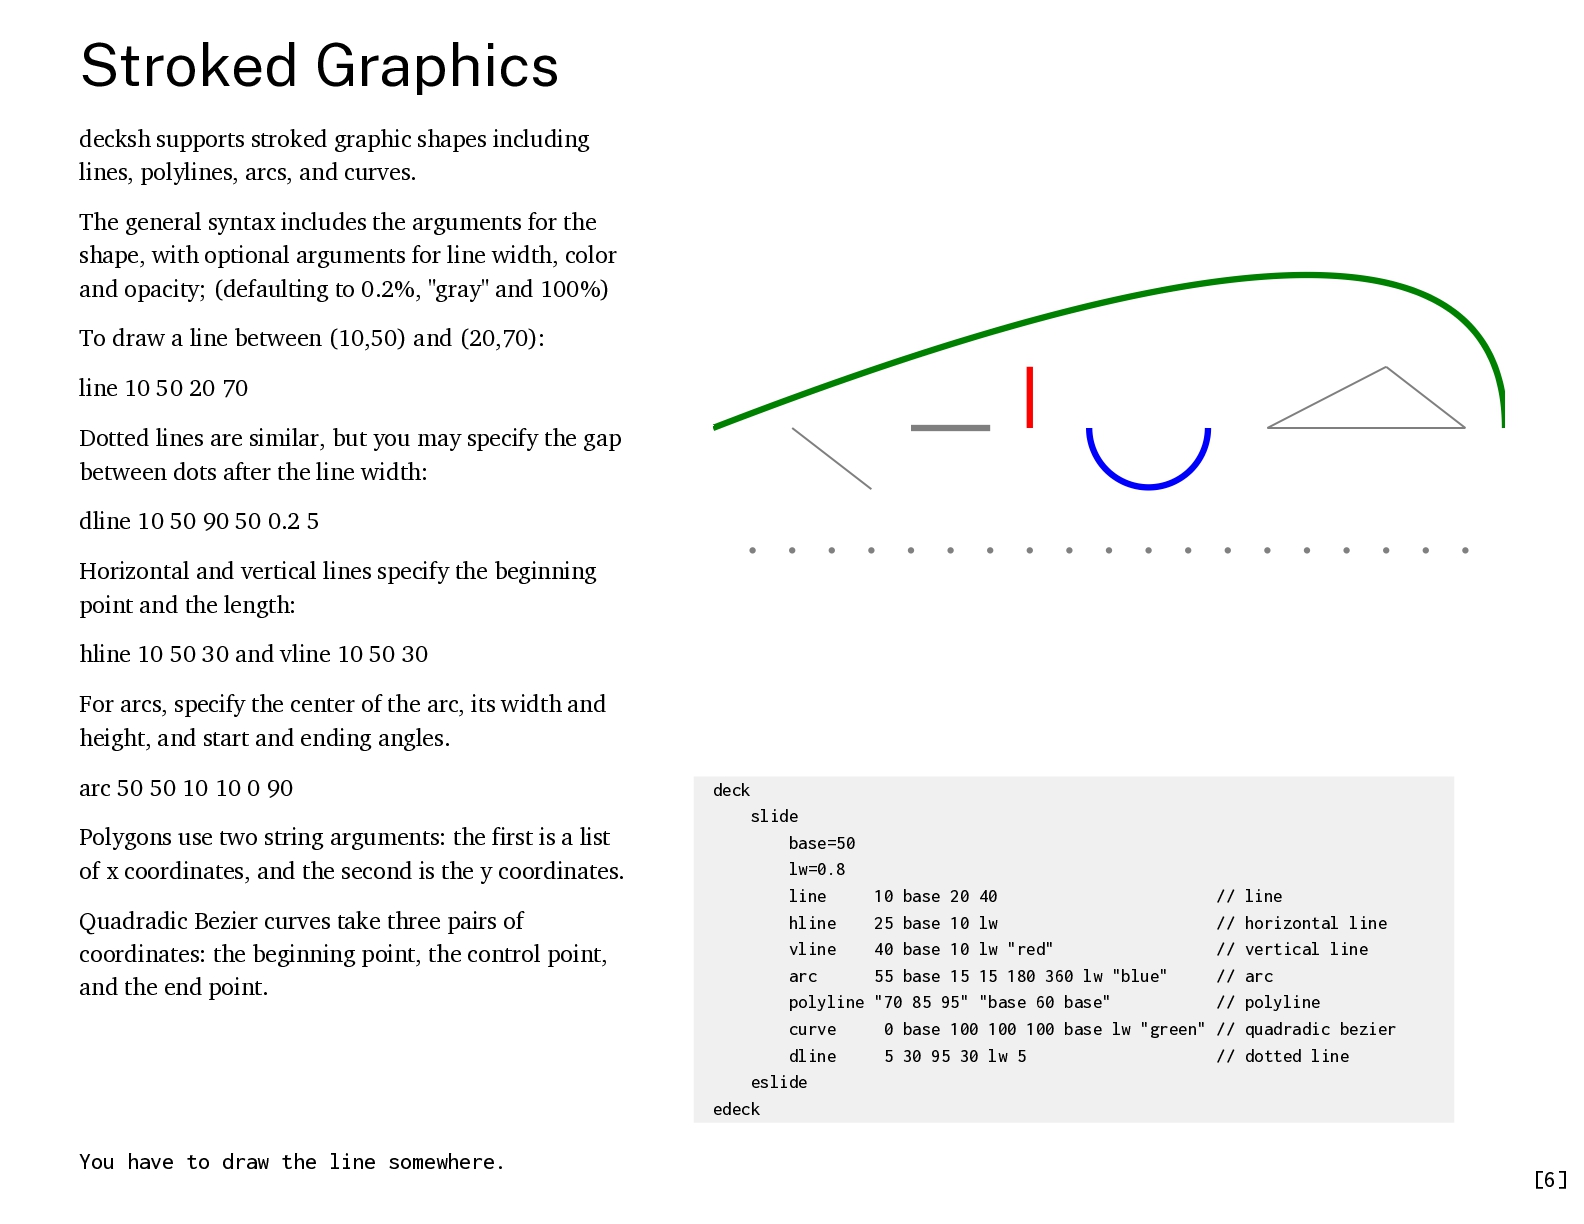
  10. Stroked Graphics decksh supports stroked graphic shapes including lines, polylines,

    arcs, and curves. The general syntax includes the arguments for the shape, with optional arguments for line width, color and opacity; (defaulting to 0.2%, "gray" and 100%) To draw a line between (10,50) and (20,70): line 10 50 20 70 Dotted lines are similar, but you may specify the gap between dots after the line width: dline 10 50 90 50 0.2 5 Horizontal and vertical lines specify the beginning point and the length: hline 10 50 30 and vline 10 50 30 For arcs, specify the center of the arc, its width and height, and start and ending angles. arc 50 50 10 10 0 90 Polygons use two string arguments: the first is a list of x coordinates, and the second is the y coordinates. Quadratic Bezier curves take three pairs of coordinates: the beginning point, the control point, and the end point. You have to draw the line somewhere. deck slide base=50 lw=0.8 line 10 base 20 40 // line hline 25 base 10 lw // horizontal line vline 40 base 10 lw "red" // vertical line arc 55 base 15 15 180 360 lw "blue" // arc polyline "70 85 95" "base 60 base" // polyline curve 0 base 100 100 100 base lw "green" // quadratic bezier dline 5 30 95 30 lw 5 // dotted line eslide edeck [10]
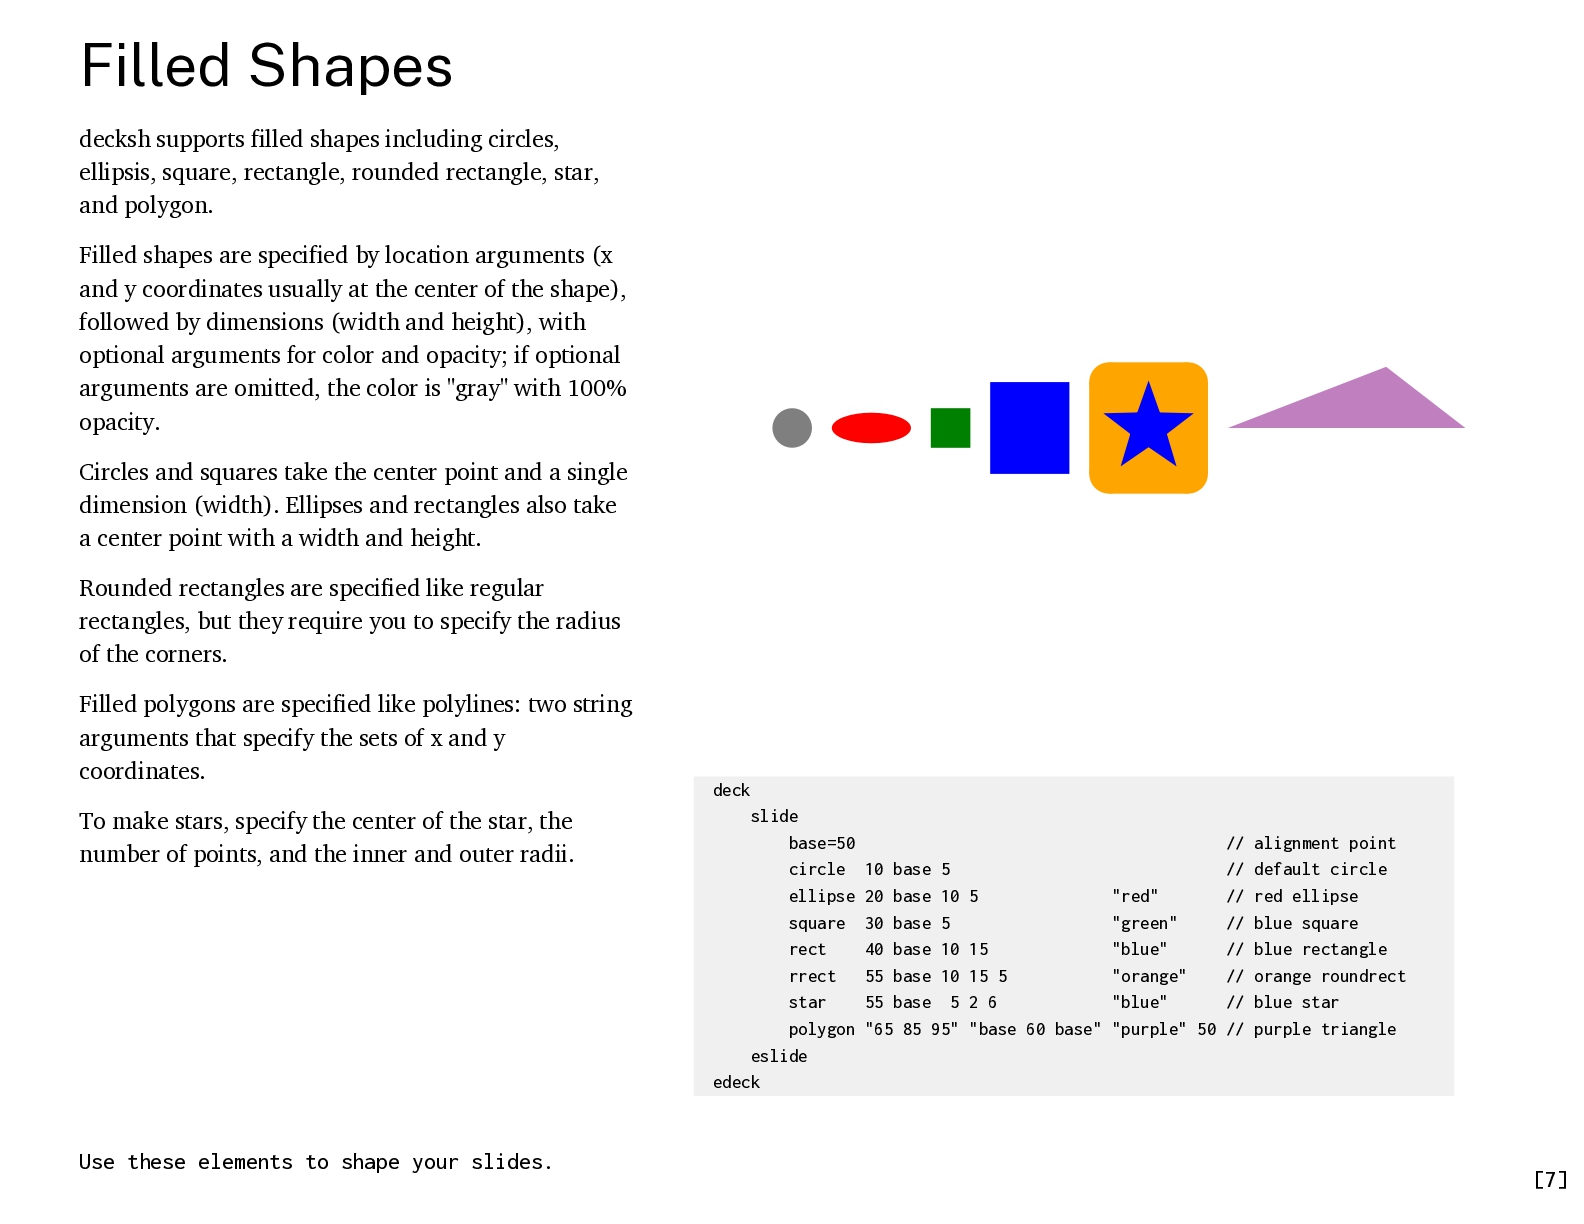
  11. Filled Shapes decksh supports filled shapes including circle, ellipse, square,

    rectangle, rounded rectangle, star, and polygon. Filled shapes are specified by location arguments (x and y coordinates usually at the center of the shape), followed by dimensions (width and height), with optional arguments for color and opacity; if optional arguments are omitted, the color is "gray" with 100% opacity. Circles and squares take the center point and a single dimension (width). Ellipses and rectangles also take a center point with a width and height. Rounded rectangles are specified like regular rectangles, but they require you to specify the radius of the corners. Filled polygons are specified like polylines: two string arguments that specify the sets of x and y coordinates. To make stars, specify the center of the star, the number of points, and the inner and outer radii. Use these elements to shape your slides. deck slide base=50 // alignment point circle 10 base 5 // default circle ellipse 20 base 10 5 "red" // red ellipse square 30 base 5 "green" // green square rect 40 base 10 15 "blue" // blue rectangle rrect 55 base 10 15 5 "orange" // orange roundrect star 55 base 5 2 6 "blue" // blue star polygon "65 85 95" "base 60 base" "purple" 50 // purple triangle eslide edeck [11]
  12. Images An image is the welcome companion to text and

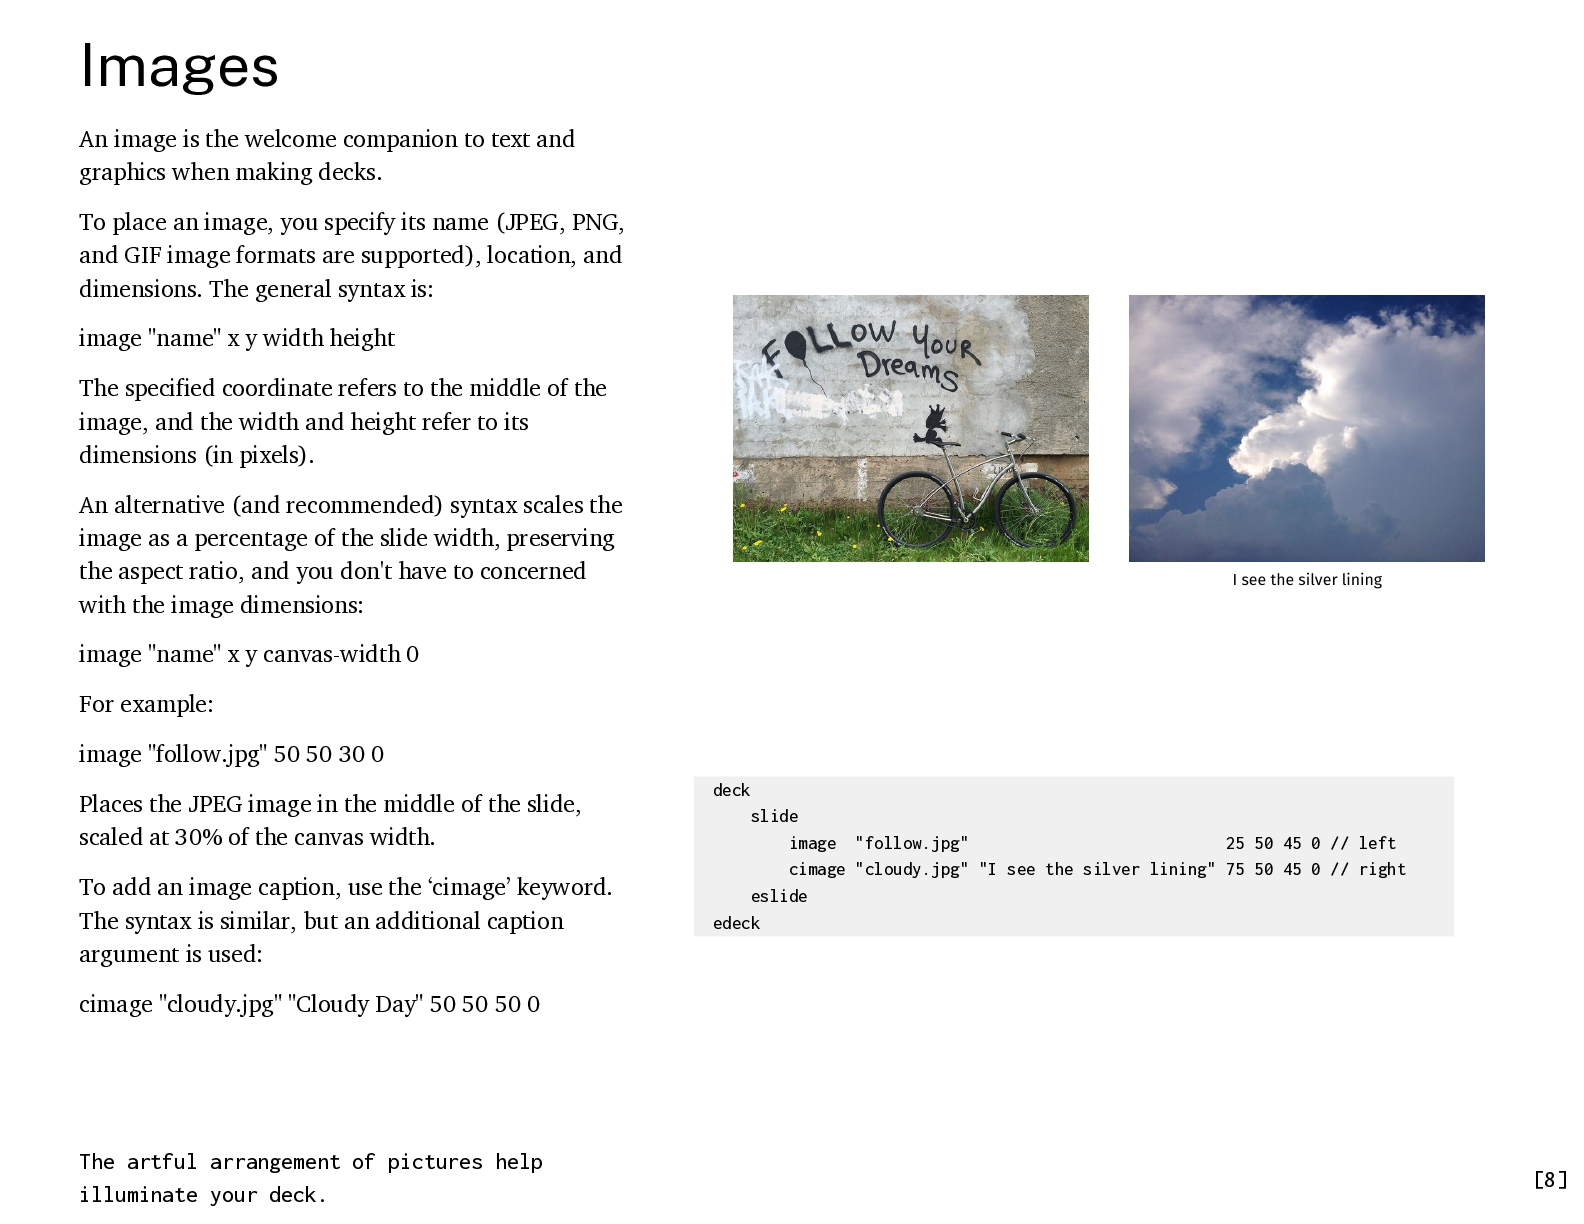
    graphics when making decks. To place an image, you specify its name (JPEG, PNG, and GIF image formats are supported), location, and dimensions. The general syntax is: image "name" x y width height The specified coordinate refers to the middle of the image, and the width and height refer to its dimensions (in pixels). An alternative (and recommended) syntax scales the image as a percentage of the slide width, preserving the aspect ratio, and you don't have to be concerned with the image dimensions: image "name" x y canvas-width 0 For example: image "follow.jpg" 50 50 30 0 Places the JPEG image in the middle of the slide, scaled at 30% of the canvas width. To add an image caption, use the ‘cimage’ keyword. The syntax is similar, but an additional caption argument is used: deck slide image "follow.jpg" 25 50 45 0 // left cimage "cloudy.jpg" "I see the silver lining" 75 50 45 0 // right eslide edeck cimage "cloudy.jpg" "Cloudy Day" 50 50 50 0 The artful arrangement of pictures illuminate your deck. [12]
  13. Loops Loops allow you repeat decksh operations in a controlled

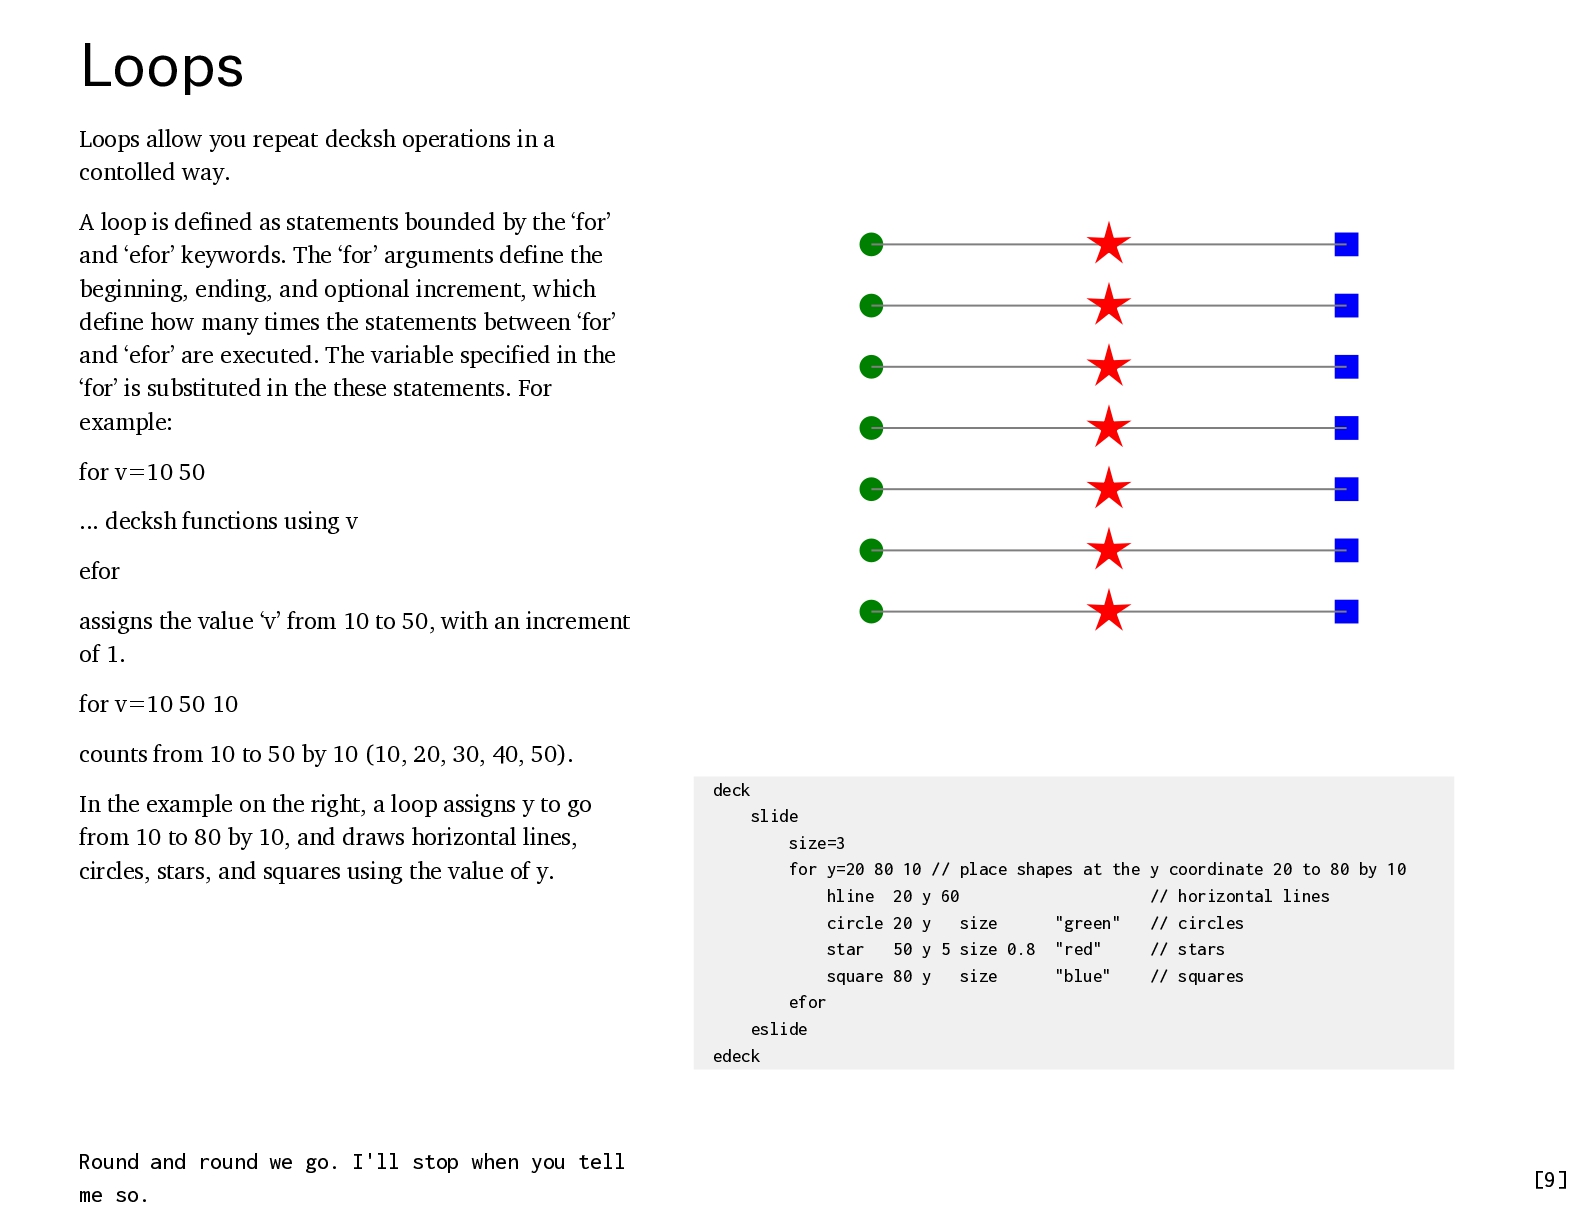
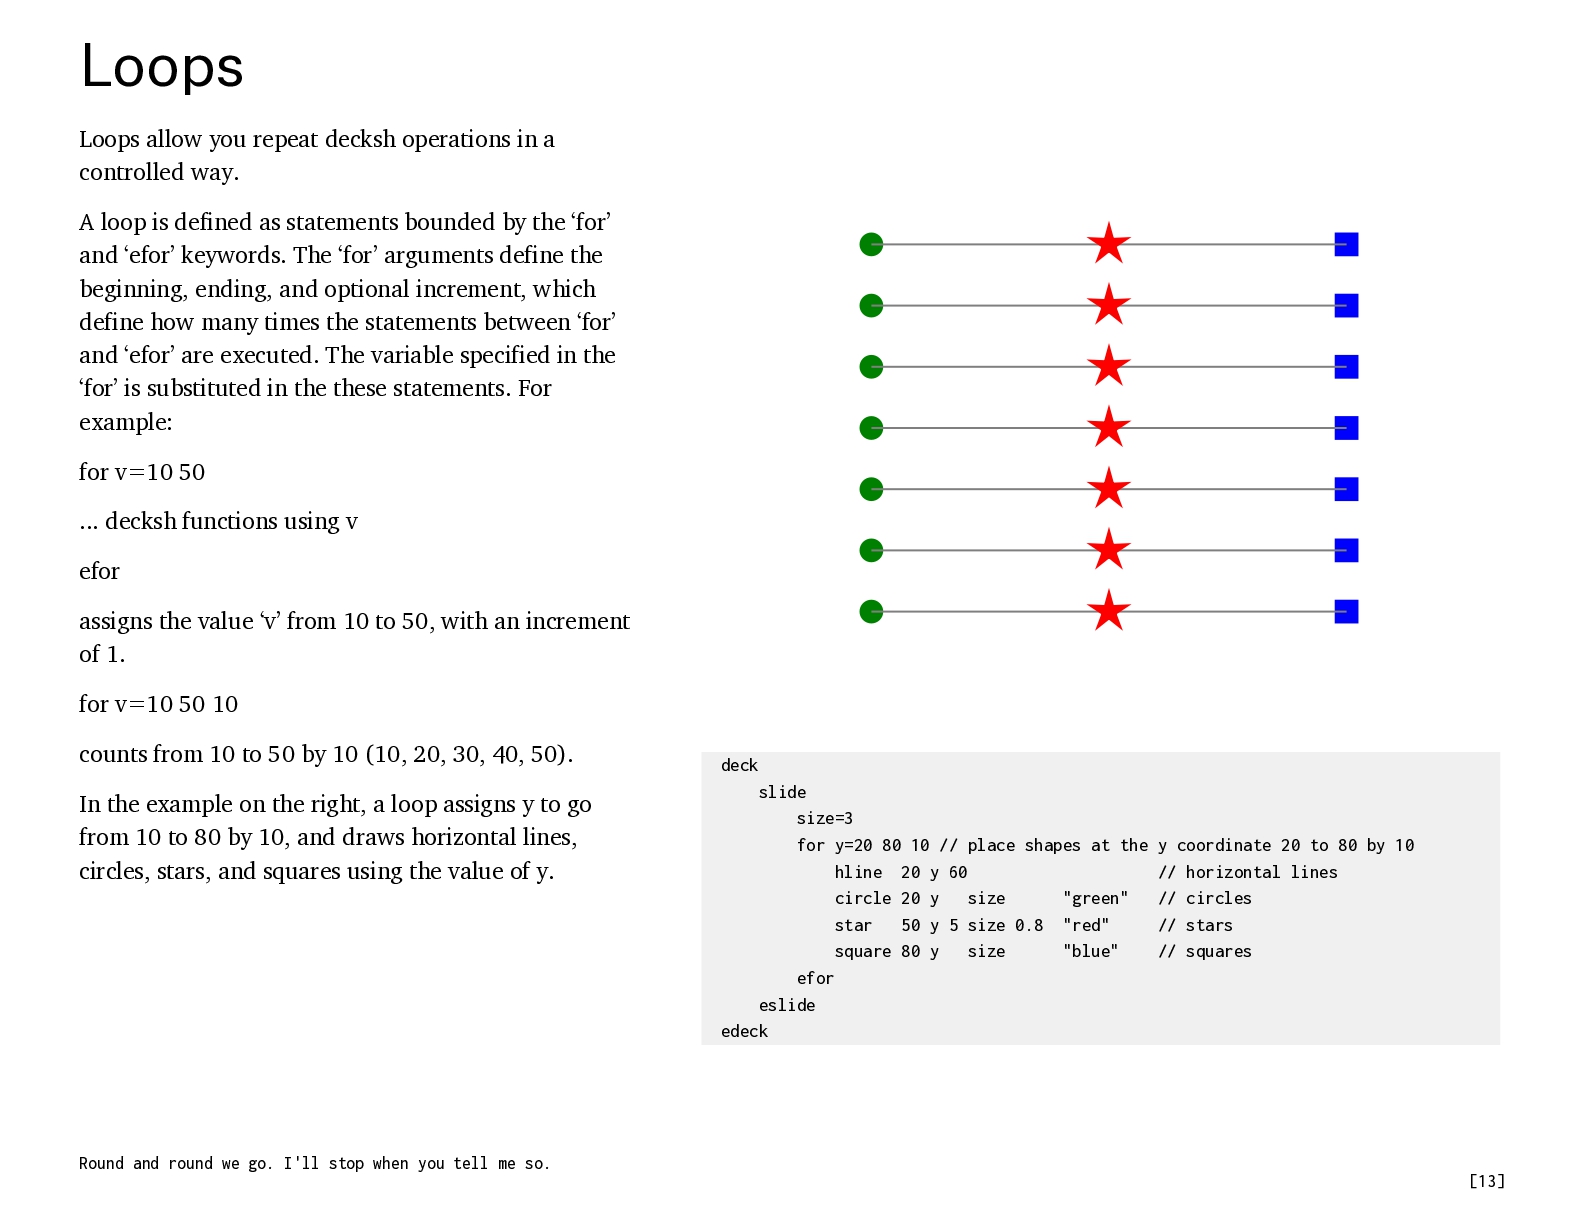
    way. A loop is defined as statements bounded by the ‘for’ and ‘efor’ keywords. The ‘for’ arguments define the beginning, ending, and optional increment, which define how many times the statements between ‘for’ and ‘efor’ are executed. The variable specified in the ‘for’ is substituted in the these statements. For example: for v=10 50 ... decksh functions using v efor assigns the value ‘v’ from 10 to 50, with an increment of 1. for v=10 50 10 counts from 10 to 50 by 10 (10, 20, 30, 40, 50). In the example on the right, a loop assigns y to go from 10 to 80 by 10, and draws horizontal lines, circles, stars, and squares using the value of y. Round and round we go. I'll stop when you tell me so. deck slide size=3 for y=20 80 10 // place shapes at the y coordinate 20 to 80 by 10 hline 20 y 60 // horizontal lines circle 20 y size "green" // circles star 50 y 5 size 0.8 "red" // stars square 80 y size "blue" // squares efor eslide edeck [13]
  14. Lists With decksh you can make many kinds of lists:

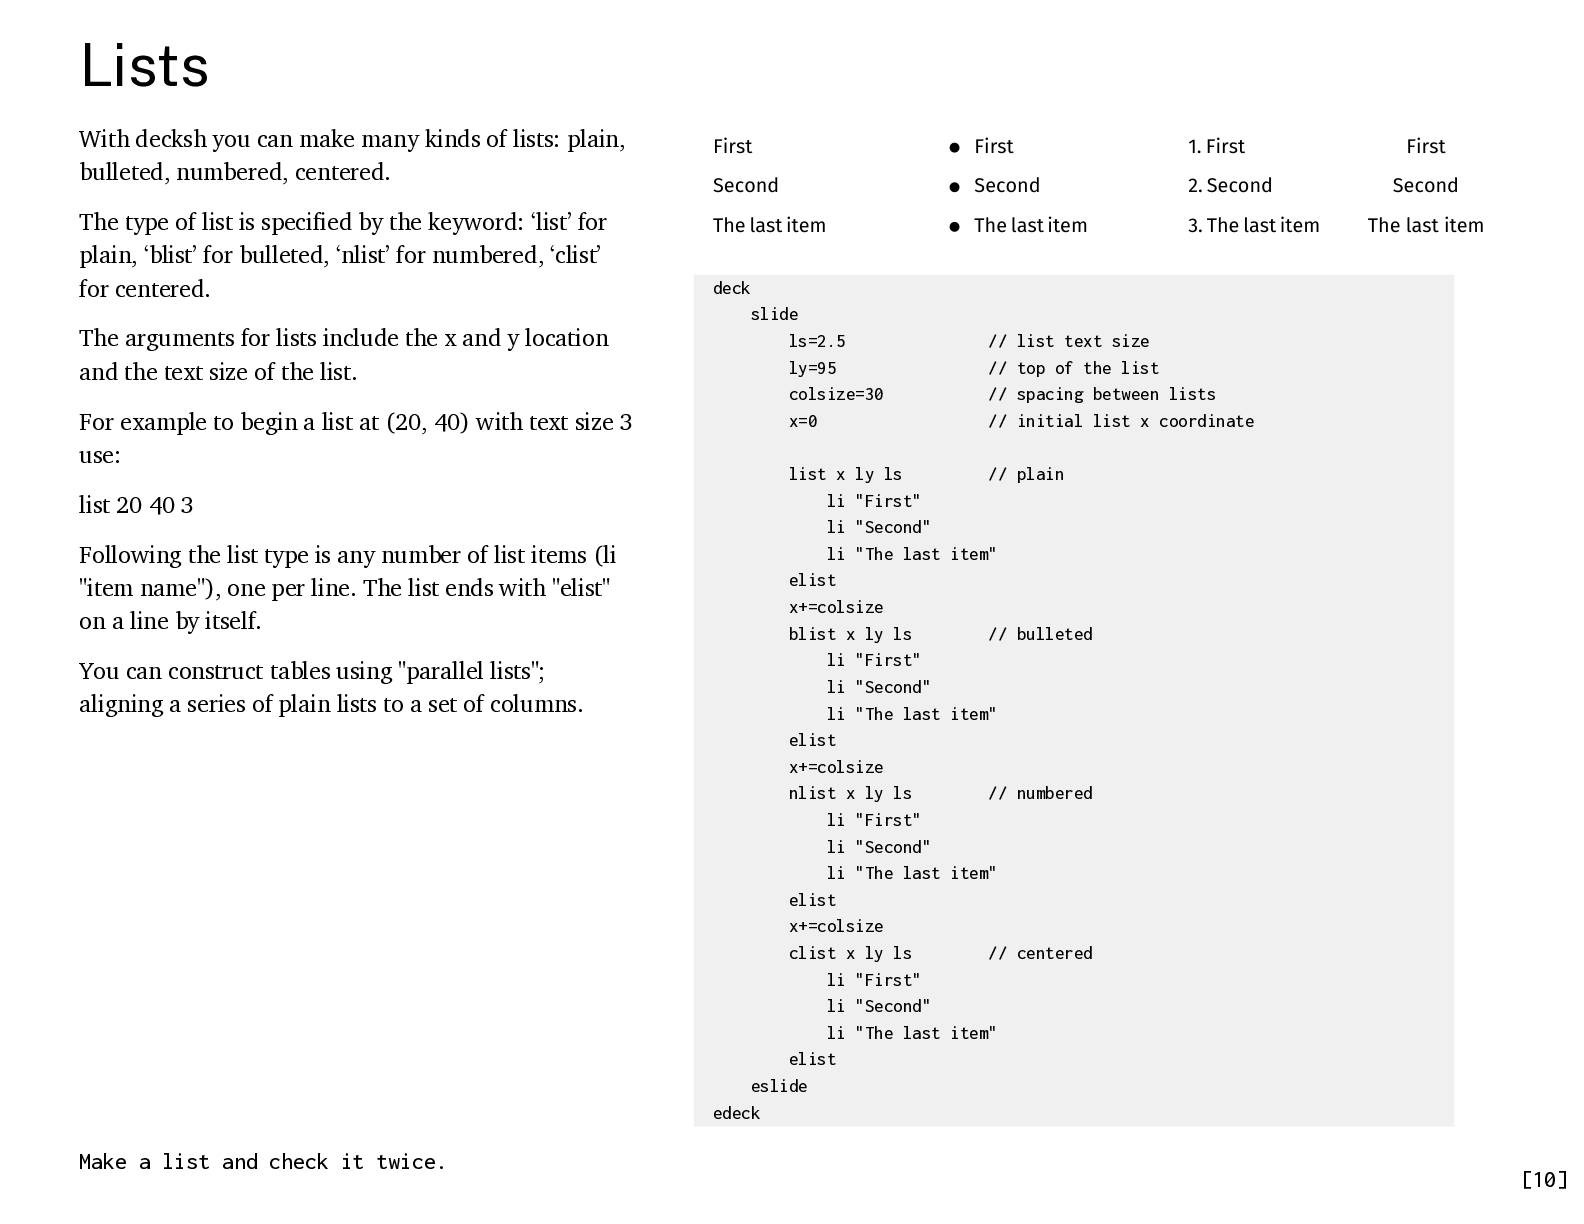
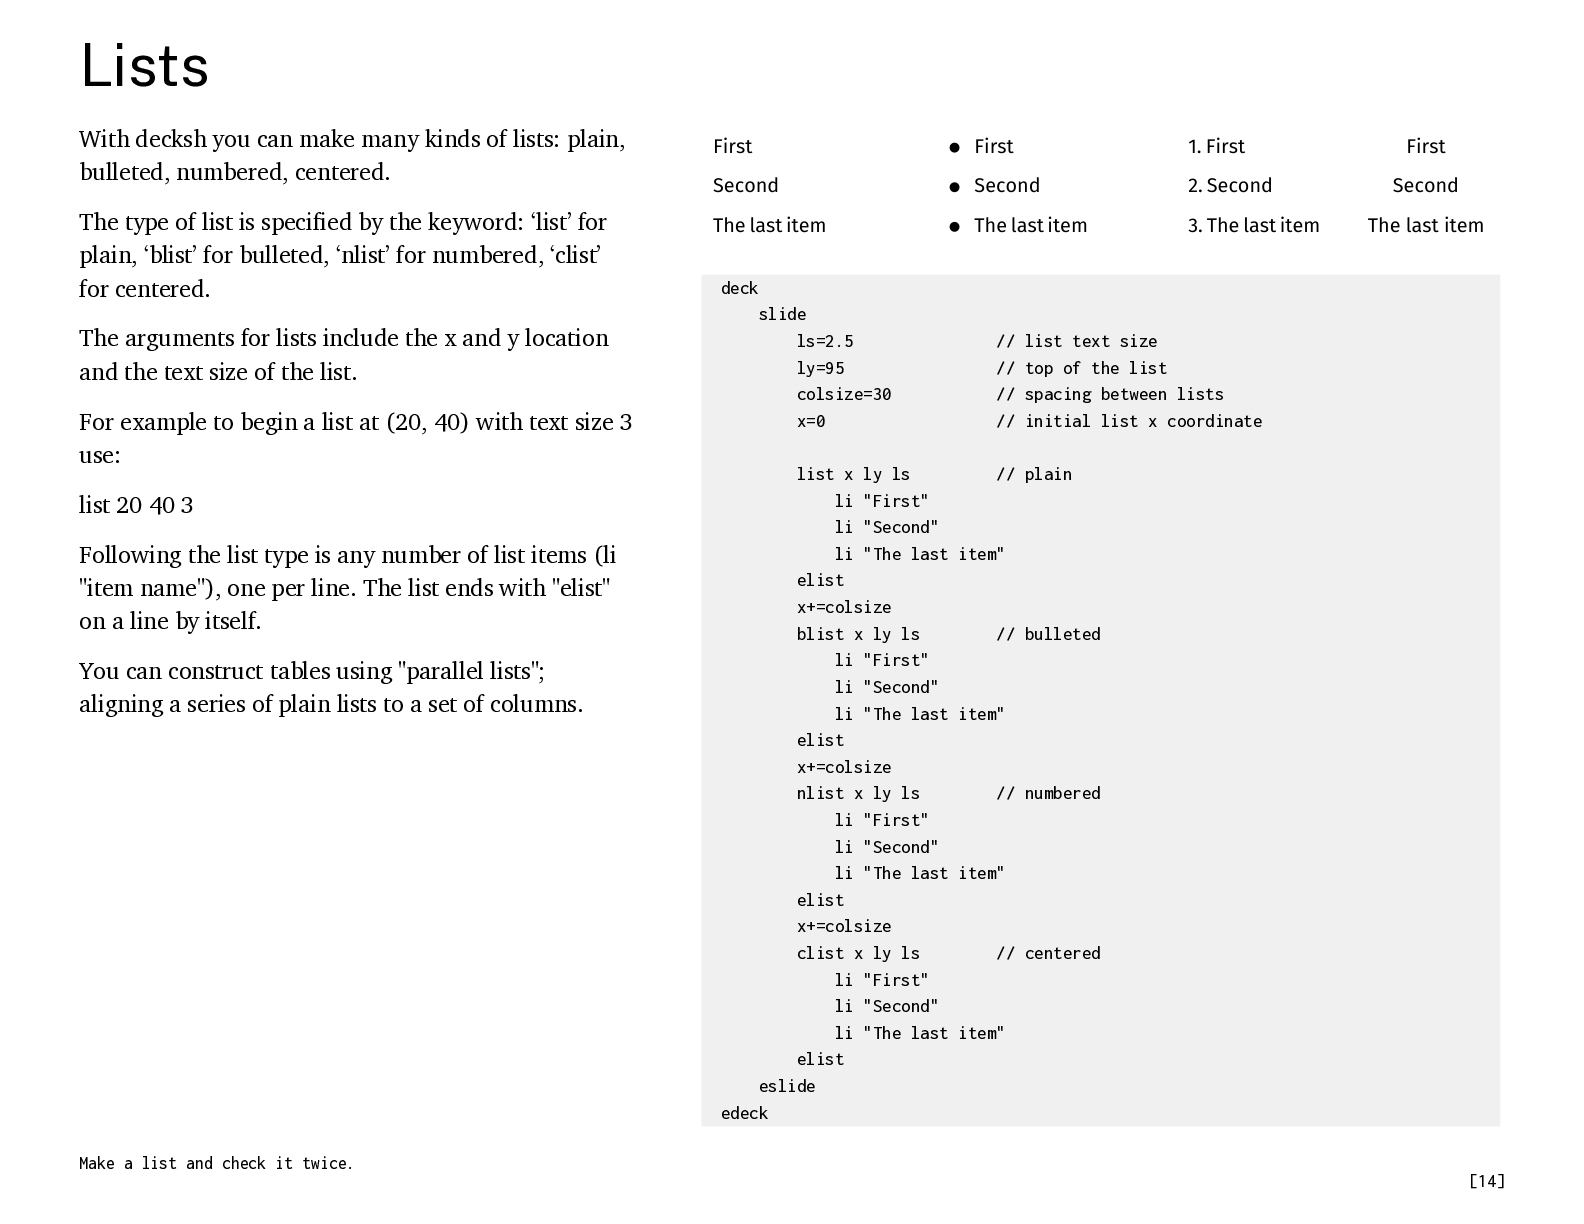
    plain, bulleted, numbered, centered. The type of list is specified by the keyword: ‘list’ for plain, ‘blist’ for bulleted, ‘nlist’ for numbered, ‘clist’ for centered. The arguments for lists include the x and y location and the text size of the list. For example to begin a list at (20, 40) with text size 3 use: list 20 40 3 Following the list type is any number of list items (li "item name"), one per line. The list ends with "elist" on a line by itself. You can construct tables using "parallel lists"; aligning a series of plain lists to a set of columns. Make a list and check it twice. deck slide ls=2.5 ly=95 colsize=30 x=0 // list text size // top of the list // spacing between lists // initial list x coordinate list x ly ls // plain li "First" li "Second" li "The last item" elist x+=colsize blist x ly ls // bulleted li "First" li "Second" li "The last item" elist x+=colsize nlist x ly ls // numbered li "First" li "Second" li "The last item" elist x+=colsize clist x ly ls // centered li "First" li "Second" li "The last item" elist eslide edeck [14]
  15. Charts decksh has built-in support for a variety of chart

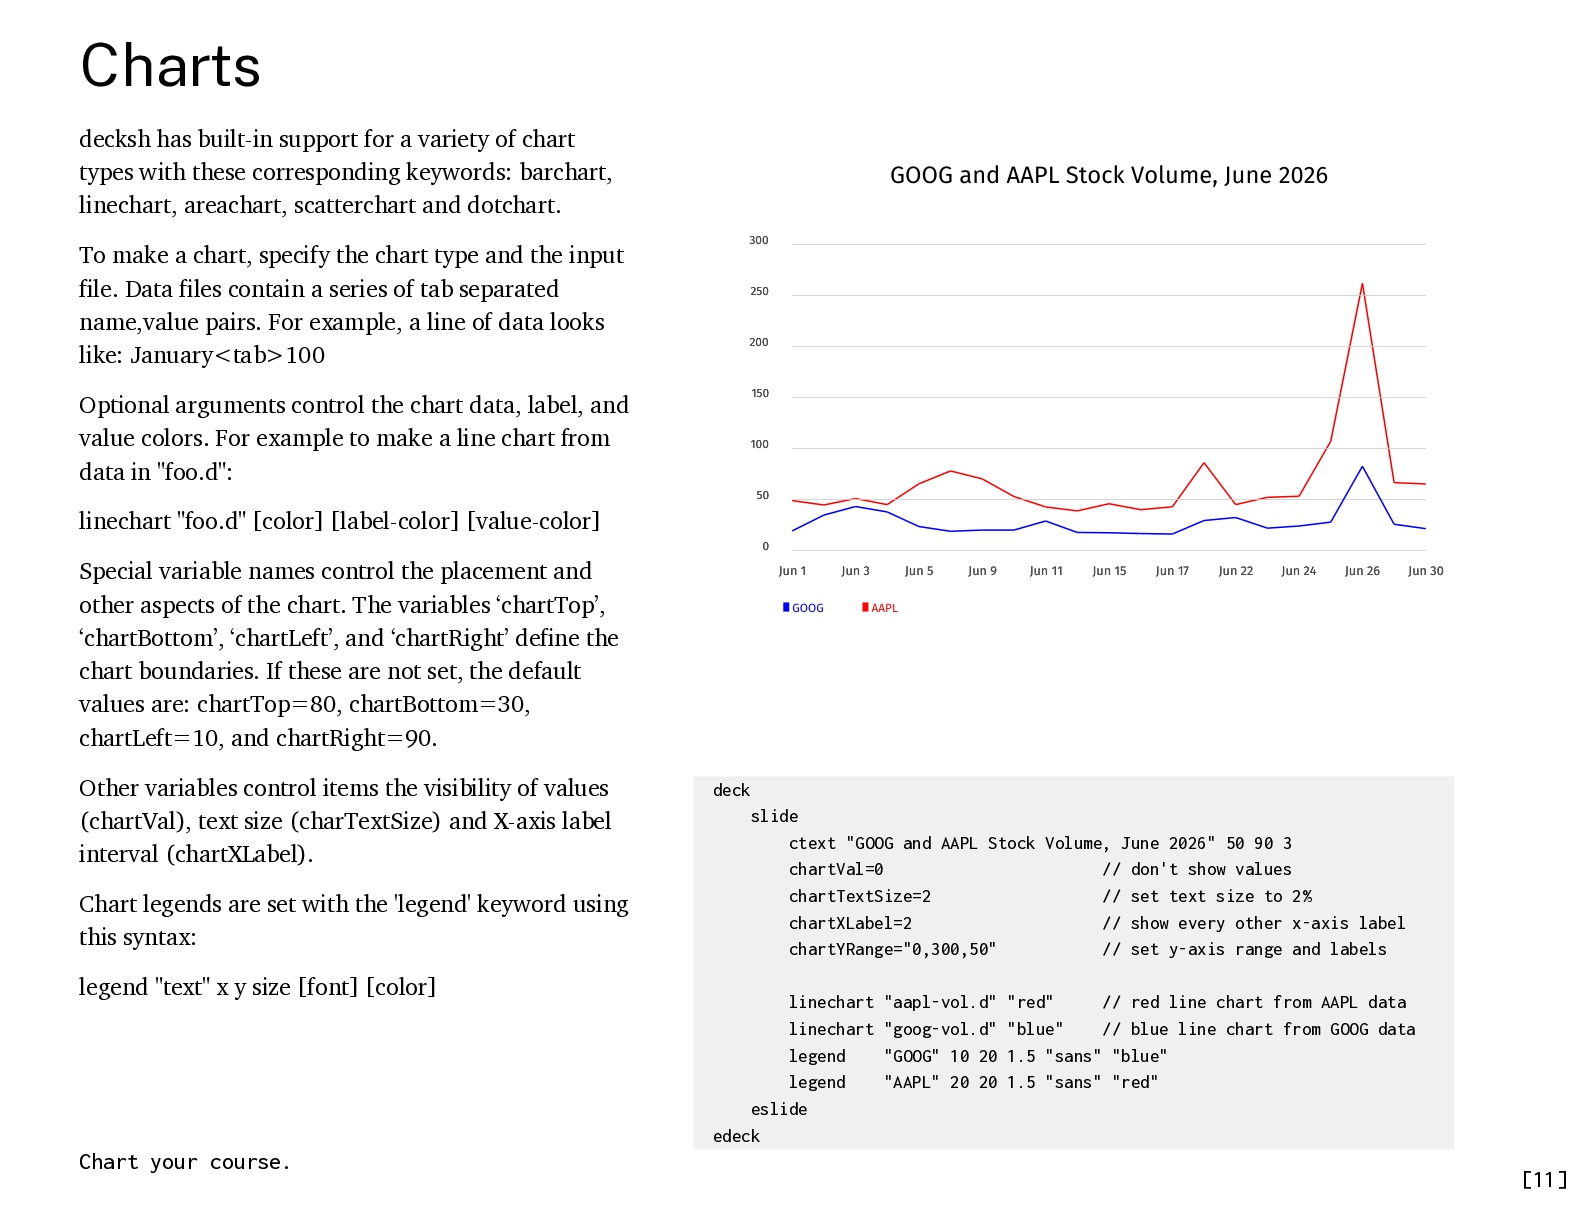
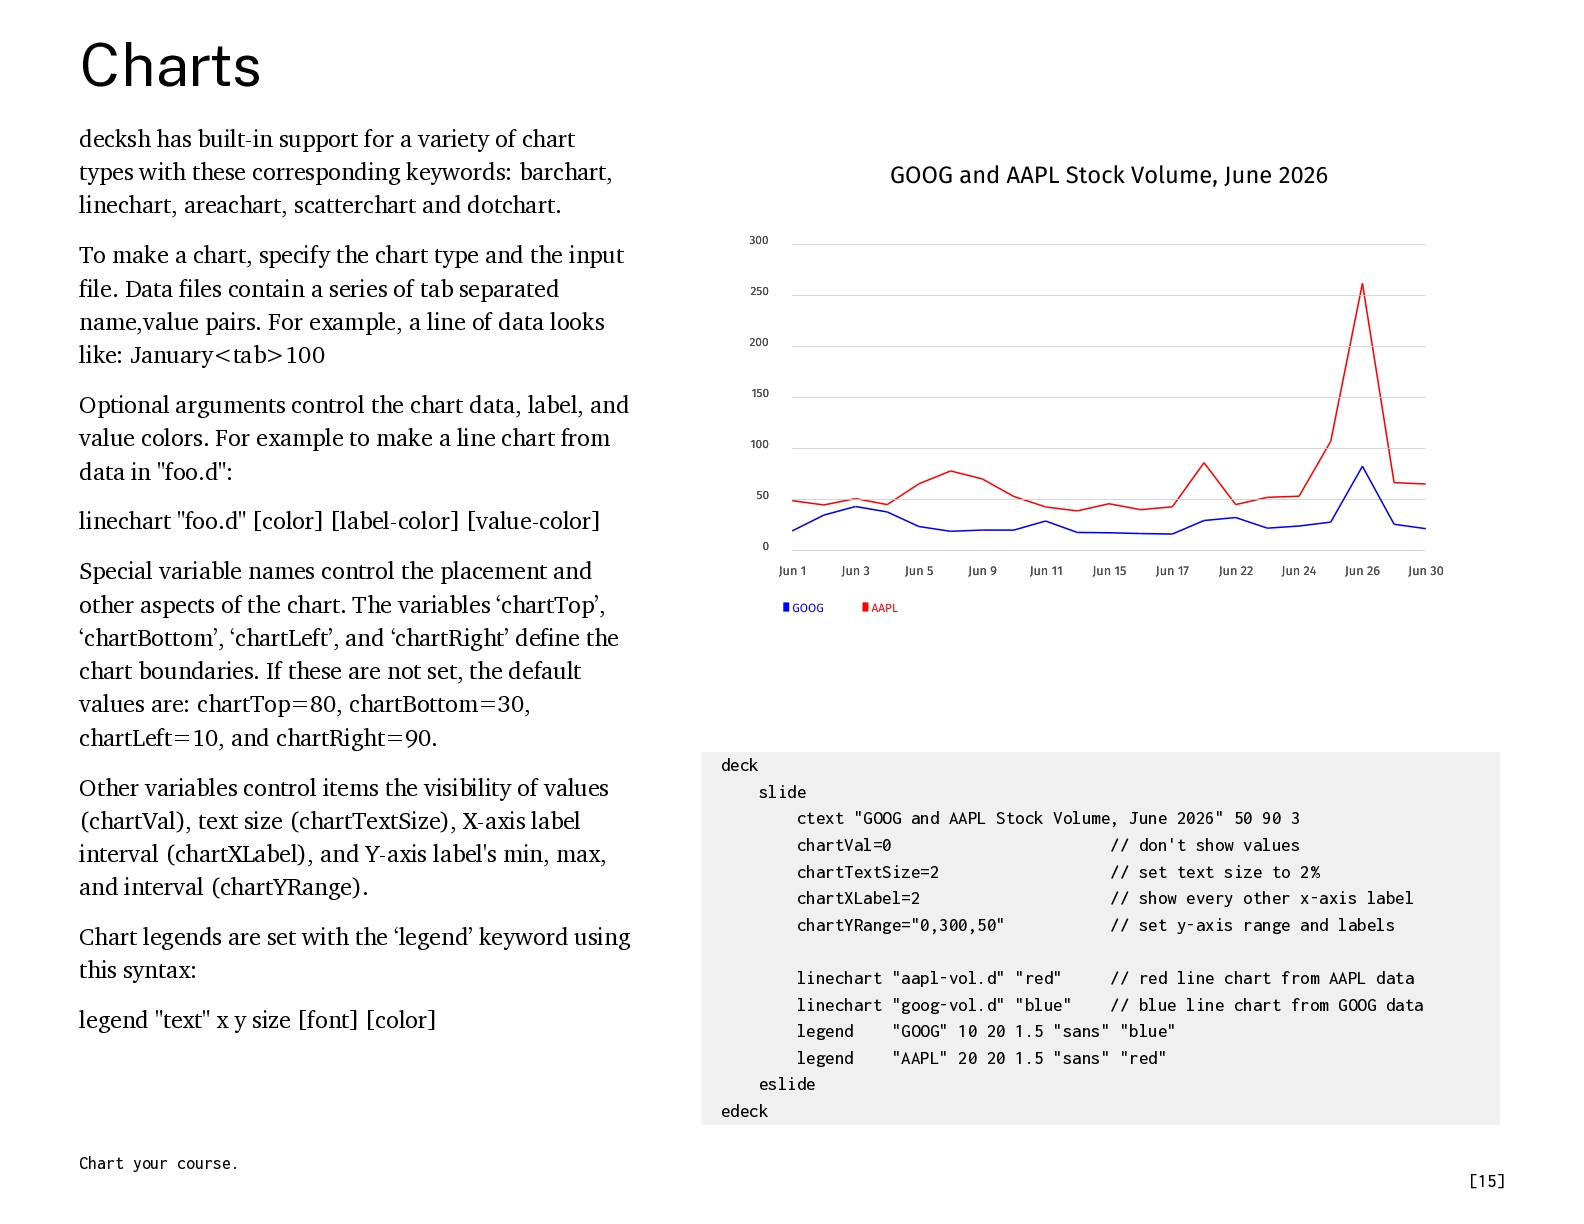
    types with these corresponding keywords: barchart, linechart, areachart, scatterchart and dotchart. To make a chart, specify the chart type and the input file. Data files contain a series of tab separated name,value pairs. For example, a line of data looks like: January<tab>100 Optional arguments control the chart data, label, and value colors. For example to make a line chart from data in "foo.d": linechart "foo.d" [color] [label-color] [value-color] Special variable names control the placement and other aspects of the chart. The variables ‘chartTop’, ‘chartBottom’, ‘chartLeft’, and ‘chartRight’ define the chart boundaries. If these are not set, the default values are: chartTop=80, chartBottom=30, chartLeft=10, and chartRight=90. Other variables control items the visibility of values (chartVal), text size (chartTextSize), X-axis label interval (chartXLabel), and Y-axis label's min, max, and interval (chartYRange). Chart legends are set with the ‘legend’ keyword using this syntax: legend "text" x y size [font] [color] Chart your course. deck slide ctext "GOOG and AAPL Stock Volume, June 2026" 50 90 3 chartVal=0 // don't show values chartTextSize=2 // set text size to 2% chartXLabel=2 // show every other x-axis label chartYRange="0,300,50" // set y-axis range and labels linechart "aapl-vol.d" "red" // red line chart from AAPL data linechart "goog-vol.d" "blue" // blue line chart from GOOG data legend "GOOG" 10 20 1.5 "sans" "blue" legend "AAPL" 20 20 1.5 "sans" "red" eslide edeck [15]
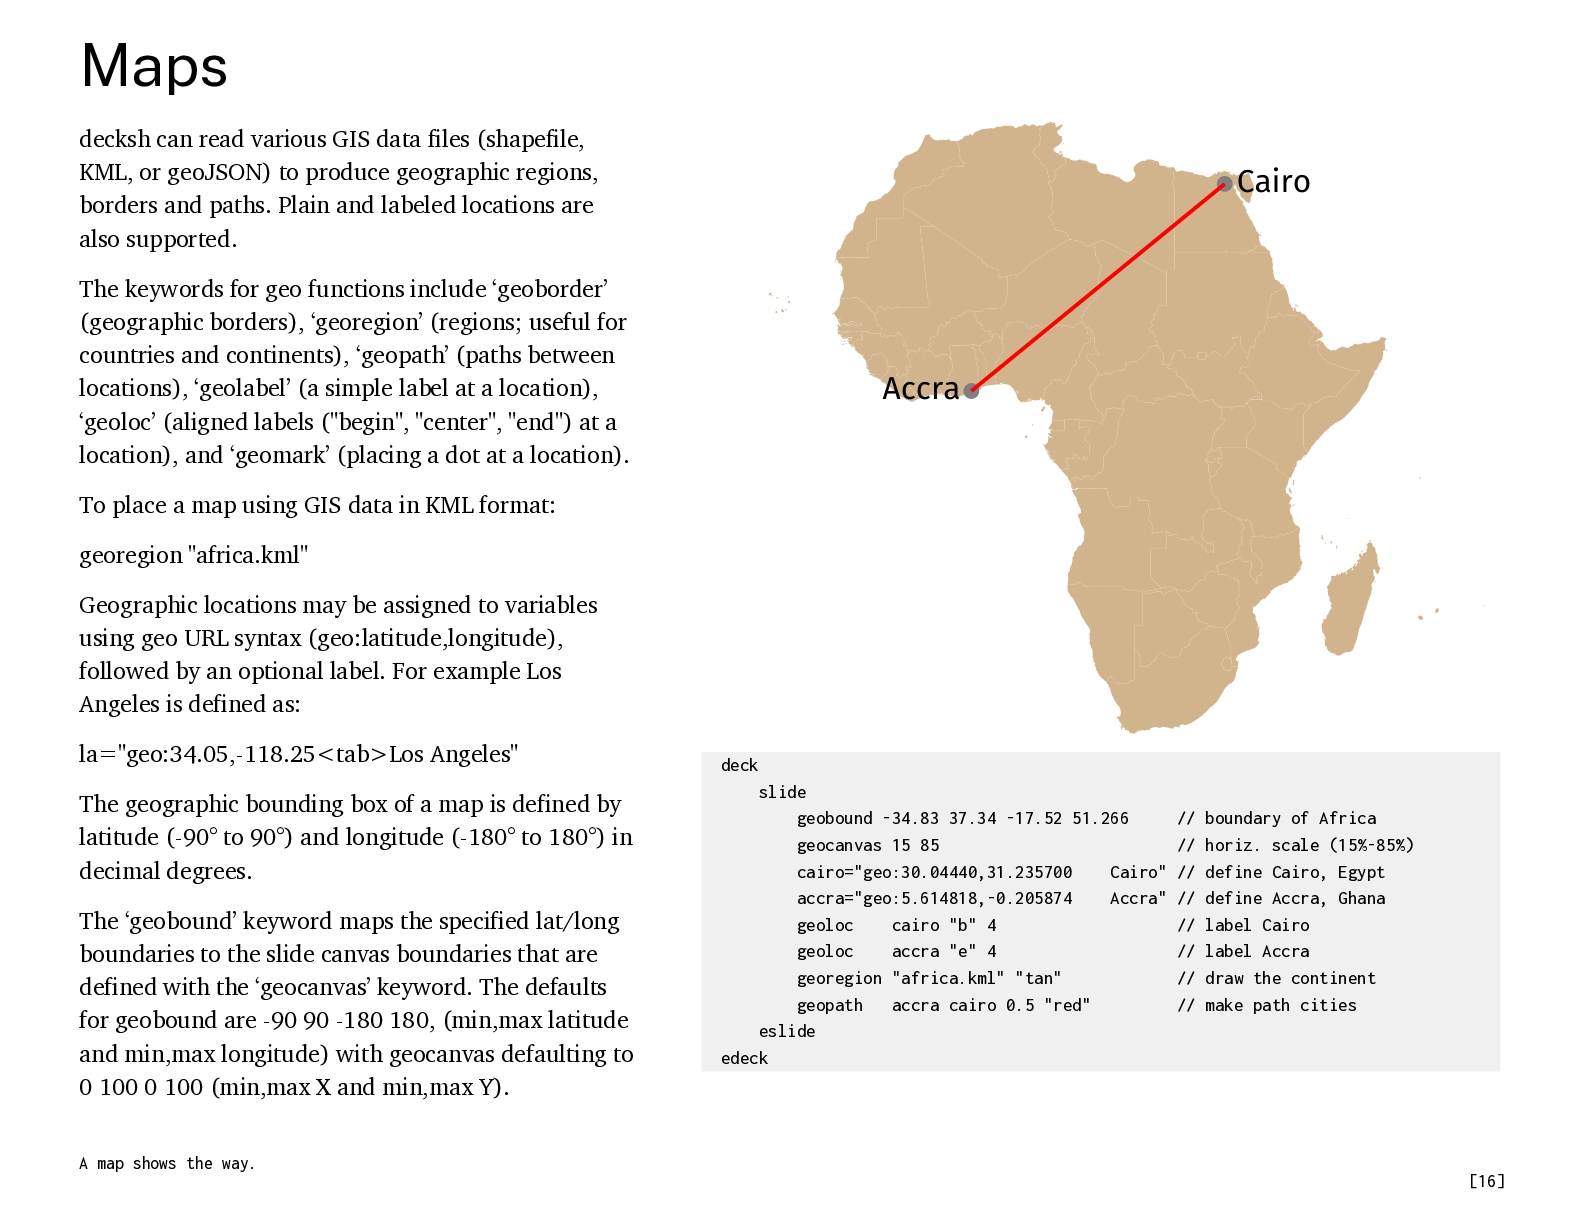
  16. Maps decksh can read various GIS data files (shapefile, KML,

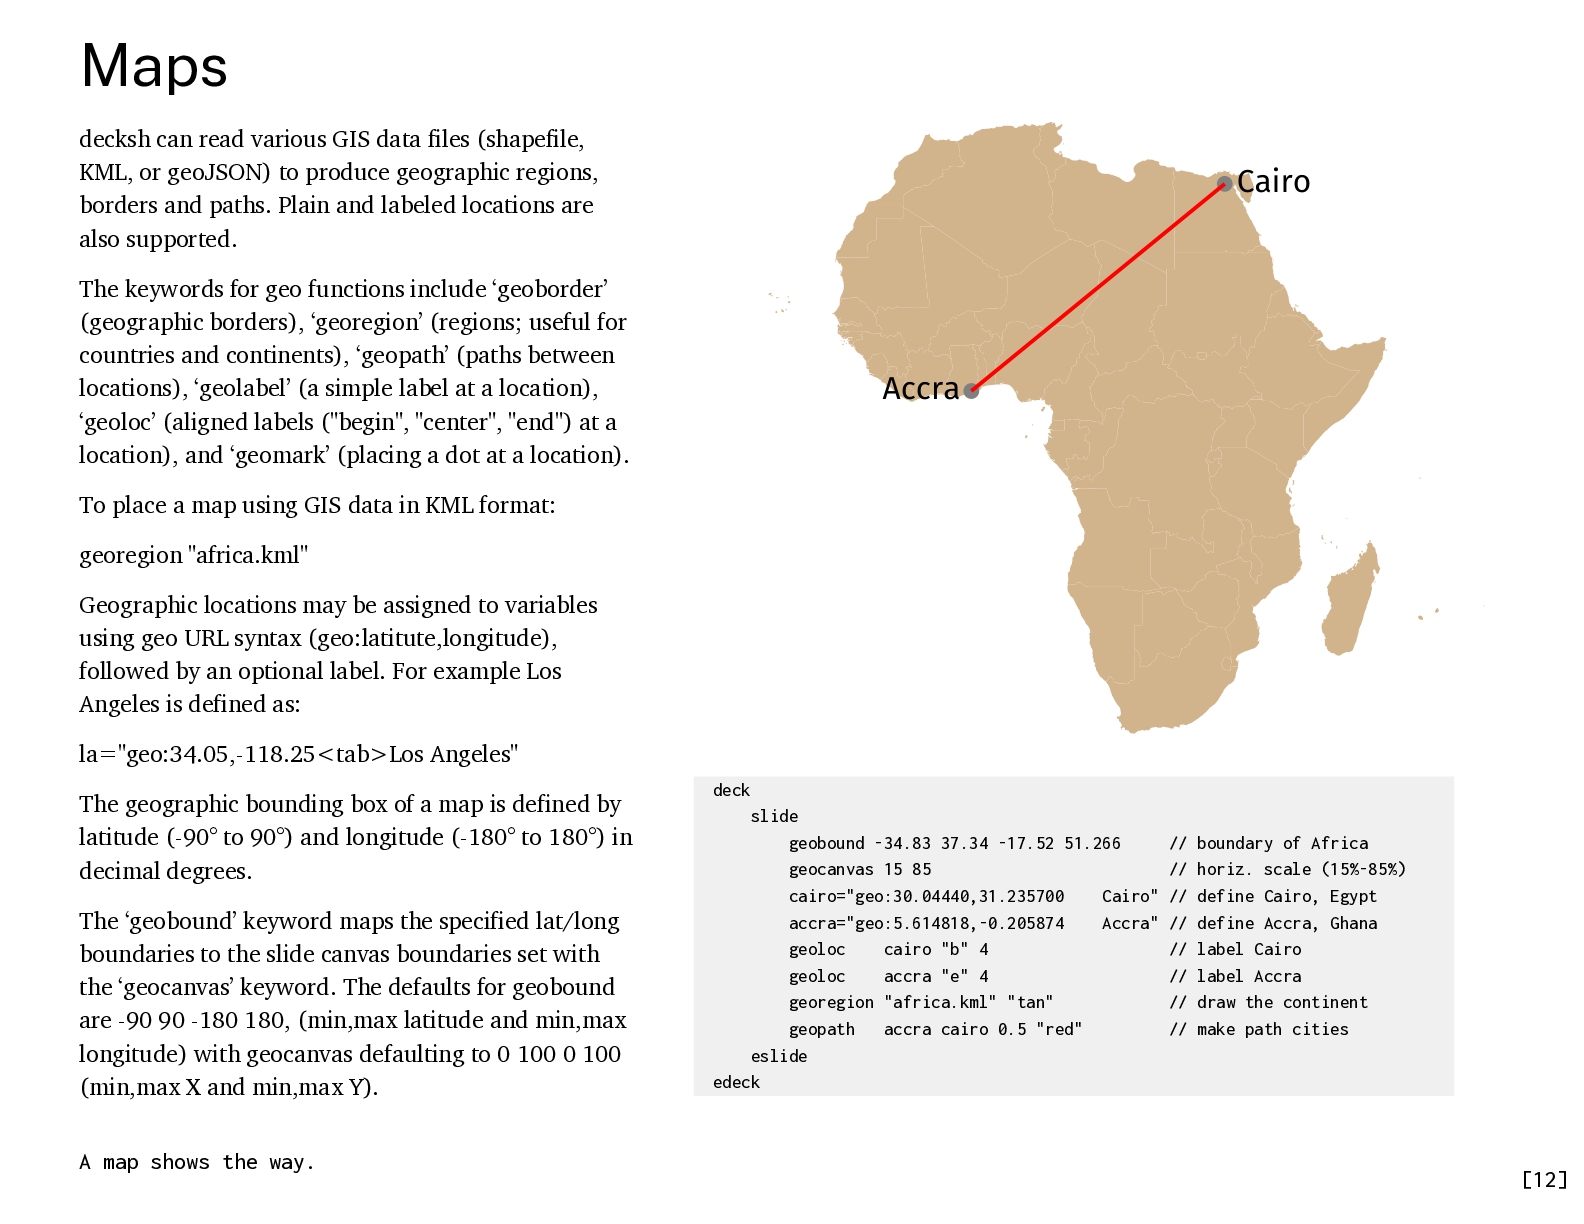
    or geoJSON) to produce geographic regions, borders and paths. Plain and labeled locations are also supported. The keywords for geo functions include ‘geoborder’ (geographic borders), ‘georegion’ (regions; useful for countries and continents), ‘geopath’ (paths between locations), ‘geolabel’ (a simple label at a location), ‘geoloc’ (aligned labels ("begin", "center", "end") at a location), and ‘geomark’ (placing a dot at a location). To place a map using GIS data in KML format: georegion "africa.kml" Geographic locations may be assigned to variables using geo URL syntax (geo:latitude,longitude), followed by an optional label. For example Los Angeles is defined as: la="geo:34.05,-118.25<tab>Los Angeles" The geographic bounding box of a map is defined by latitude (-90° to 90°) and longitude (-180° to 180°) in decimal degrees. The ‘geobound’ keyword maps the specified lat/long boundaries to the slide canvas boundaries that are defined with the ‘geocanvas’ keyword. The defaults for geobound are -90 90 -180 180, (min,max latitude and min,max longitude) with geocanvas defaulting to 0 100 0 100 (min,max X and min,max Y). A map shows the way. deck slide geobound -34.83 37.34 -17.52 51.266 // boundary of Africa geocanvas 15 85 // horiz. scale (15%-85%) cairo="geo:30.04440,31.235700 Cairo" // define Cairo, Egypt accra="geo:5.614818,-0.205874 Accra" // define Accra, Ghana geoloc cairo "b" 4 // label Cairo geoloc accra "e" 4 // label Accra georegion "africa.kml" "tan" // draw the continent geopath accra cairo 0.5 "red" // make path cities eslide edeck [16]
  17. Designing with regions When designing your slides, it's useful to

    think in terms of logical regions for your content: A place for titles, text and illustrations for example. Using decksh variables, you can enforce consistency across slides and a single change will enforce the design throughout the deck. For example, define the locations of the title (blue), explanatory text (green), and image (orange). Next use the variables you defined in the initial and subsequent slides. deck Using regions ties the deck together. tx=20 // title x coordinate ty=90 // title y coordinate ts=3 // title size imx=70 // image x coordinate imy=60 // image y coordinate ims=50 // image size ex=5 // text x coordinate ey=80 // text y coordinate ew=30 // text width es=ts*.75 // text size slide p="New research has shed light on the question of a cat's color ..." ctext "Why is my cat orange?" tx ty ts textblock p ex ey ew es "serif" image "cat.png" imx imy ims 0 eslide slide ctext "My new cat" tx ty ts textblock "more stuff..." ex ey ew es "serif" image "newcat.png" imx imy ims 0 eslide edeck [17]
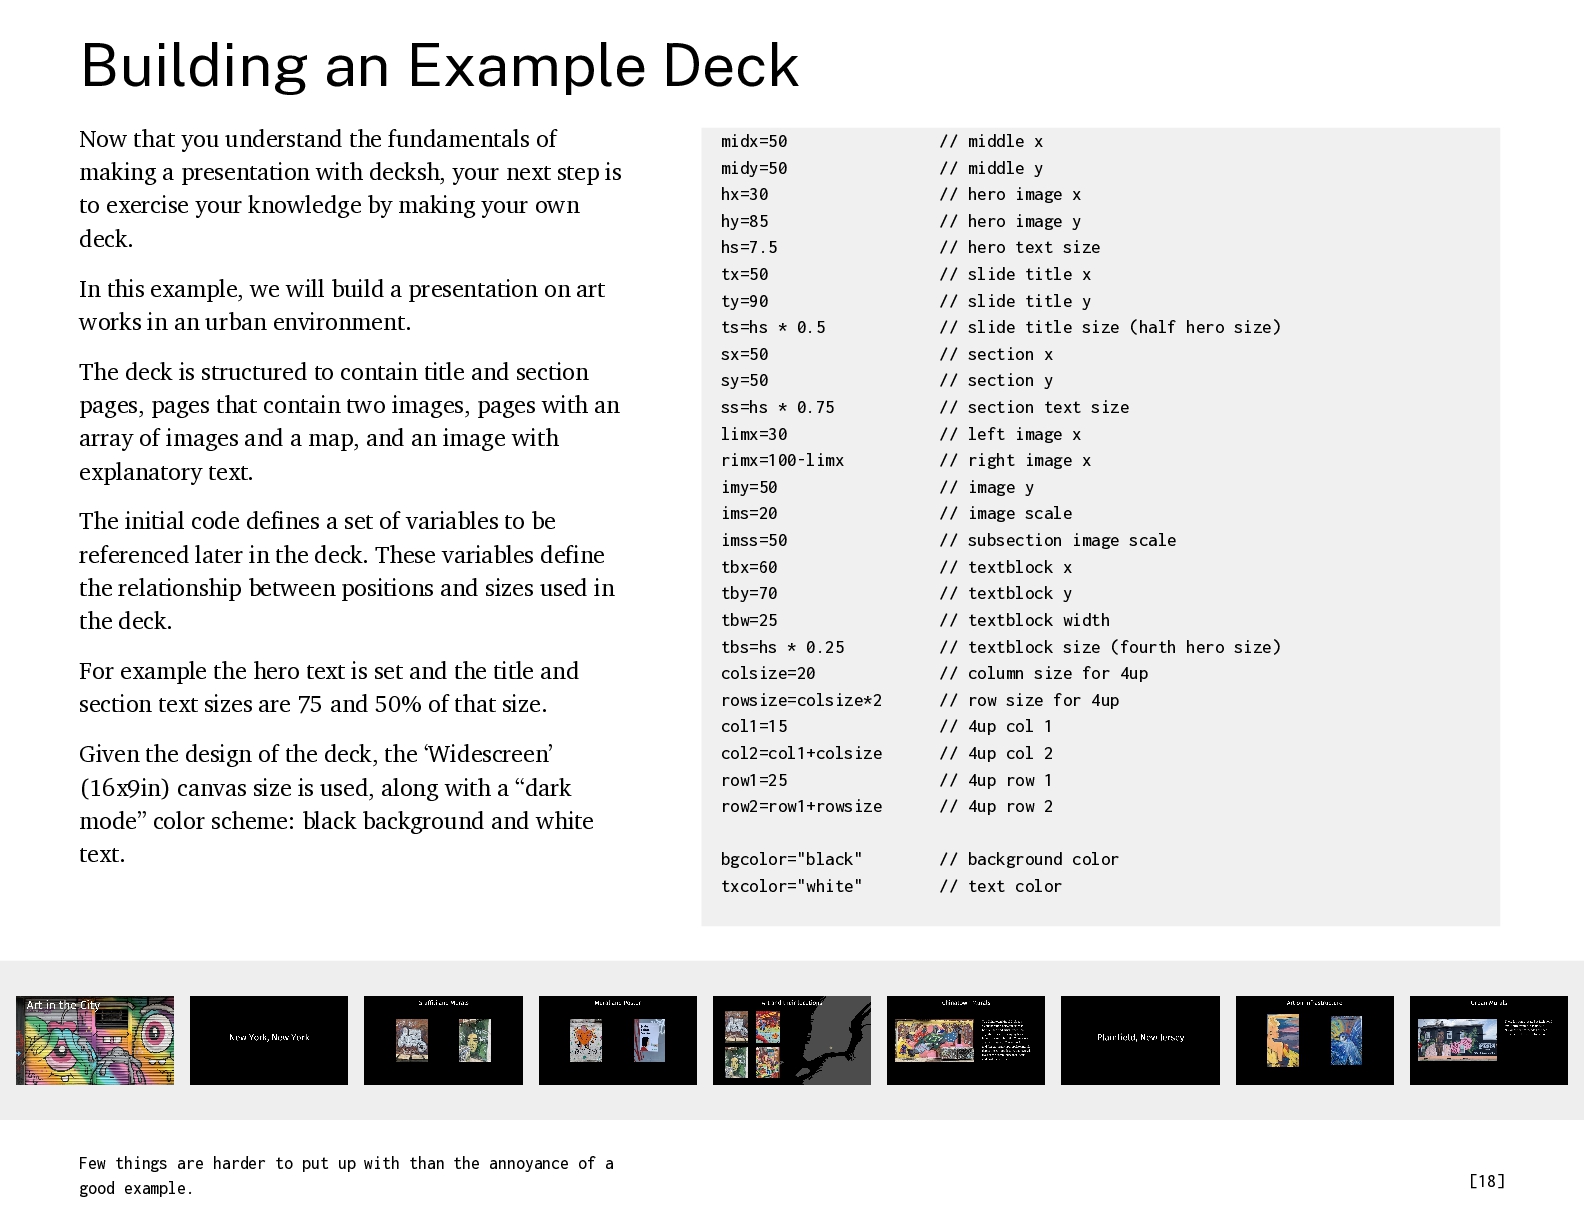
  18. Building an Example Deck Now that you understand the fundamentals

    of making a presentation with decksh, your next step is to exercise your knowledge by making your own deck. In this example, we will build a presentation on art works in an urban environment. The deck is structured to contain title and section pages, pages that contain two images, pages with an array of images and a map, and an image with explanatory text. The initial code defines a set of variables to be referenced later in the deck. These variables define the relationship between positions and sizes used in the deck. For example the hero text is set and the title and section text sizes are 75 and 50% of that size. Given the design of the deck, the ‘Widescreen’ (16x9in) canvas size is used, along with a “dark mode” color scheme: black background and white text. Few things are harder to put up with than the annoyance of a good example. midx=50 midy=50 hx=30 hy=85 hs=7.5 tx=50 ty=90 ts=hs * 0.5 sx=50 sy=50 ss=hs * 0.75 limx=30 rimx=100-limx imy=50 ims=20 imss=50 tbx=60 tby=70 tbw=25 tbs=hs * 0.25 colsize=20 rowsize=colsize*2 col1=15 col2=col1+colsize row1=25 row2=row1+rowsize // middle x // middle y // hero image x // hero image y // hero text size // slide title x // slide title y // slide title size (half hero size) // section x // section y // section text size // left image x // right image x // image y // image scale // subsection image scale // textblock x // textblock y // textblock width // textblock size (fourth hero size) // column size for 4up // row size for 4up // 4up col 1 // 4up col 2 // 4up row 1 // 4up row 2 bgcolor="black" txcolor="white" // background color // text color [18]
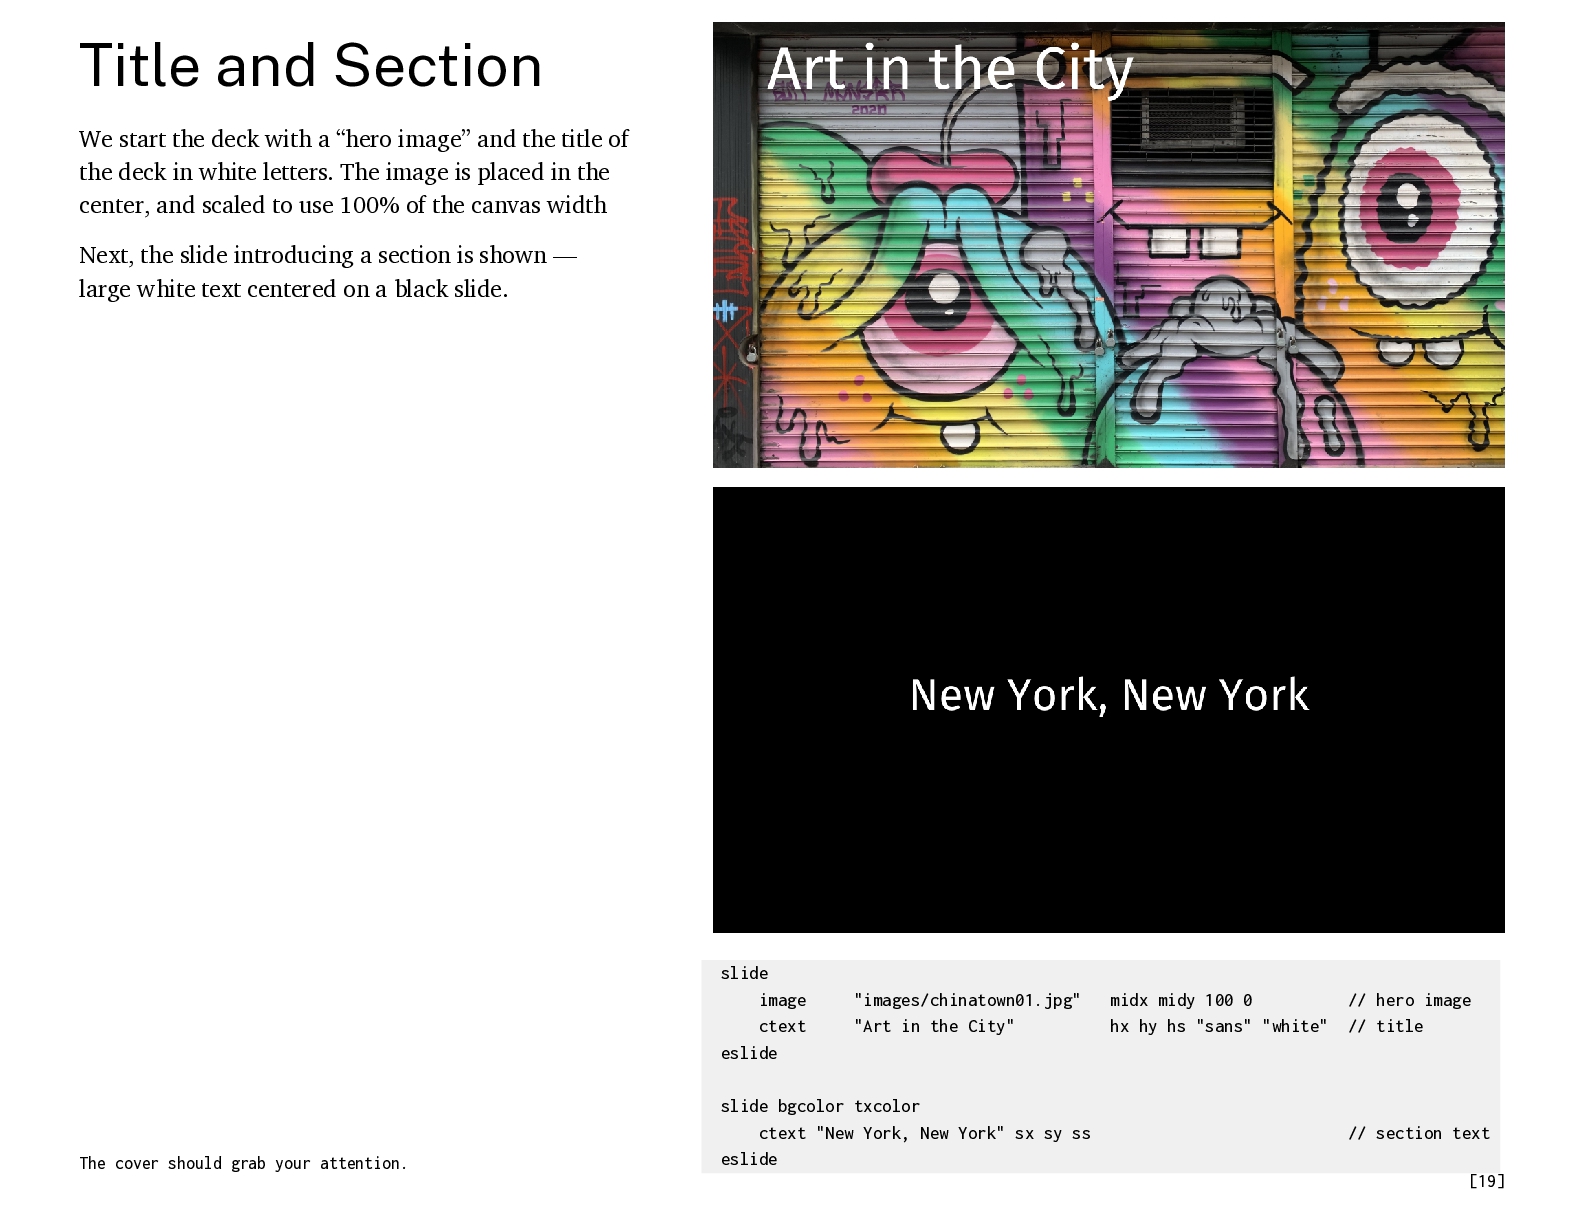
  19. Title and Section We start the deck with a “hero

    image” and the title of the deck in white letters. The image is placed in the center, and scaled to use 100% of the canvas width Next, the slide introducing a section is shown — large white text centered on a black slide. slide image ctext eslide The cover should grab your attention. "images/chinatown01.jpg" "Art in the City" slide bgcolor txcolor ctext "New York, New York" sx sy ss eslide midx midy 100 0 hx hy hs "sans" "white" // hero image // title // section text [19]
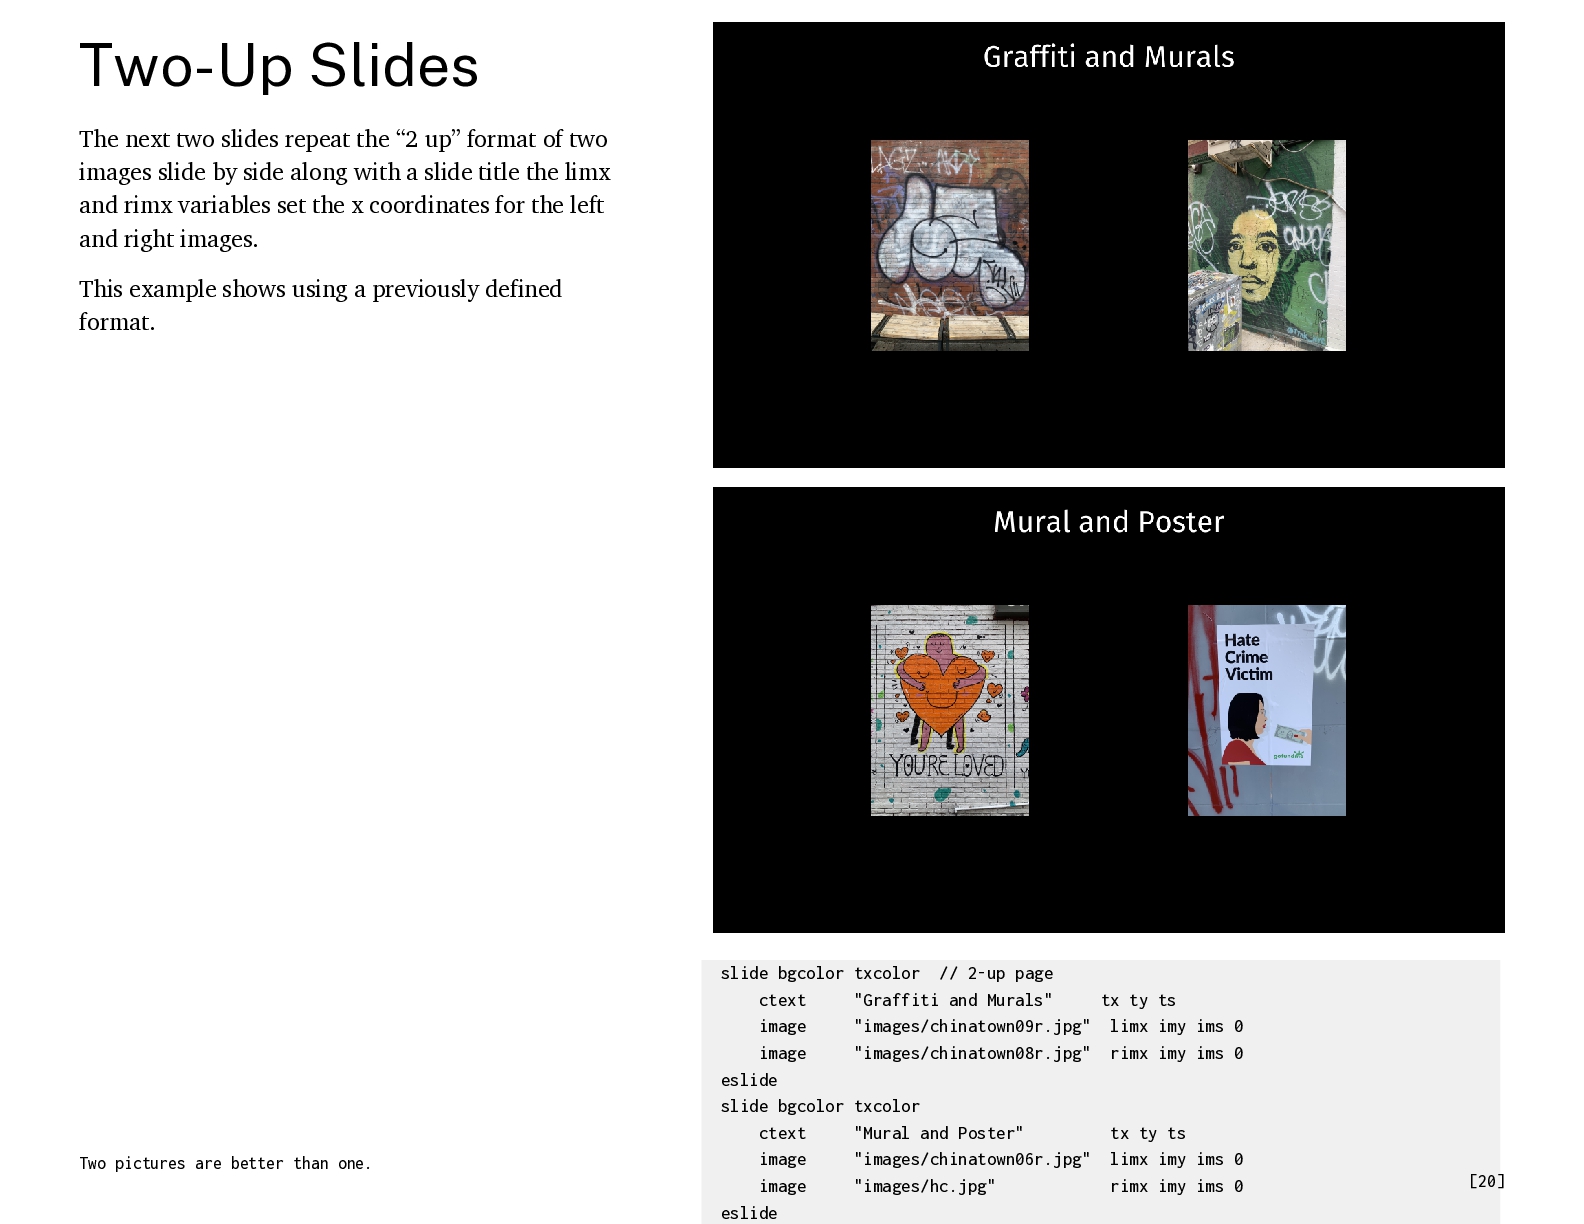
  20. Two-Up Slides The next two slides repeat the “2 up”

    format of two images slide by side along with a slide title the limx and rimx variables set the x coordinates for the left and right images. This example shows using a previously defined format. Two pictures are better than one. slide bgcolor txcolor // 2-up page ctext "Graffiti and Murals" tx ty ts image "images/chinatown09r.jpg" limx imy ims 0 image "images/chinatown08r.jpg" rimx imy ims 0 eslide slide bgcolor txcolor ctext "Mural and Poster" tx ty ts image "images/chinatown06r.jpg" limx imy ims 0 image "images/hc.jpg" rimx imy ims 0 eslide [20]
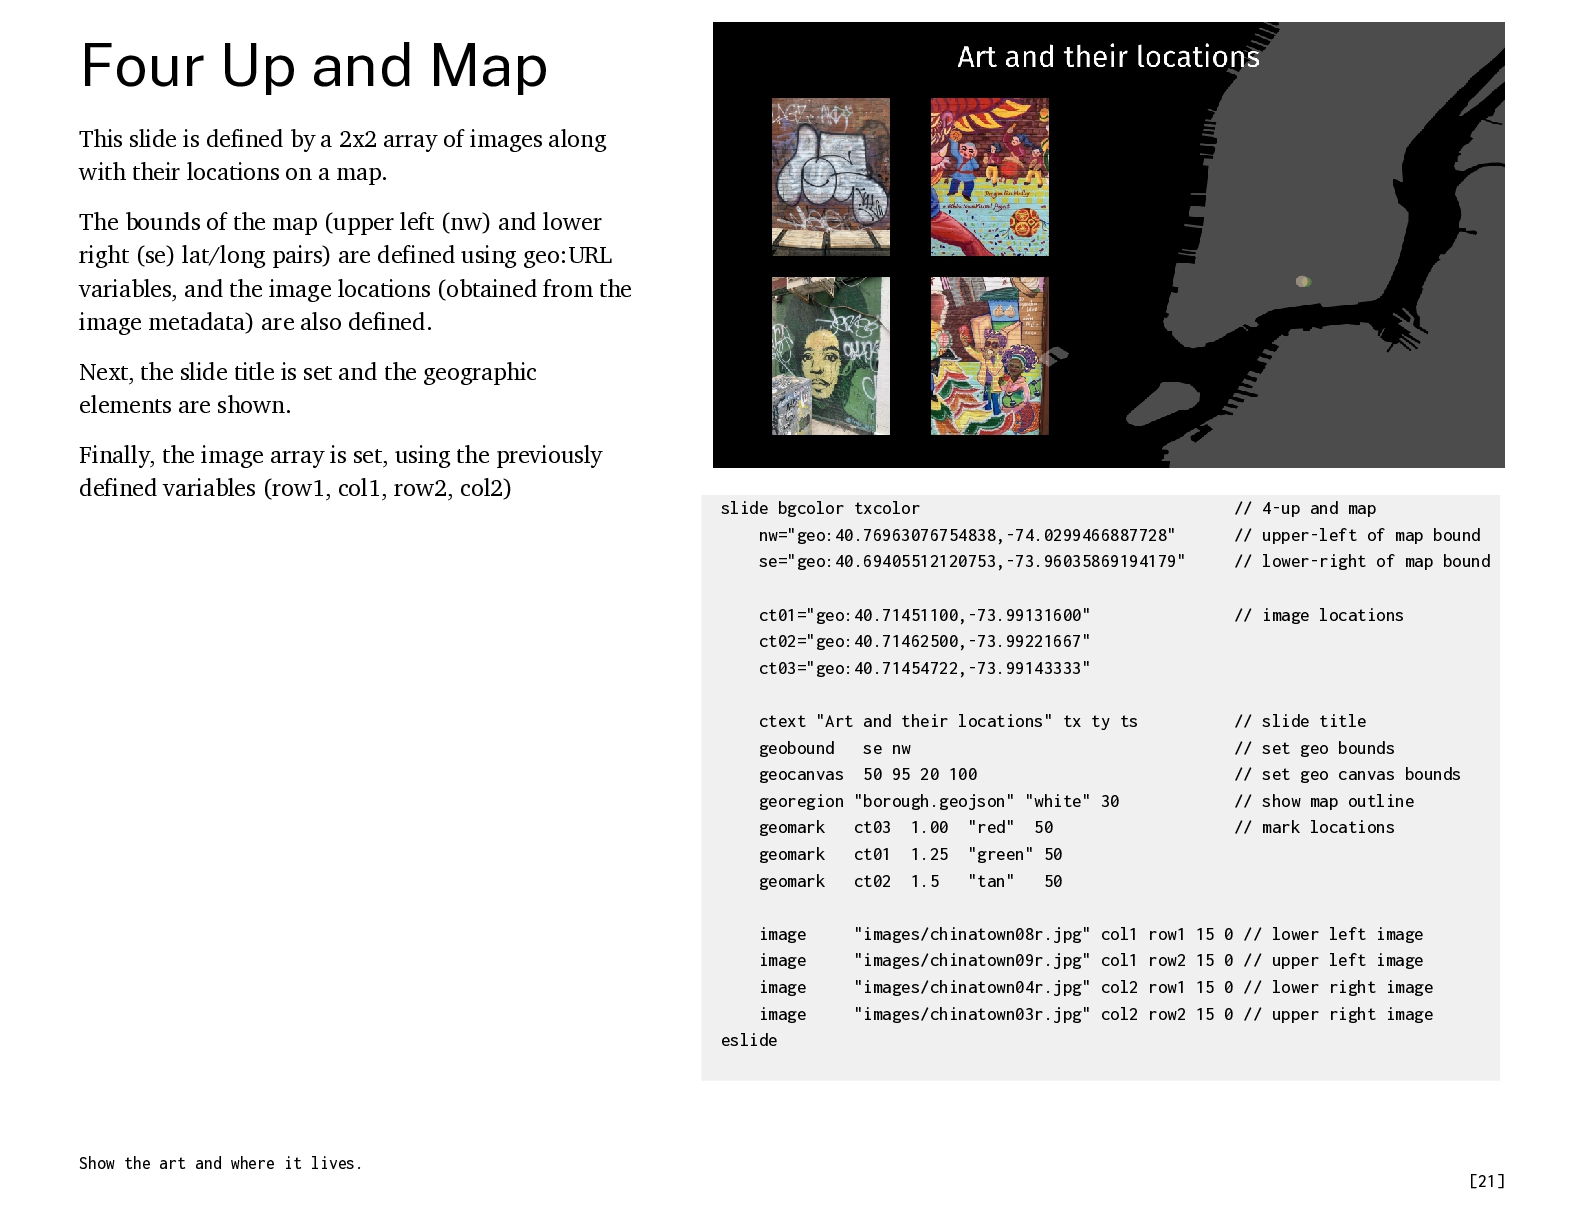
  21. Four Up and Map This slide is defined by a

    2x2 array of images along with their locations on a map. The bounds of the map (upper left (nw) and lower right (se) lat/long pairs) are defined using geo:URL variables, and the image locations (obtained from the image metadata) are also defined. Next, the slide title is set and the geographic elements are shown. Finally, the image array is set, using the previously defined variables (row1, col1, row2, col2) slide bgcolor txcolor nw="geo:40.76963076754838,-74.0299466887728" se="geo:40.69405512120753,-73.96035869194179" ct01="geo:40.71451100,-73.99131600" ct02="geo:40.71462500,-73.99221667" ct03="geo:40.71454722,-73.99143333" // image locations ctext "Art and their locations" tx ty ts geobound se nw geocanvas 50 95 20 100 georegion "borough.geojson" "white" 30 geomark ct03 1.00 "red" 50 geomark ct01 1.25 "green" 50 geomark ct02 1.5 "tan" 50 // slide title // set geo bounds // set geo canvas bounds // show map outline // mark locations image image image image eslide Show the art and where it lives. // 4-up and map // upper-left of map bound // lower-right of map bound "images/chinatown08r.jpg" col1 row1 15 0 // lower left image "images/chinatown09r.jpg" col1 row2 15 0 // upper left image "images/chinatown04r.jpg" col2 row1 15 0 // lower right image "images/chinatown03r.jpg" col2 row2 15 0 // upper right image [21]
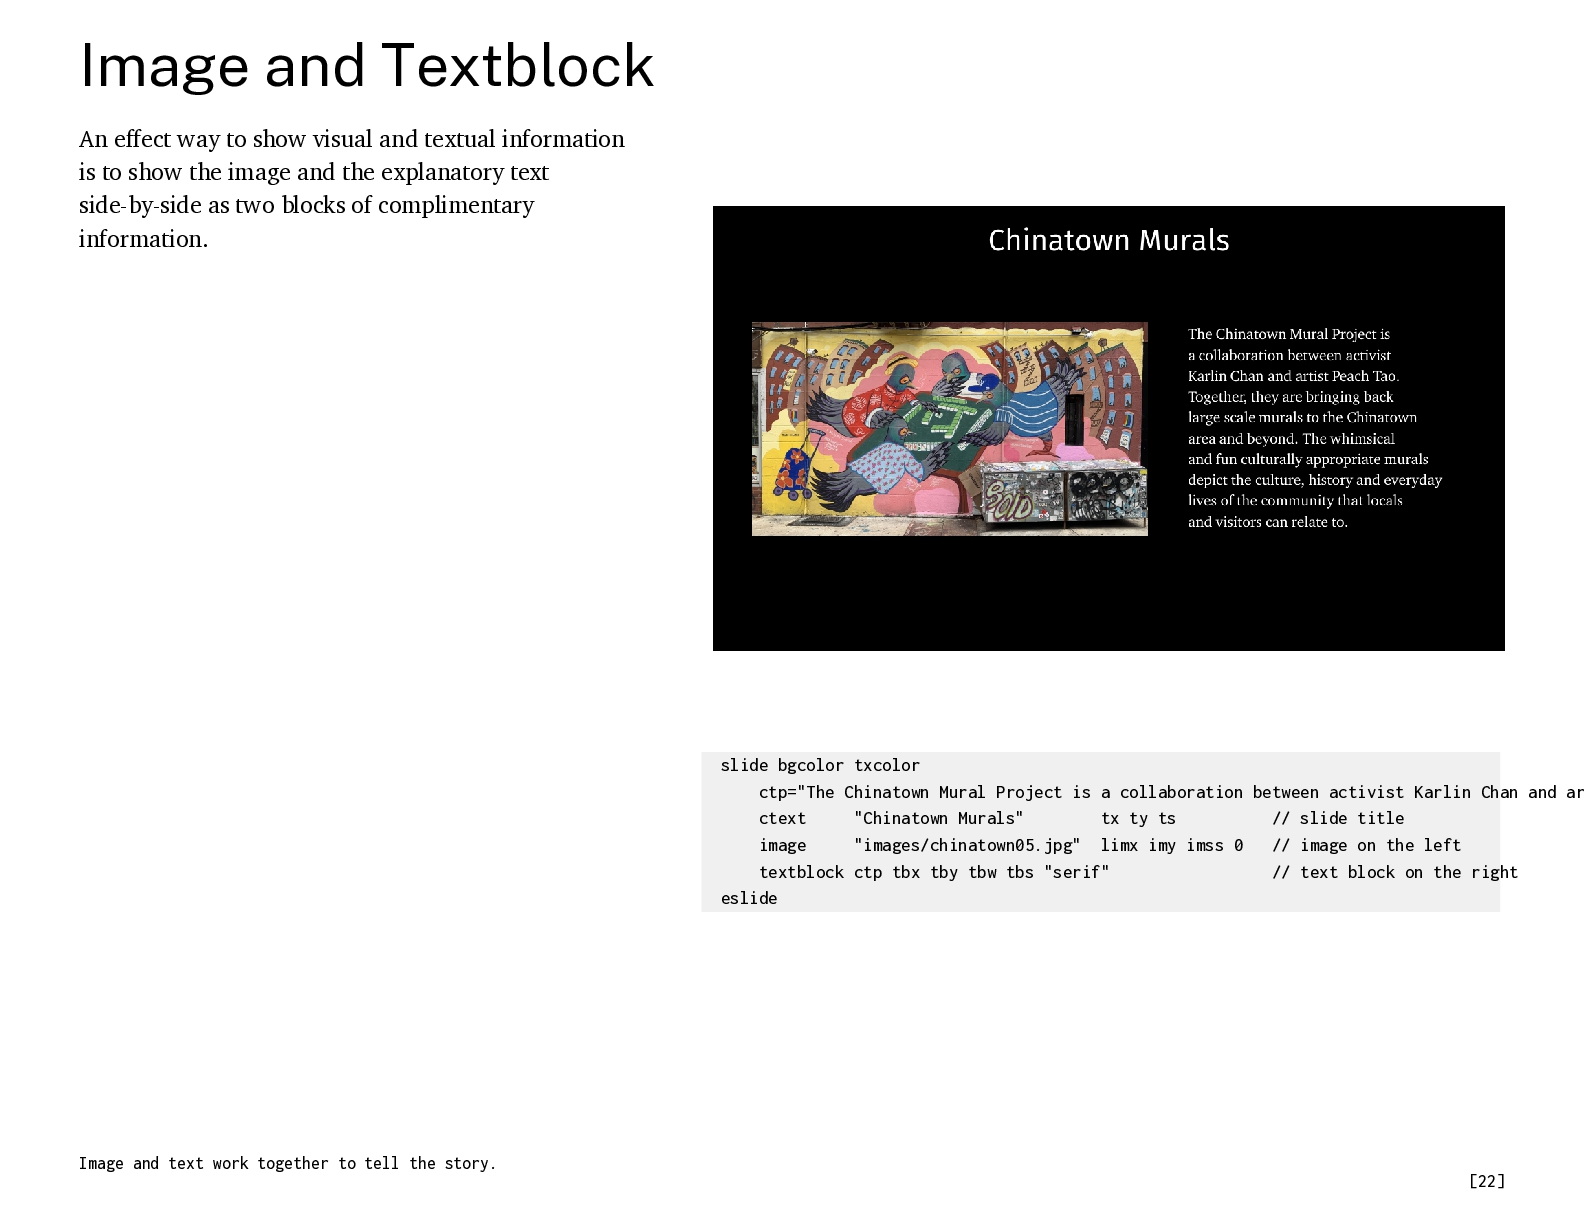
  22. Image and Textblock An effect way to show visual and

    textual information is to show the image and the explanatory text side-by-side as two blocks of complimentary information. slide bgcolor txcolor ctp="The Chinatown Mural Project is a collaboration between activist Karlin Chan and ar ctext "Chinatown Murals" tx ty ts // slide title image "images/chinatown05.jpg" limx imy imss 0 // image on the left textblock ctp tbx tby tbw tbs "serif" // text block on the right eslide Image and text work together to tell the story. [22]
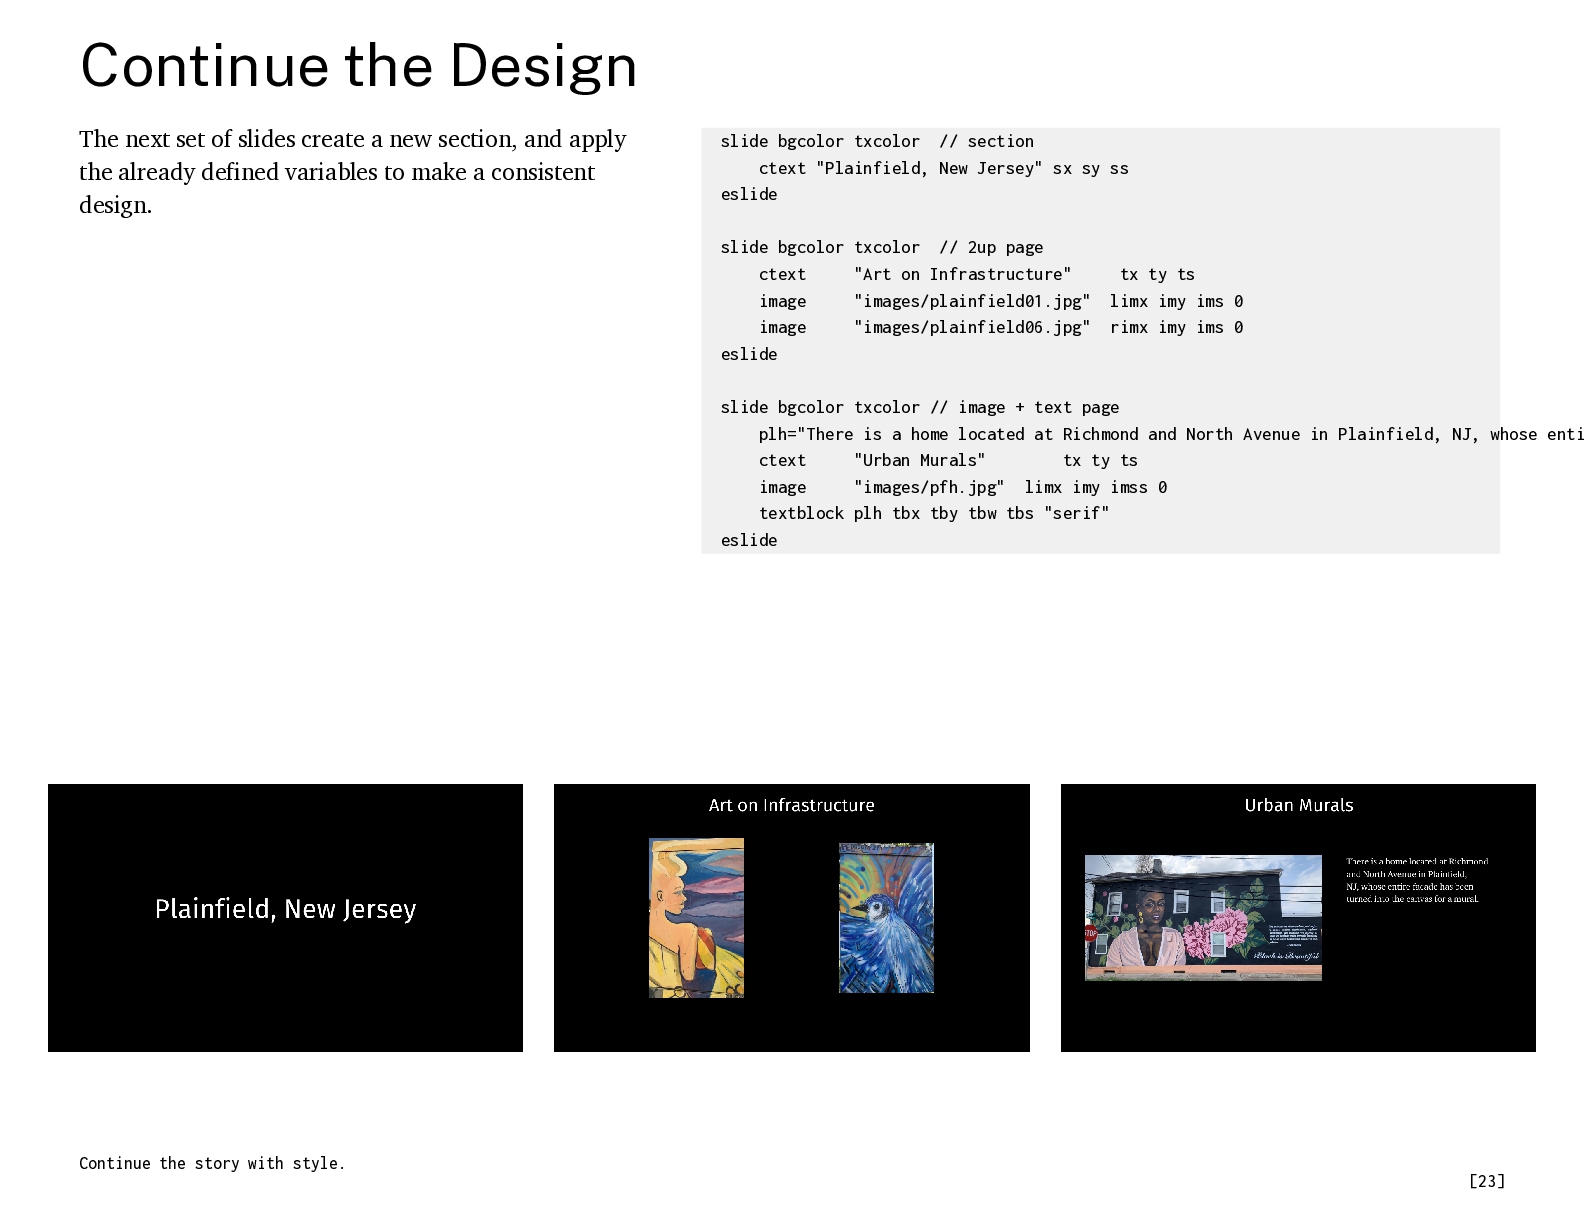
  23. Continue the Design The next set of slides create a

    new section, and apply the already defined variables to make a consistent design. slide bgcolor txcolor // section ctext "Plainfield, New Jersey" sx sy ss eslide slide bgcolor txcolor // 2up page ctext "Art on Infrastructure" image "images/plainfield01.jpg" image "images/plainfield06.jpg" eslide tx ty ts limx imy ims 0 rimx imy ims 0 slide bgcolor txcolor // image + text page plh="There is a home located at Richmond and North Avenue in Plainfield, NJ, whose enti ctext "Urban Murals" tx ty ts image "images/pfh.jpg" limx imy imss 0 textblock plh tbx tby tbw tbs "serif" eslide Continue the story with style. [23]
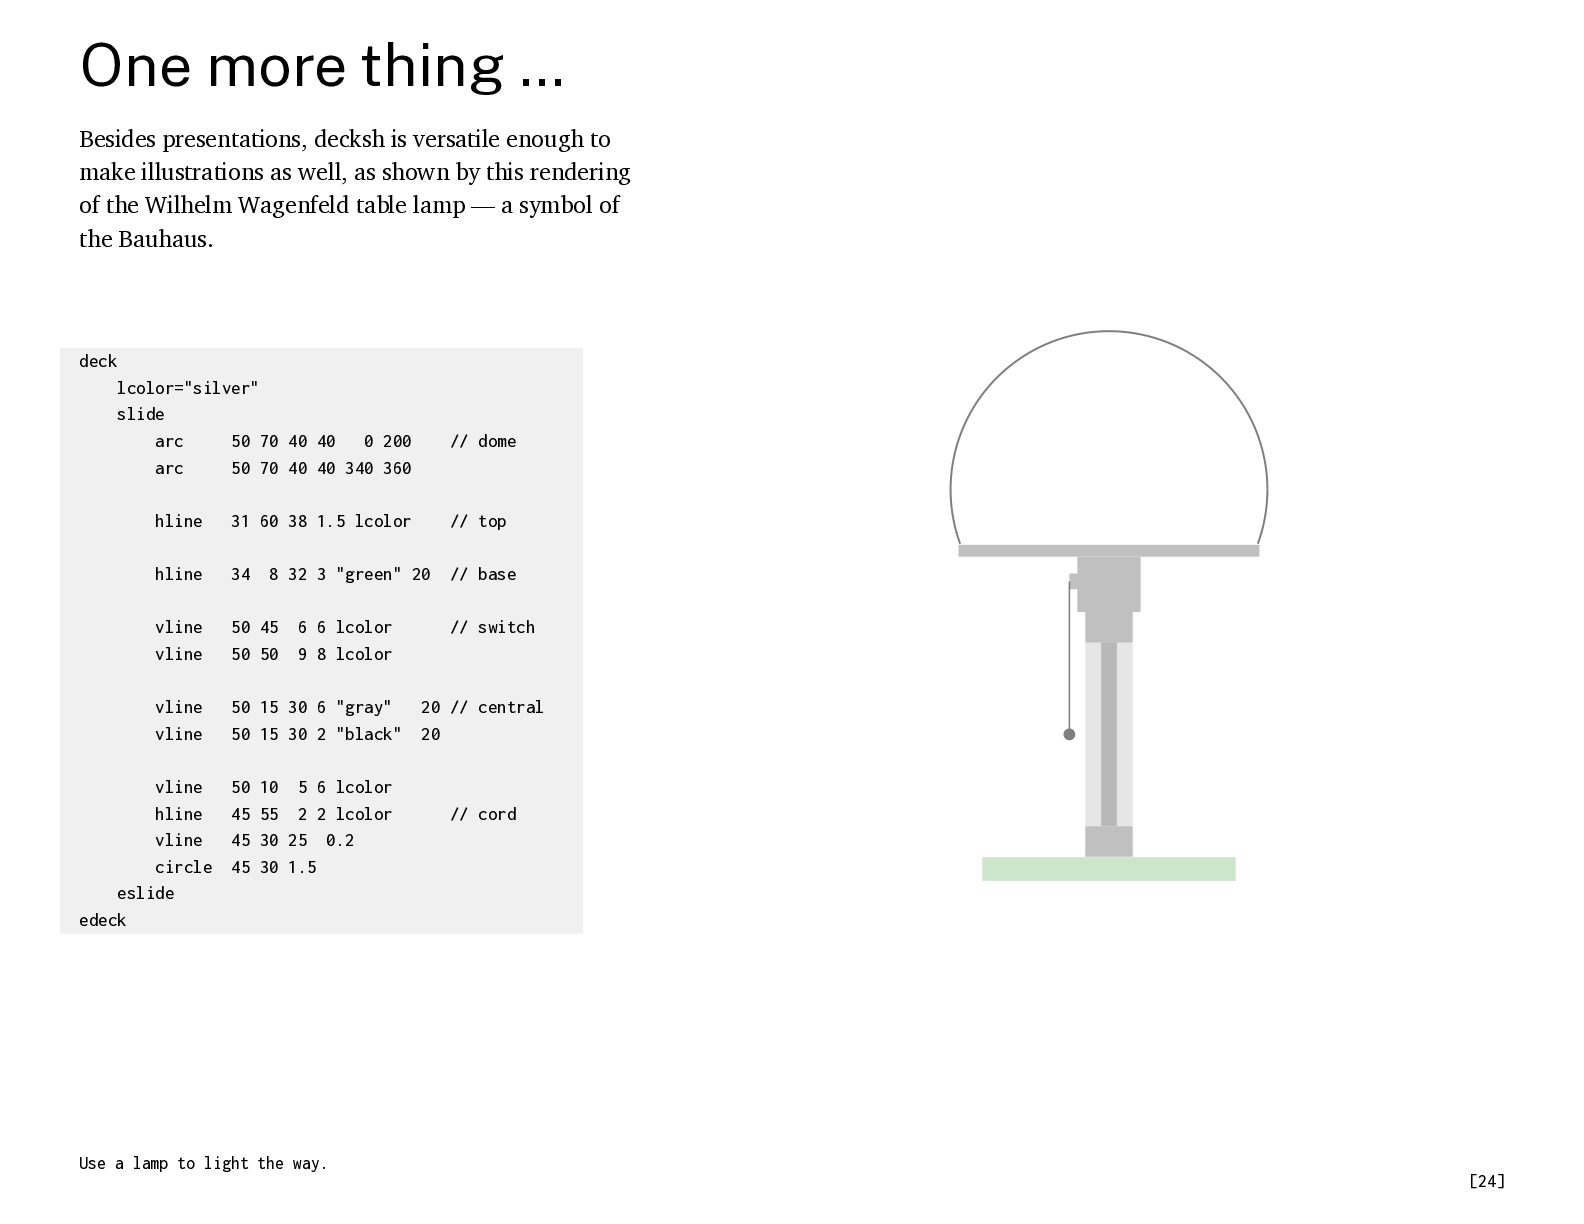
  24. One more thing … Besides presentations, decksh is versatile enough

    to make illustrations as well, as shown by this rendering of the Wilhelm Wagenfeld table lamp — a symbol of the Bauhaus. deck lcolor="silver" slide arc 50 70 40 40 0 200 arc 50 70 40 40 340 360 // dome hline 31 60 38 1.5 lcolor // top hline 34 // base vline vline 50 45 50 50 6 6 lcolor 9 8 lcolor // switch vline vline 50 15 30 6 "gray" 50 15 30 2 "black" 20 // central 20 vline hline vline circle eslide edeck 50 10 5 6 lcolor 45 55 2 2 lcolor 45 30 25 0.2 45 30 1.5 8 32 3 "green" 20 Use a lamp to light the way. // cord [24]
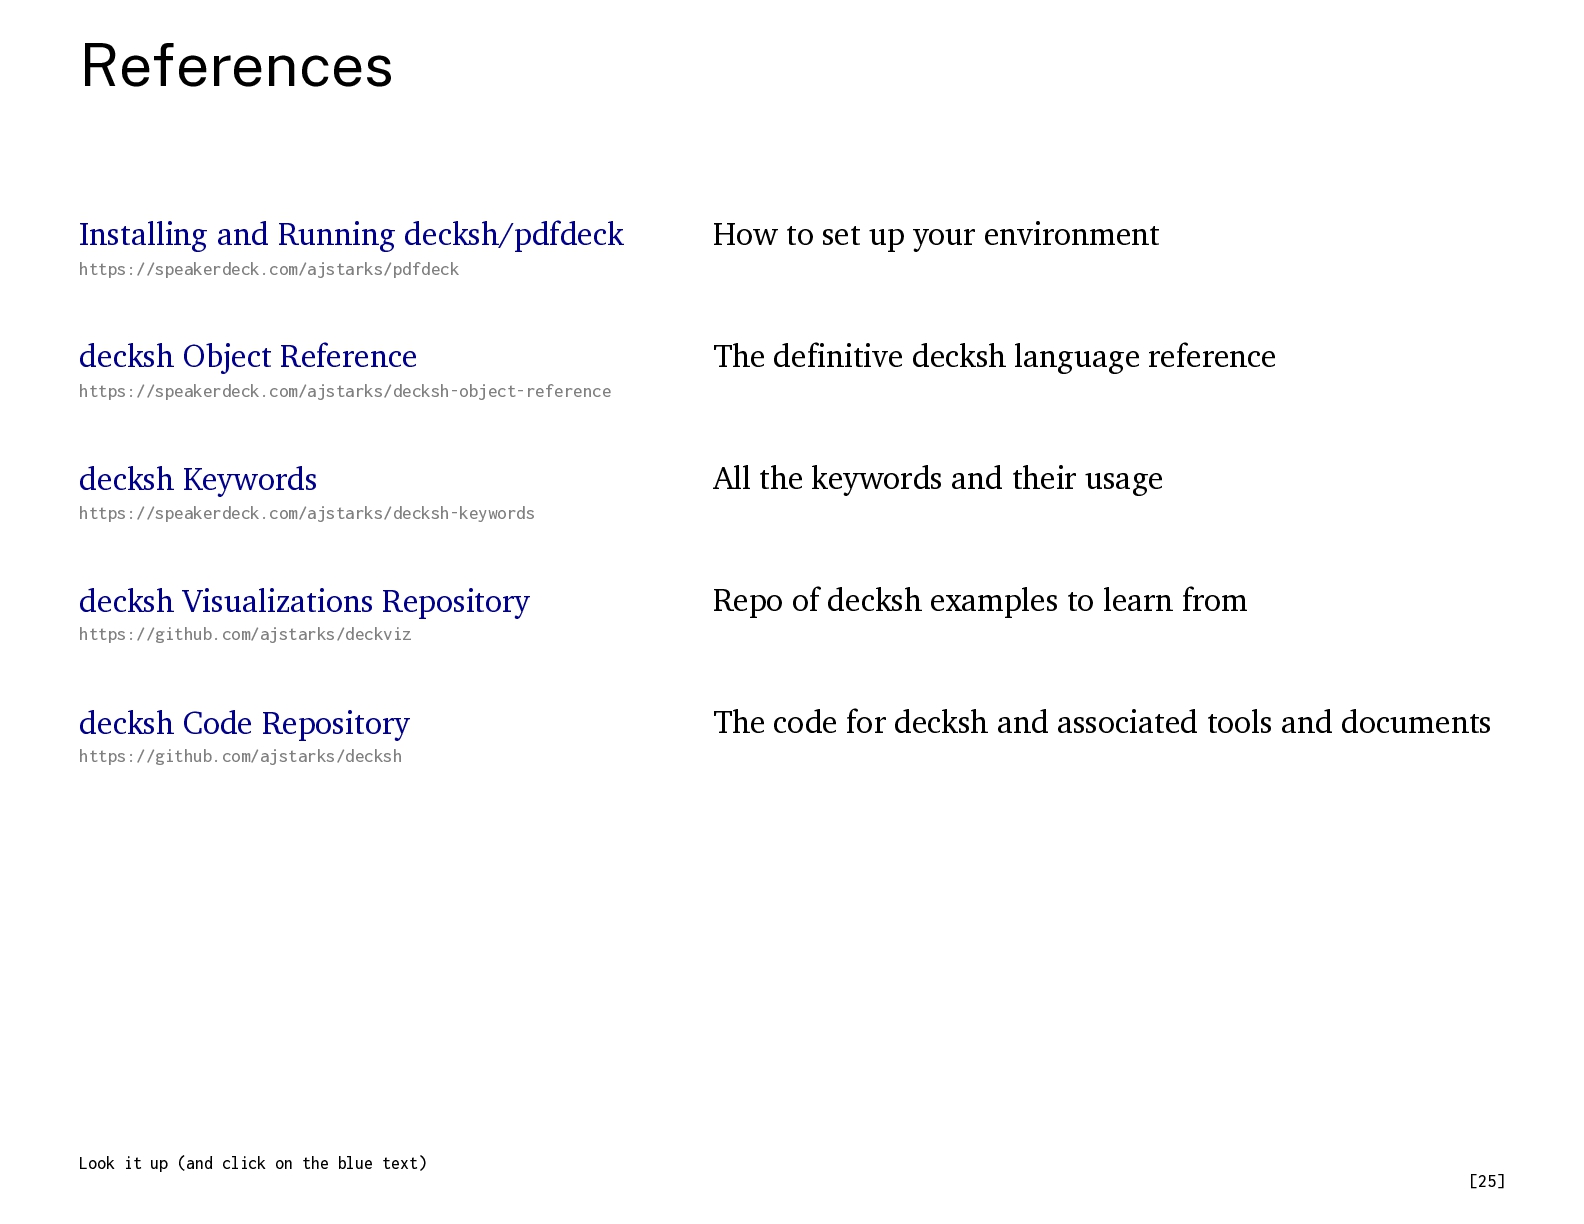
  25. References Installing and Running decksh/pdfdeck How to set up your

    environment https://speakerdeck.com/ajstarks/pdfdeck decksh Object Reference The definitive decksh language reference https://speakerdeck.com/ajstarks/decksh-object-reference decksh Keywords All the keywords and their usage https://speakerdeck.com/ajstarks/decksh-keywords decksh Visualizations Repository Repo of decksh examples to learn from https://github.com/ajstarks/deckviz decksh Code Repository The code for decksh and associated tools and documents https://github.com/ajstarks/decksh Look it up (and click on the blue text) [25]