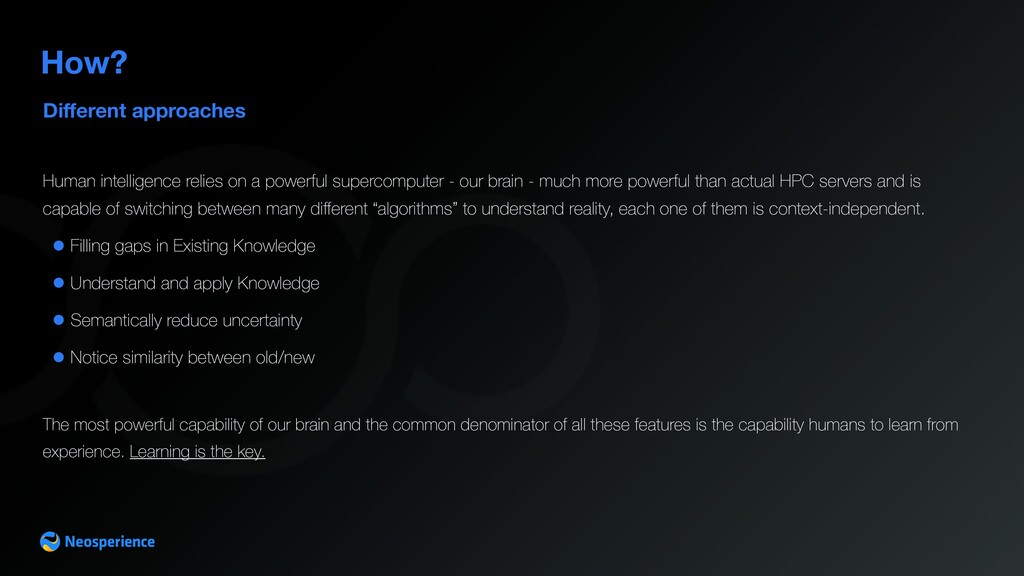
- our brain - much more powerful than actual HPC servers and is capable of switching between many different “algorithms” to understand reality, each one of them is context-independent. • Filling gaps in Existing Knowledge • Understand and apply Knowledge • Semantically reduce uncertainty • Notice similarity between old/new The most powerful capability of our brain and the common denominator of all these features is the capability humans to learn from experience. Learning is the key.
to perform tasks normally requiring human intelligence, such as visual perception, speech recognition, decision-making, and translation between languages.”
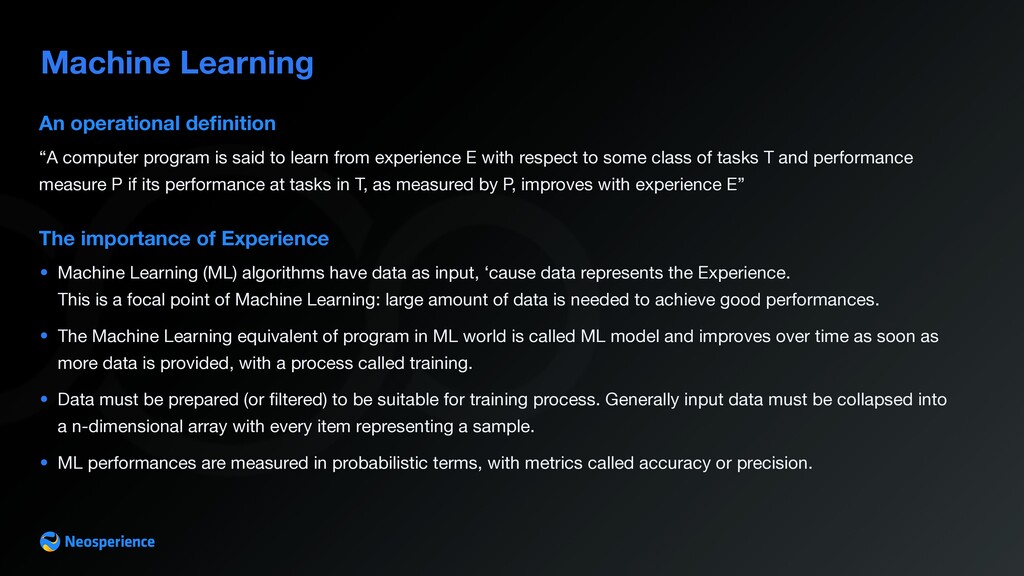
algorithms have data as input, ‘cause data represents the Experience. This is a focal point of Machine Learning: large amount of data is needed to achieve good performances. • The Machine Learning equivalent of program in ML world is called ML model and improves over time as soon as more data is provided, with a process called training. • Data must be prepared (or filtered) to be suitable for training process. Generally input data must be collapsed into a n-dimensional array with every item representing a sample. • ML performances are measured in probabilistic terms, with metrics called accuracy or precision. An operational definition “A computer program is said to learn from experience E with respect to some class of tasks T and performance measure P if its performance at tasks in T, as measured by P, improves with experience E”
of the dependent variable (or 'criterion variable') changes when any one of the independent variables is varied, while the other independent variables are held fixed. Is a statistical method of data analysis. The most common algorithm least square method that provides an estimation of regression parameters. When dataset is not trivial estimation is achieved through is gradient descent.
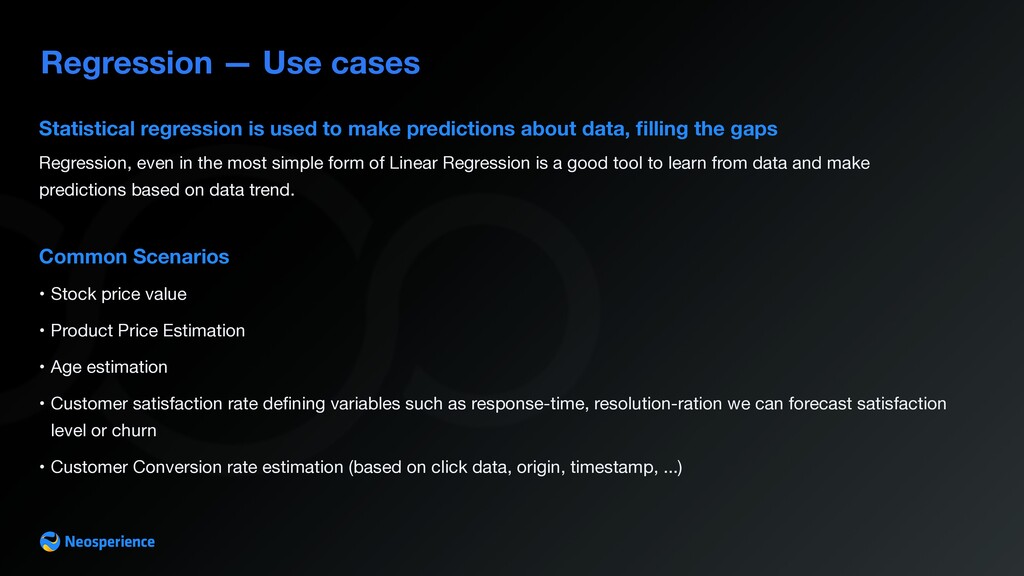
predictions about data, filling the gaps Regression, even in the most simple form of Linear Regression is a good tool to learn from data and make predictions based on data trend. Common Scenarios • Stock price value • Product Price Estimation • Age estimation • Customer satisfaction rate defining variables such as response-time, resolution-ration we can forecast satisfaction level or churn • Customer Conversion rate estimation (based on click data, origin, timestamp, ...)
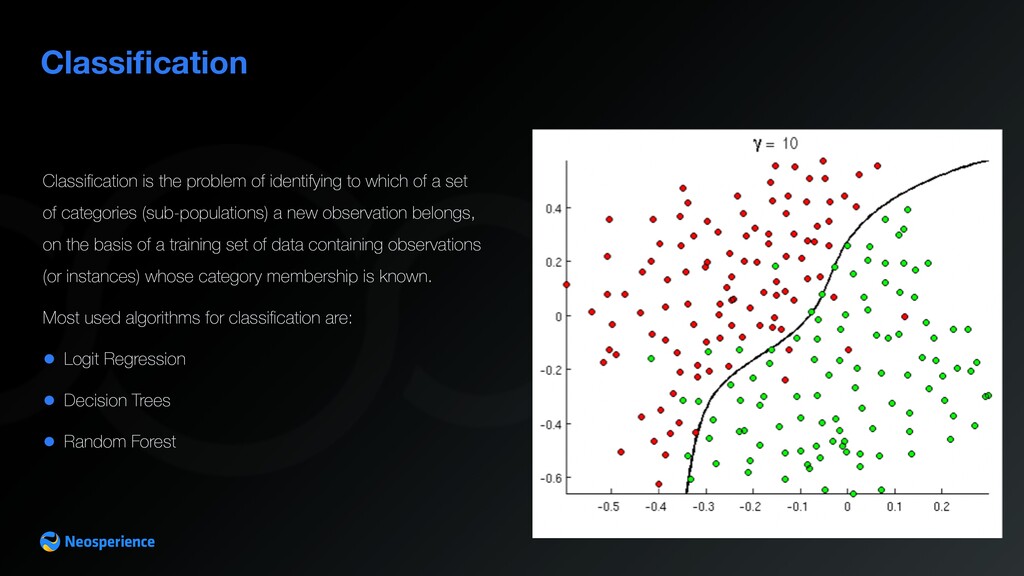
a set of categories (sub-populations) a new observation belongs, on the basis of a training set of data containing observations (or instances) whose category membership is known. Most used algorithms for classification are: • Logit Regression • Decision Trees • Random Forest
Spam/Not Spam classification • Customer conversion prediction • Customer churn prediction • Customer personas classification Classification — Use cases Classification is used to detect the binary outcome of a variable Classification is often used to classify people into pre-defined clusters (good-payer/bad-payer, in/out target, etc.)
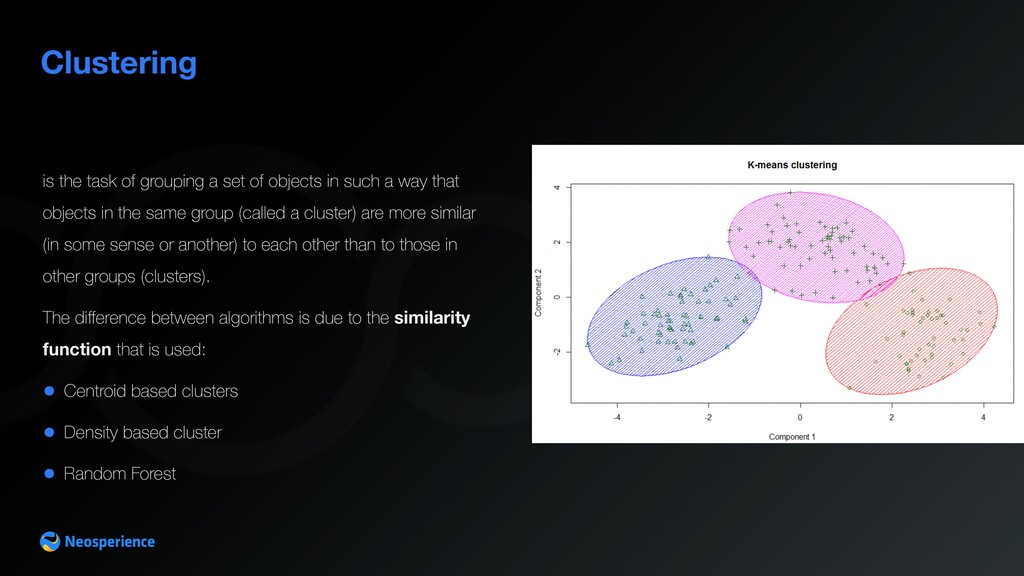
in such a way that objects in the same group (called a cluster) are more similar (in some sense or another) to each other than to those in other groups (clusters). The difference between algorithms is due to the similarity function that is used: • Centroid based clusters • Density based cluster • Random Forest
Similarity analysis • Customer base segmentation Clustering — Use cases Clustering is used to segment data Clustering labels each sample with a name representing its belonging cluster. Labelling can be exclusive or multiple. Clusters are dynamic structures: they adapt to new sample coming into the model as soon as thy label them.
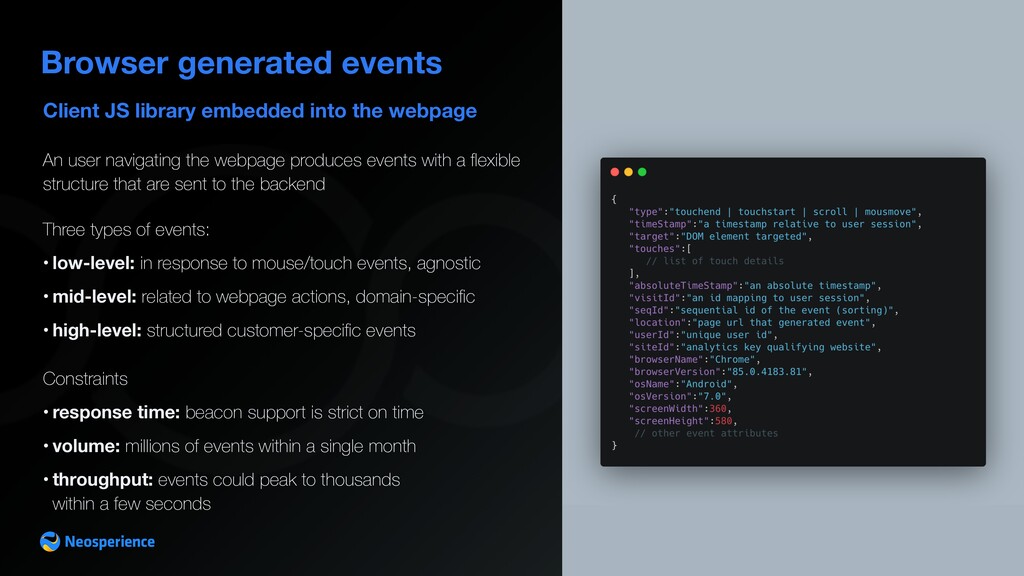
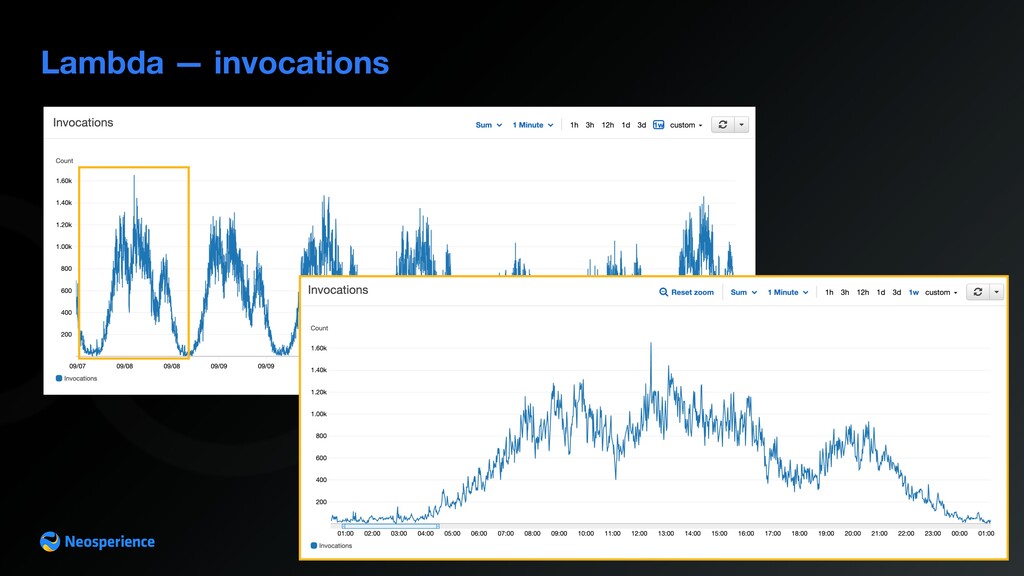
An user navigating the webpage produces events with a flexible structure that are sent to the backend Three types of events: • low-level: in response to mouse/touch events, agnostic • mid-level: related to webpage actions, domain-specific • high-level: structured customer-specific events Constraints • response time: beacon support is strict on time • volume: millions of events within a single month • throughput: events could peak to thousands within a few seconds
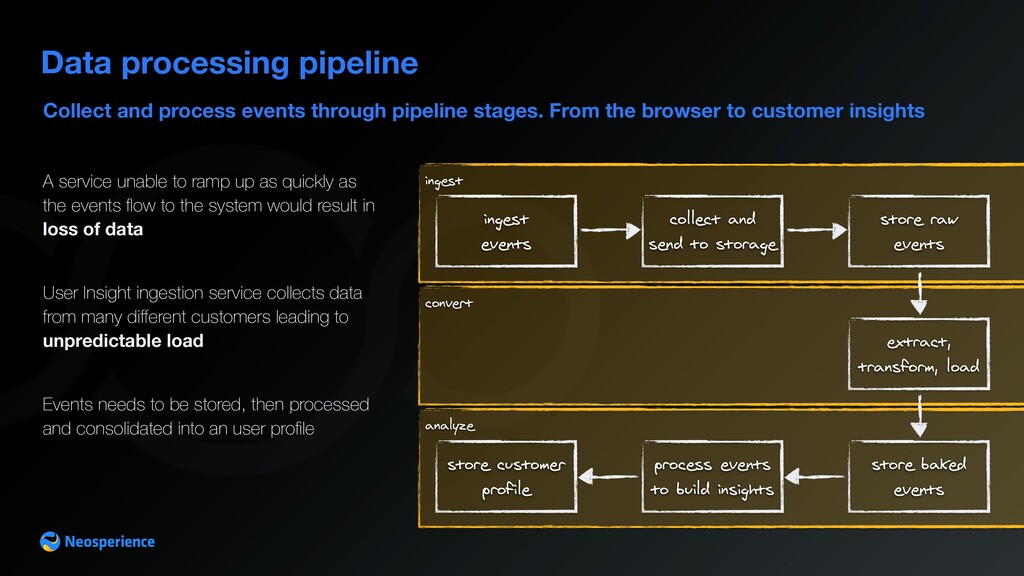
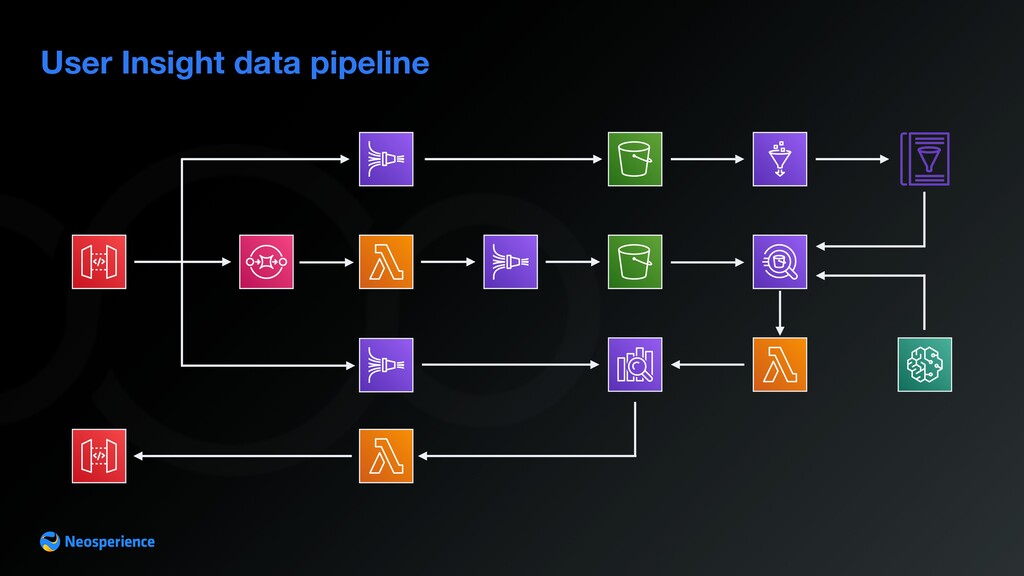
From the browser to customer insights Data processing pipeline A service unable to ramp up as quickly as the events flow to the system would result in loss of data User Insight ingestion service collects data from many different customers leading to unpredictable load Events needs to be stored, then processed and consolidated into an user profile ingest events collect and send to storage store raw events extract, transform, load store baked events process events to build insights store customer profile
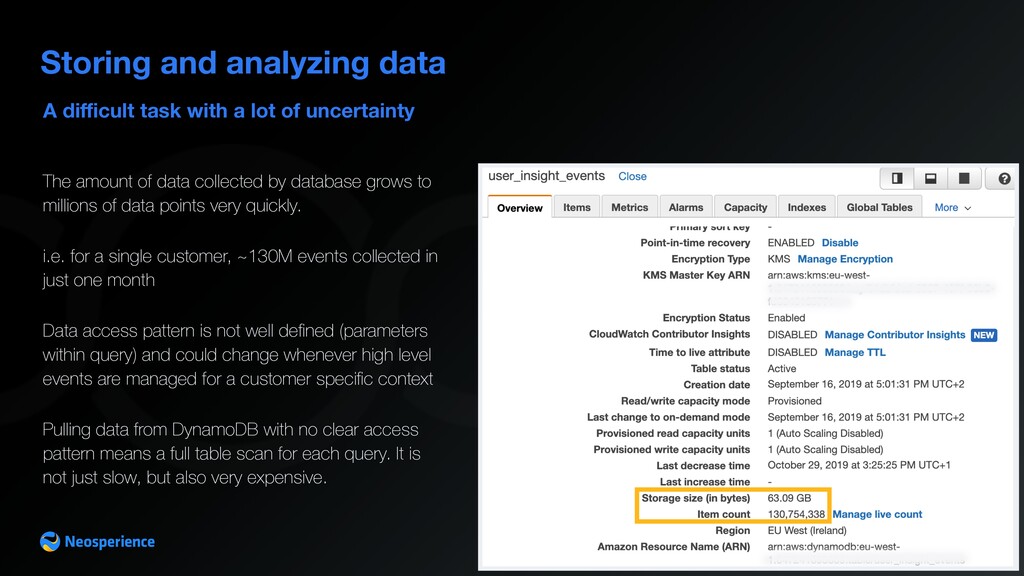
analyzing data The amount of data collected by database grows to millions of data points very quickly. i.e. for a single customer, ~130M events collected in just one month Data access pattern is not well defined (parameters within query) and could change whenever high level events are managed for a customer specific context Pulling data from DynamoDB with no clear access pattern means a full table scan for each query. It is not just slow, but also very expensive.
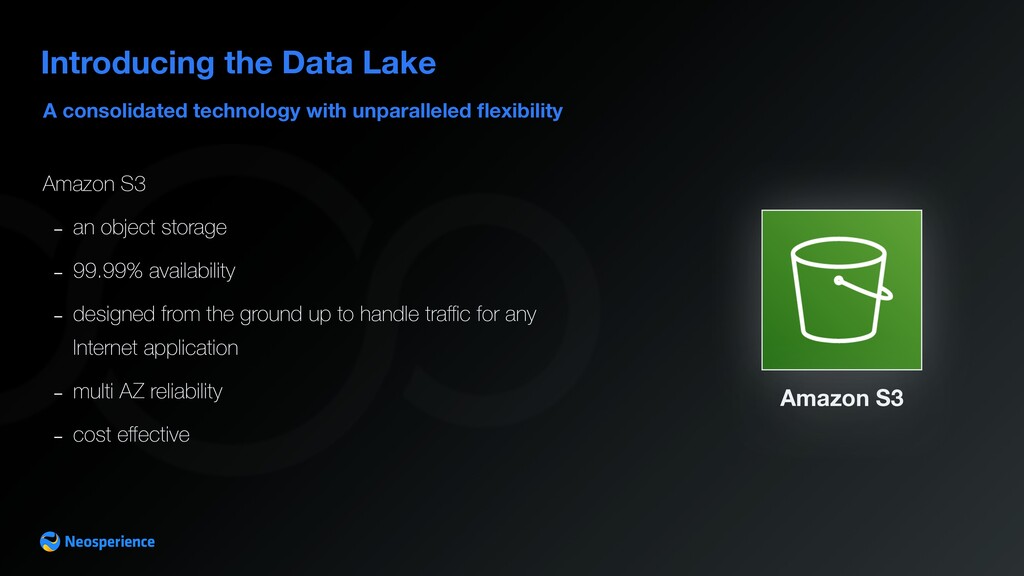
Amazon S3 - an object storage - 99.99% availability - designed from the ground up to handle traffic for any Internet application - multi AZ reliability - cost effective Amazon S3
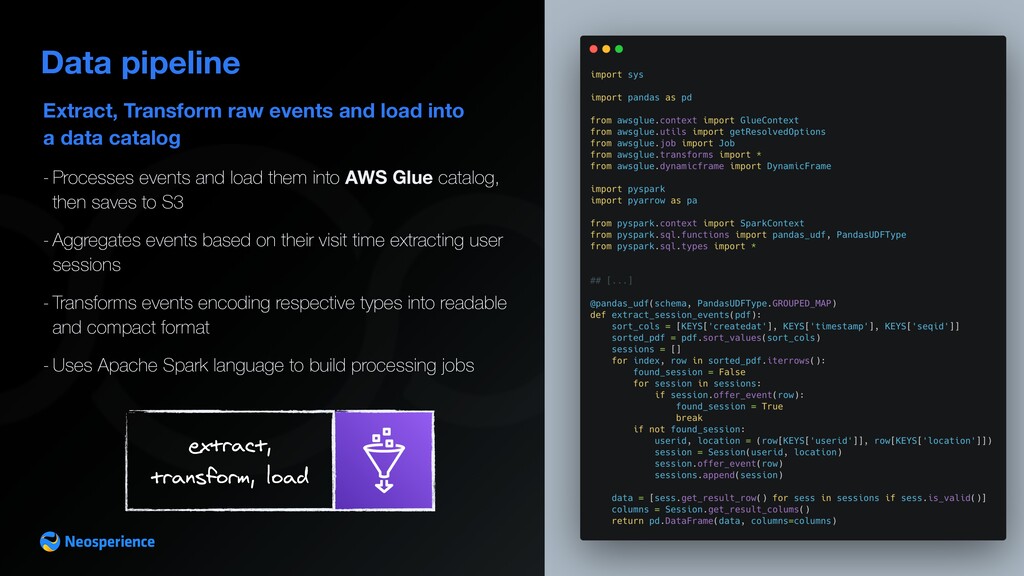
Data pipeline extract, transform, load - Processes events and load them into AWS Glue catalog, then saves to S3 - Aggregates events based on their visit time extracting user sessions - Transforms events encoding respective types into readable and compact format - Uses Apache Spark language to build processing jobs
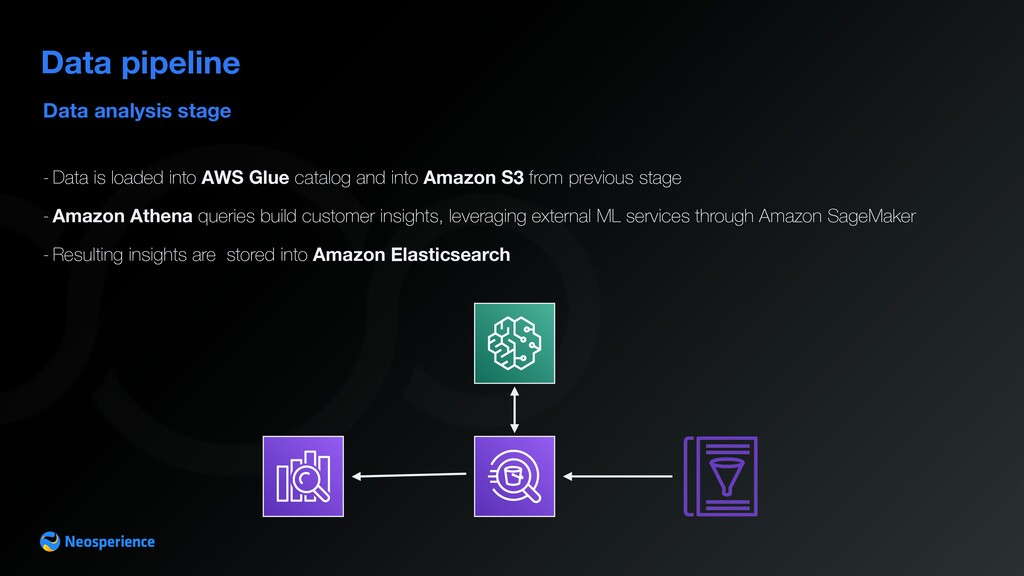
AWS Glue catalog and into Amazon S3 from previous stage - Amazon Athena queries build customer insights, leveraging external ML services through Amazon SageMaker - Resulting insights are stored into Amazon Elasticsearch
driven architecture Operations + Machine Learning —> MLOps • Think about streams of data flowing into an application • Collect data in a reliable way • Data preparation is often more relevant than ML models • ETL jobs to aggregate and transform data • Query data to filter relevant data • Deploy ML model and think about scalability • Consolidate data back into NoSQL data stores (i.e. a data lake)
![www.neosperience.com | blog.neosperience.com | [email protected] Neosperience Empathy in Technology AI,](https://files.speakerdeck.com/presentations/0b457c65d04244bfb056408cdffcf533/slide_0.jpg)
![www.neosperience.com | blog.neosperience.com | [email protected]](https://files.speakerdeck.com/presentations/0b457c65d04244bfb056408cdffcf533/slide_32.jpg)