Upgrade to Pro
— share decks privately, control downloads, hide ads and more …
Speaker Deck
Features
Speaker Deck
PRO
Sign in
Sign up for free
Search
Search
Democratize Metrics with Grafana
Search
Alexander Zobnin
July 14, 2017
Programming
660
3
Share
Embed
Copy iframe code
Copy JS code
Copy link
Start on current slide
Democratize Metrics with Grafana
Alexander Zobnin
July 14, 2017
Other Decks in Programming
See All in Programming
Hatena Engineer Seminar #37「言語モデルの活用に関する研究」
slashnephy
0
520
そのテスト、説明できますか?~LWテスト戦略FW~のご紹介
nakahara
0
210
Terraform標準の組織で AWS CDKをどう使うか
mu7889yoon
0
200
型も通る、synthも通る、それでも危ない 〜AIのCDKの権限とコストを機械で検証する〜 / It Passes Type Checks, It Passes Synth Checks, but It’s Still Risky — Automatically Verifying Permissions and Costs in AI’s CDK —
seike460
PRO
1
320
ローカルLLMでどこまでコードが書けるか -拡張版 / How much code can be written on a local LLM Extended
kishida
12
4.8k
エンジニア向け会社紹介/Findy Company Profile
findyinc
6
360k
Apache Hive: そしてCloud Native Lakehouseへ
okumin
1
130
Embedded SREと共に達成した会員管理システムのAWS移行 - SRE NEXT 2026 ランチスポンサーセッション
niftycorp
PRO
1
2.6k
Snowflake Summitでの新機能 CoCo / CoWork / snowflake-summit-2026-overall-what-new-coco
tatsuhiro
1
230
継続モナドとリアクティブプログラミング
yukikurage
3
600
ソフトウェア設計に溶けるインフラ ― AWS CDK のインフラ認識論
konokenj
2
500
信頼性について考えてみる(SRE NEXT 2026 miniLT)
hayama17
0
190
Featured
See All Featured
Site-Speed That Sticks
csswizardry
13
1.3k
How to audit for AI Accessibility on your Front & Back End
davetheseo
0
470
A Guide to Academic Writing Using Generative AI - A Workshop
ks91
PRO
1
350
Stewardship and Sustainability of Urban and Community Forests
pwiseman
0
340
Getting science done with accelerated Python computing platforms
jacobtomlinson
2
310
Raft: Consensus for Rubyists
vanstee
141
7.6k
Java REST API Framework Comparison - PWX 2021
mraible
34
9.5k
KATA
mclloyd
PRO
35
15k
Put a Button on it: Removing Barriers to Going Fast.
kastner
60
4.4k
Building a Modern Day E-commerce SEO Strategy
aleyda
45
9.1k
ピンチをチャンスに:未来をつくるプロダクトロードマップ #pmconf2020
aki_iinuma
128
56k
Into the Great Unknown - MozCon
thekraken
41
2.6k
Transcript
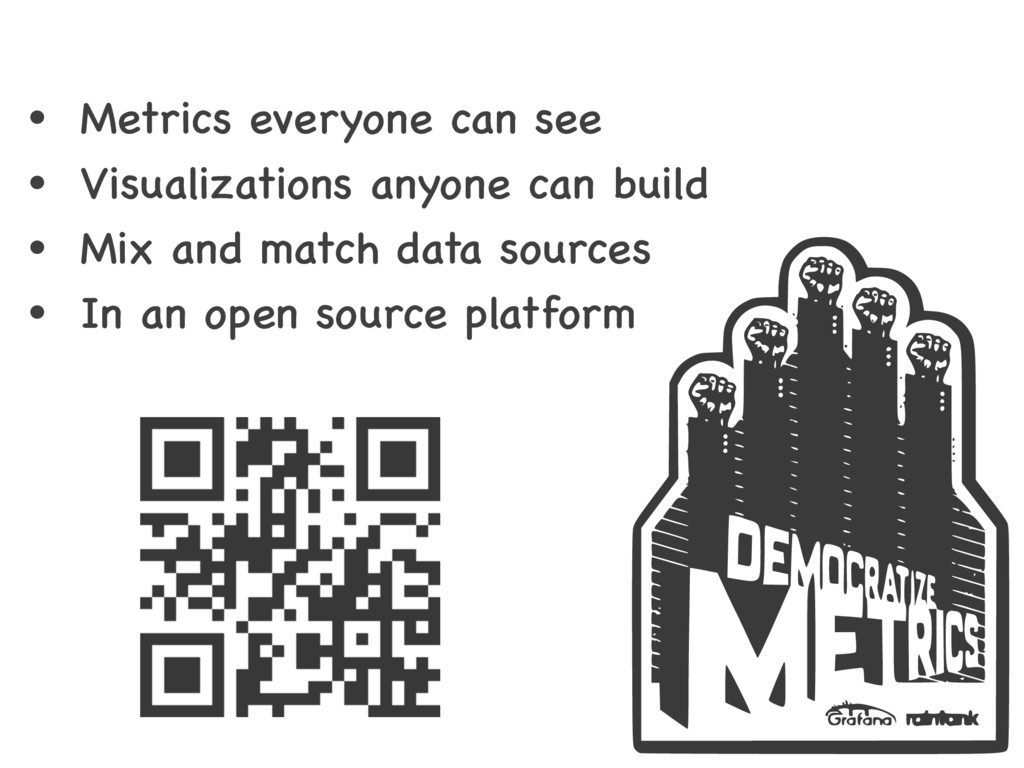
Democratize Metrics with Grafana
• Metrics everyone can see • Visualizations anyone can build
• Mix and match data sources • In an open source platform
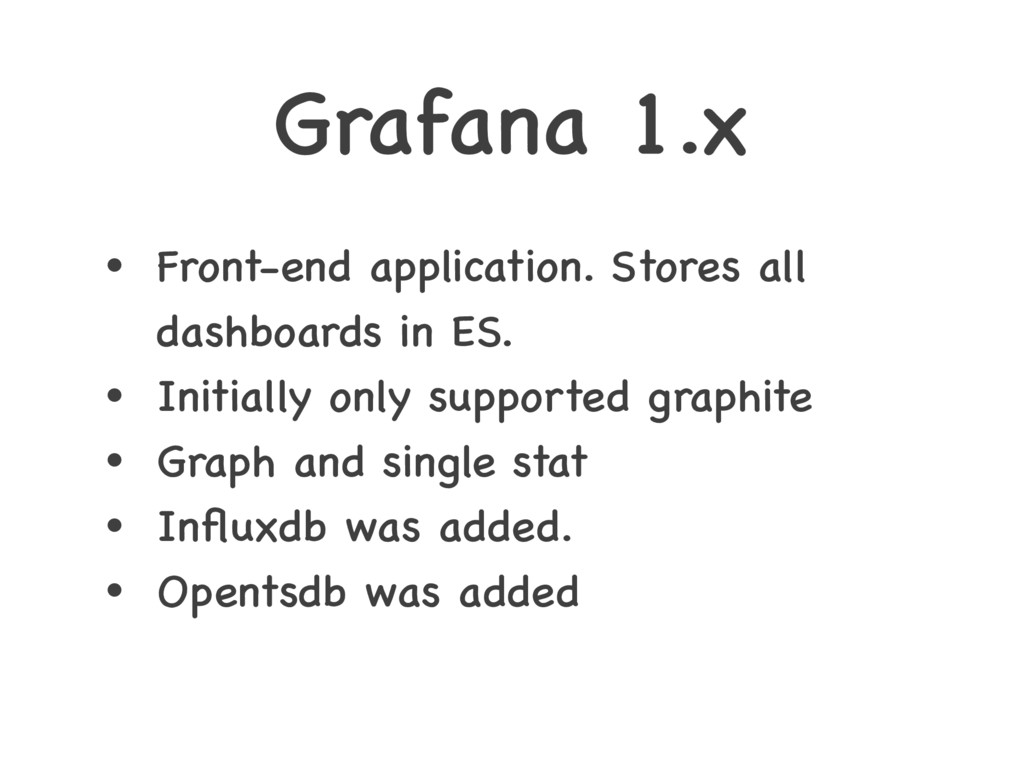
Grafana 1.x • Front-end application. Stores all dashboards in ES.
• Initially only supported graphite • Graph and single stat • Influxdb was added. • Opentsdb was added
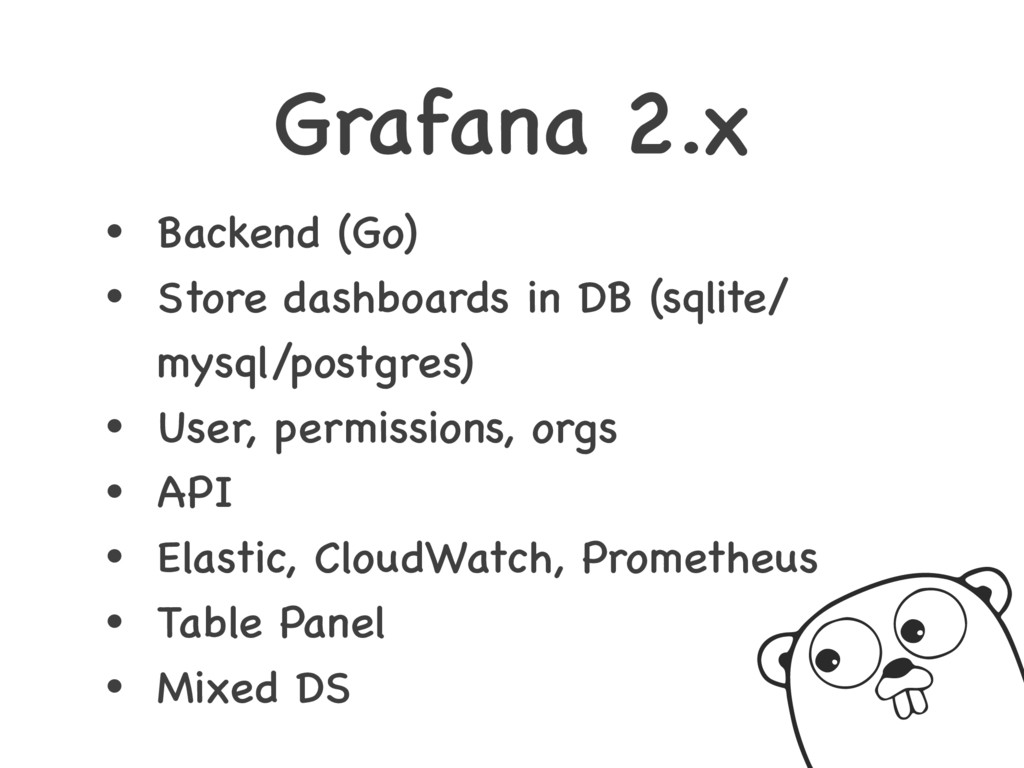
Grafana 2.x • Backend (Go) • Store dashboards in DB
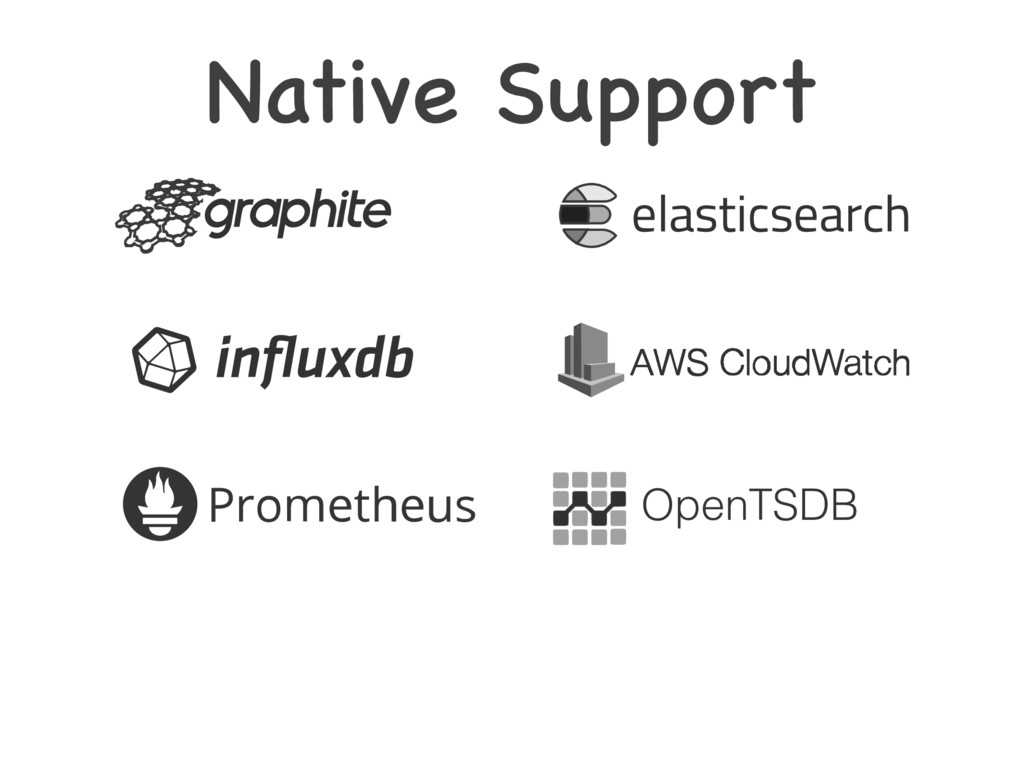
(sqlite/ mysql/postgres) • User, permissions, orgs • API • Elastic, CloudWatch, Prometheus • Table Panel • Mixed DS
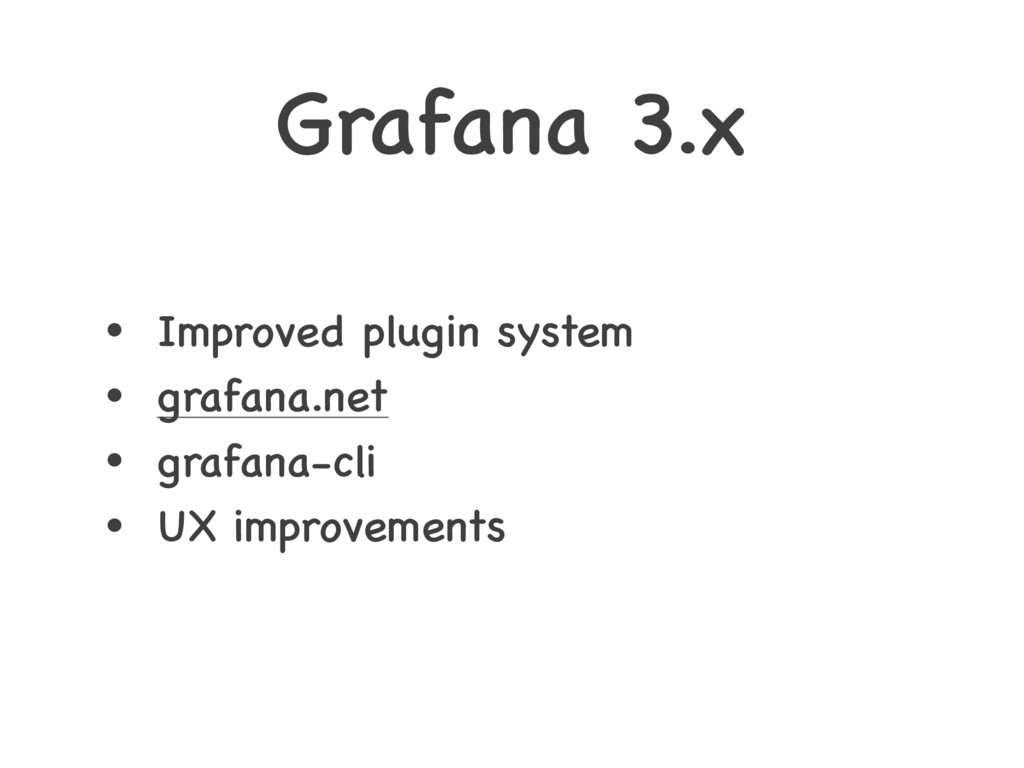
Grafana 3.x • Improved plugin system • grafana.net • grafana-cli
• UX improvements
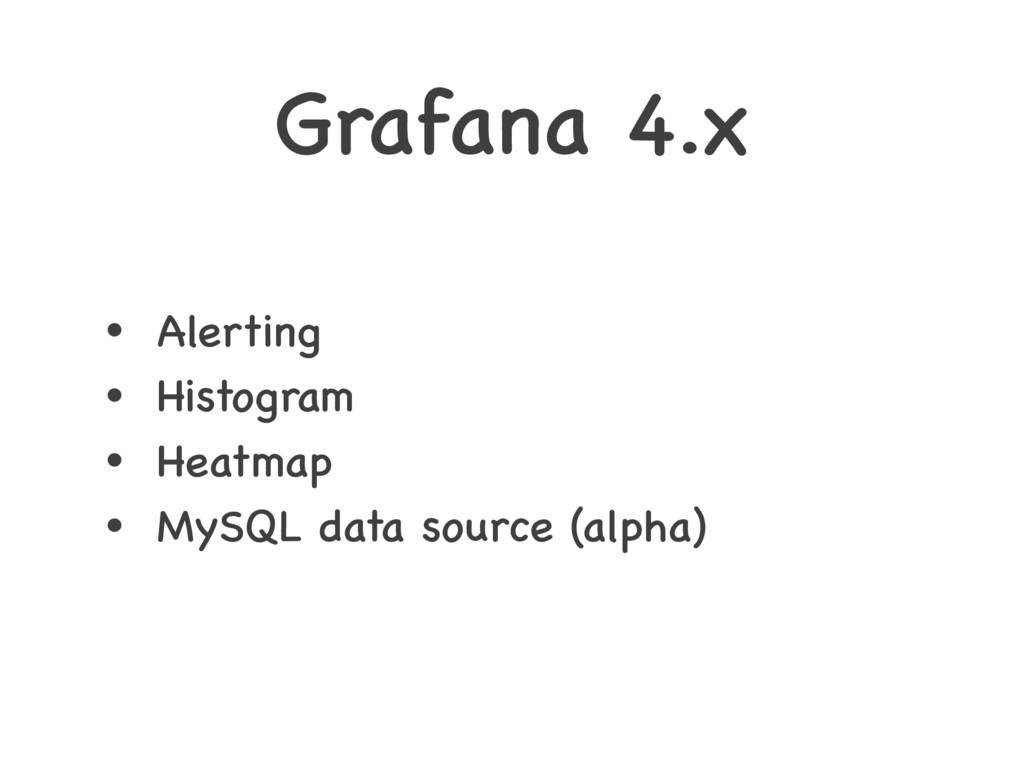
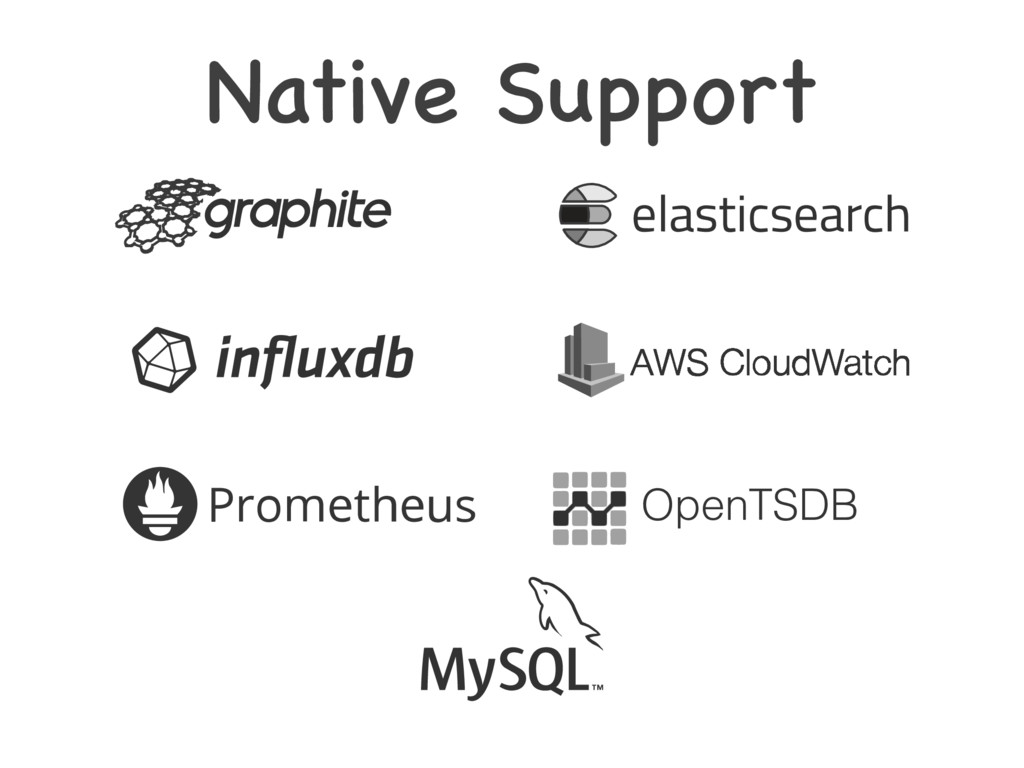
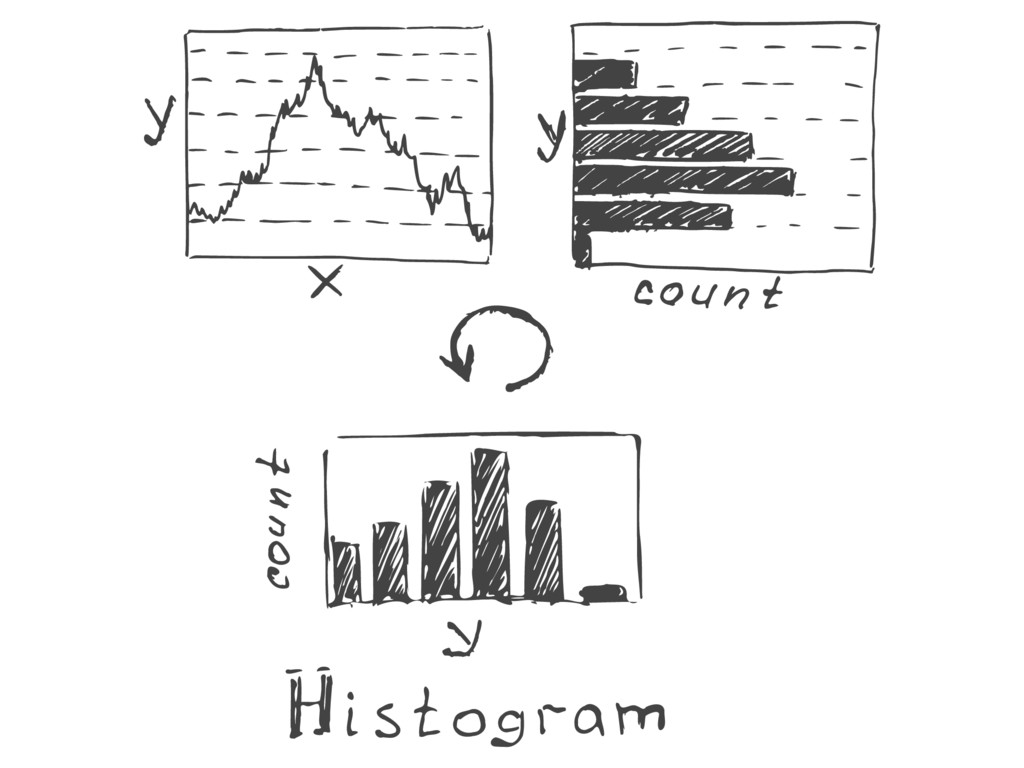
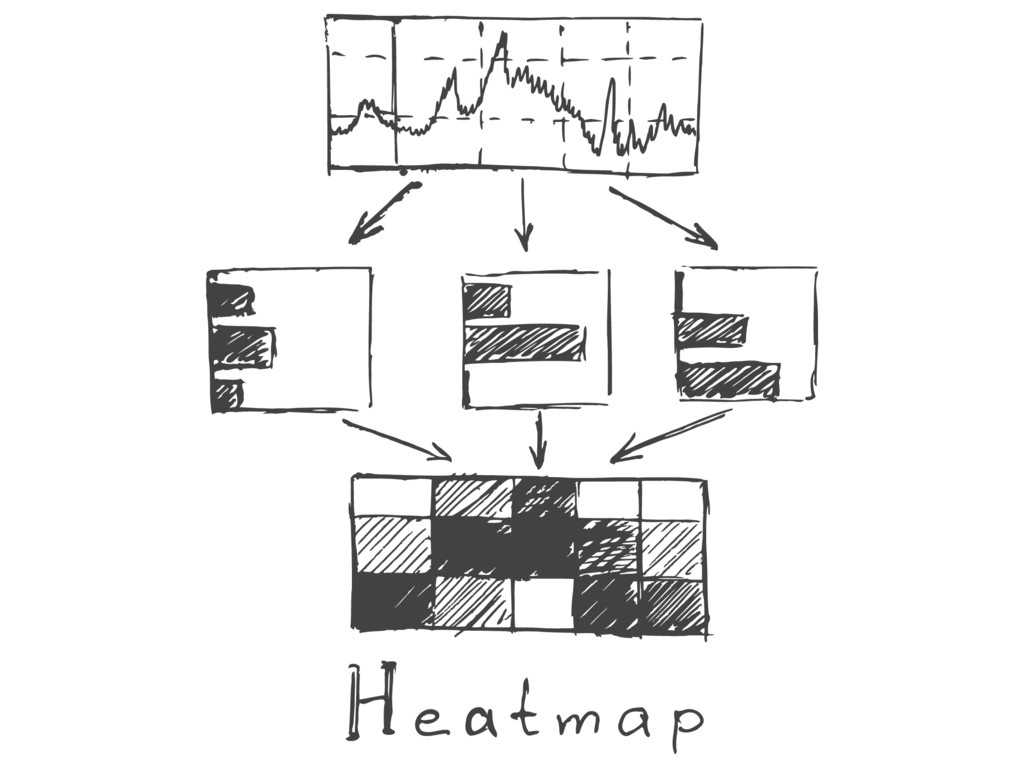
Grafana 4.x • Alerting • Histogram • Heatmap • MySQL
data source (alpha)
None
None
None
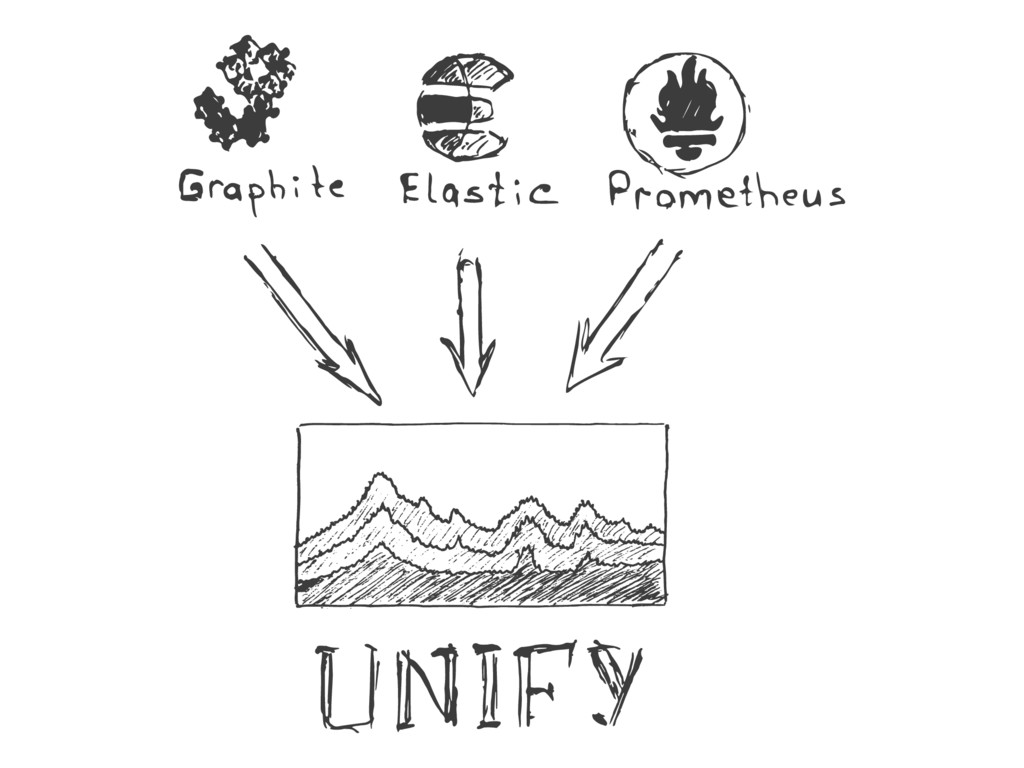
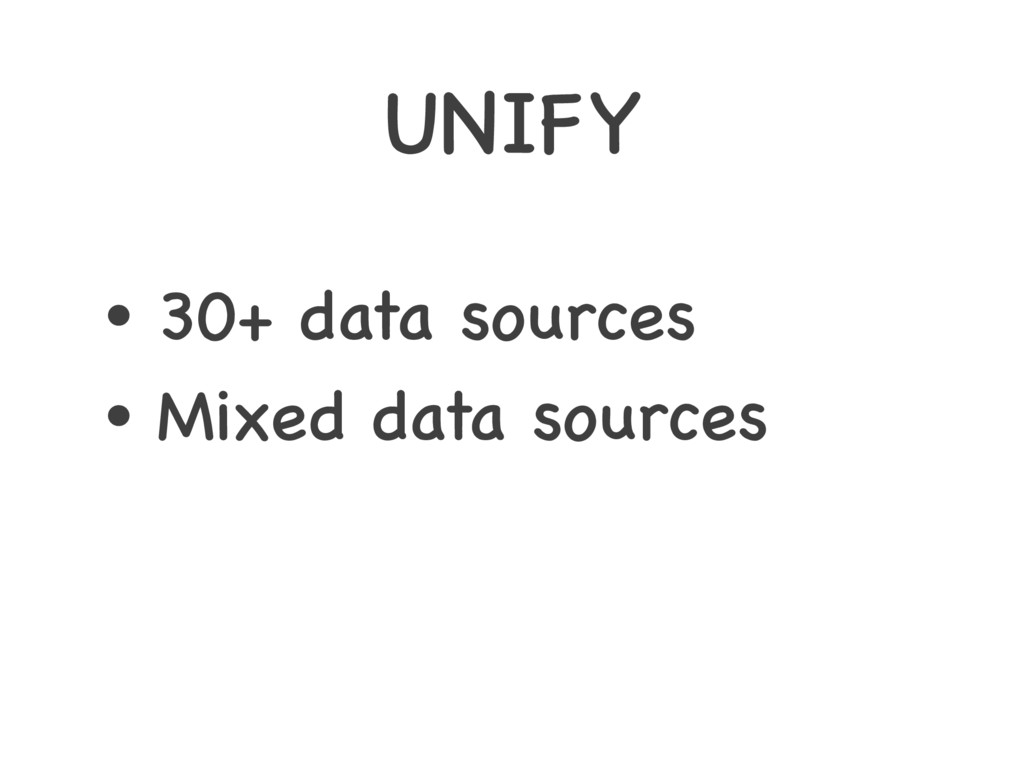
UNIFY • 30+ data sources • Mixed data sources
Native Support OpenTSDB
Native Support OpenTSDB
None
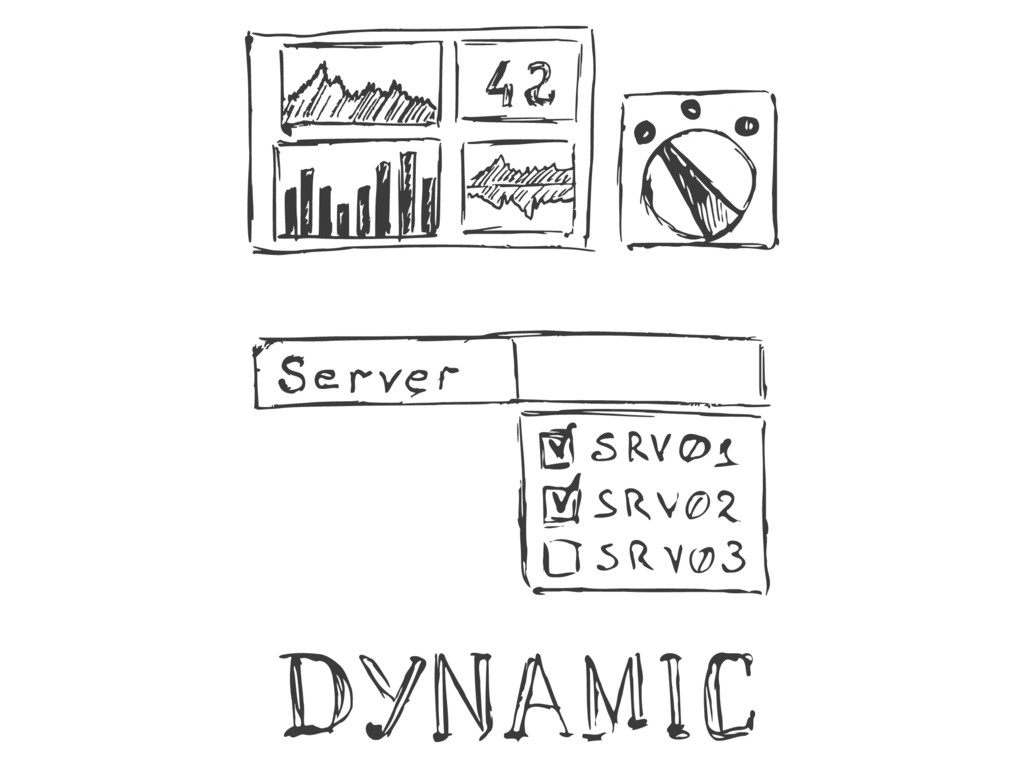
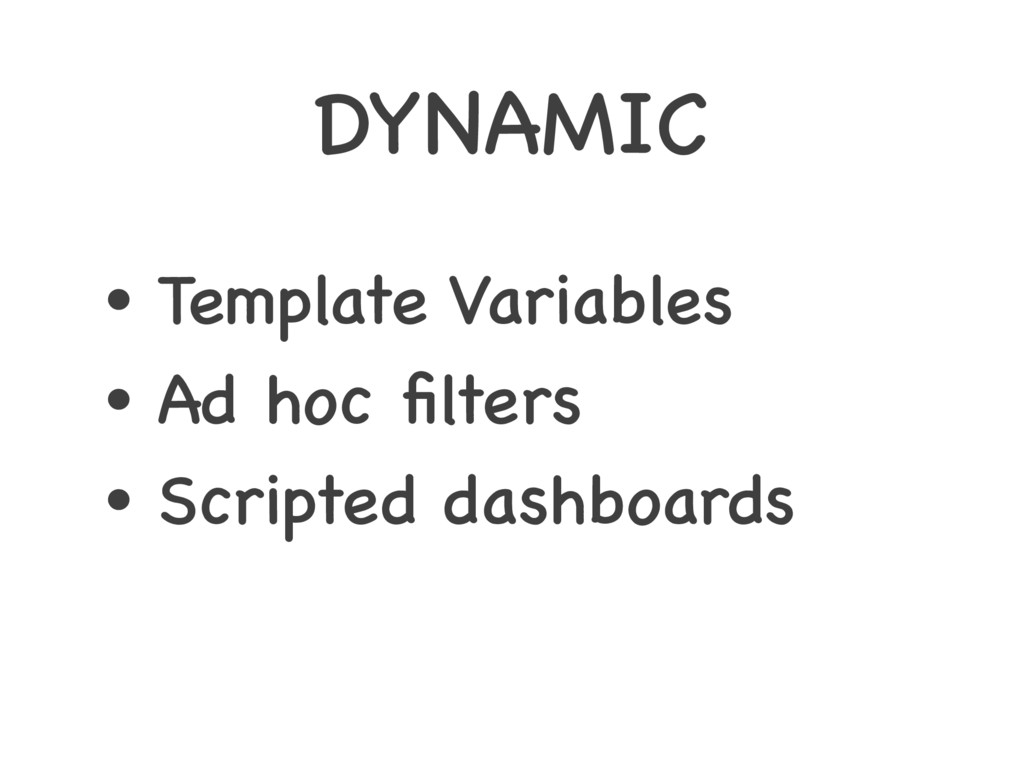
DYNAMIC • Template Variables • Ad hoc filters • Scripted
dashboards
None
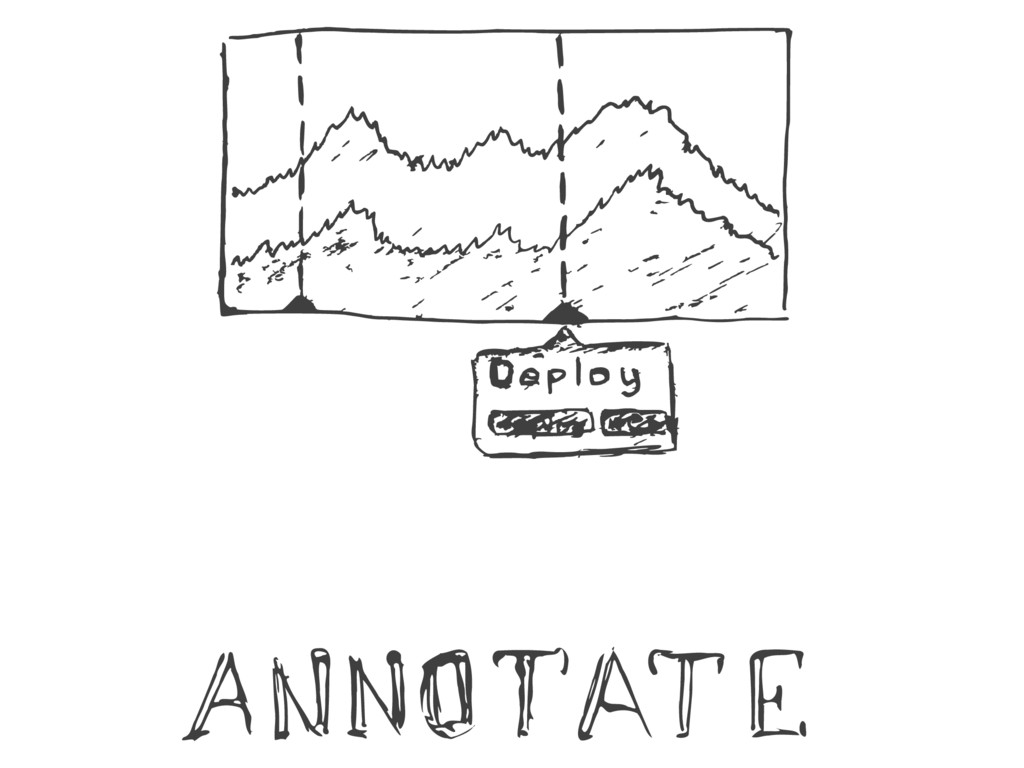
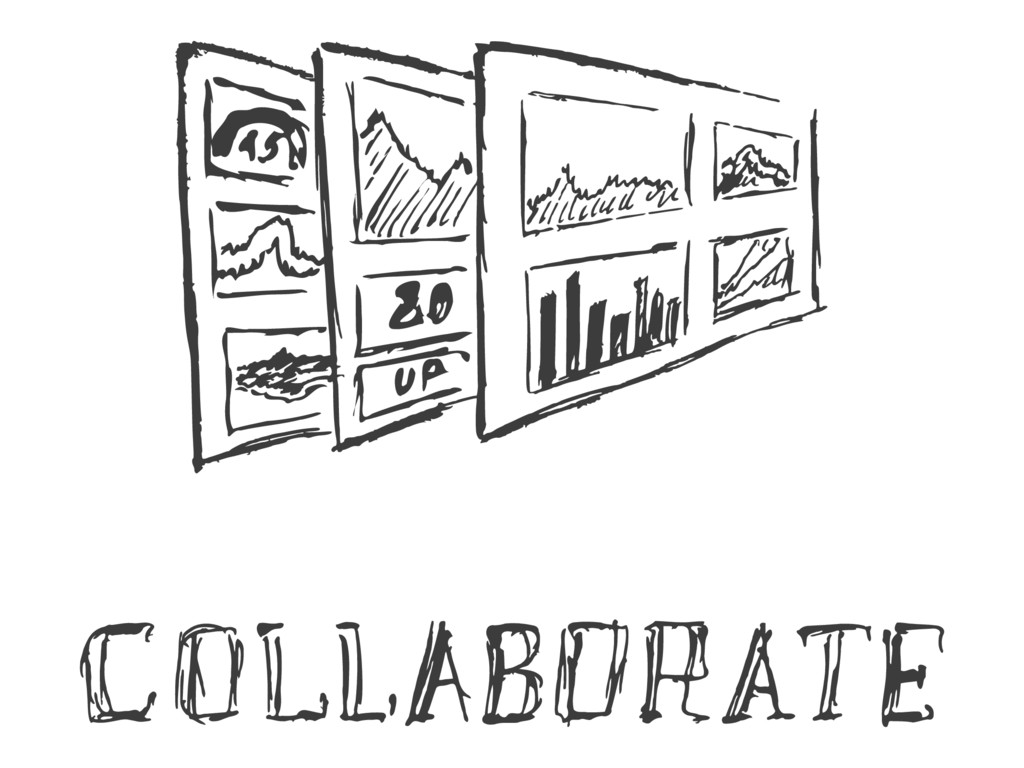
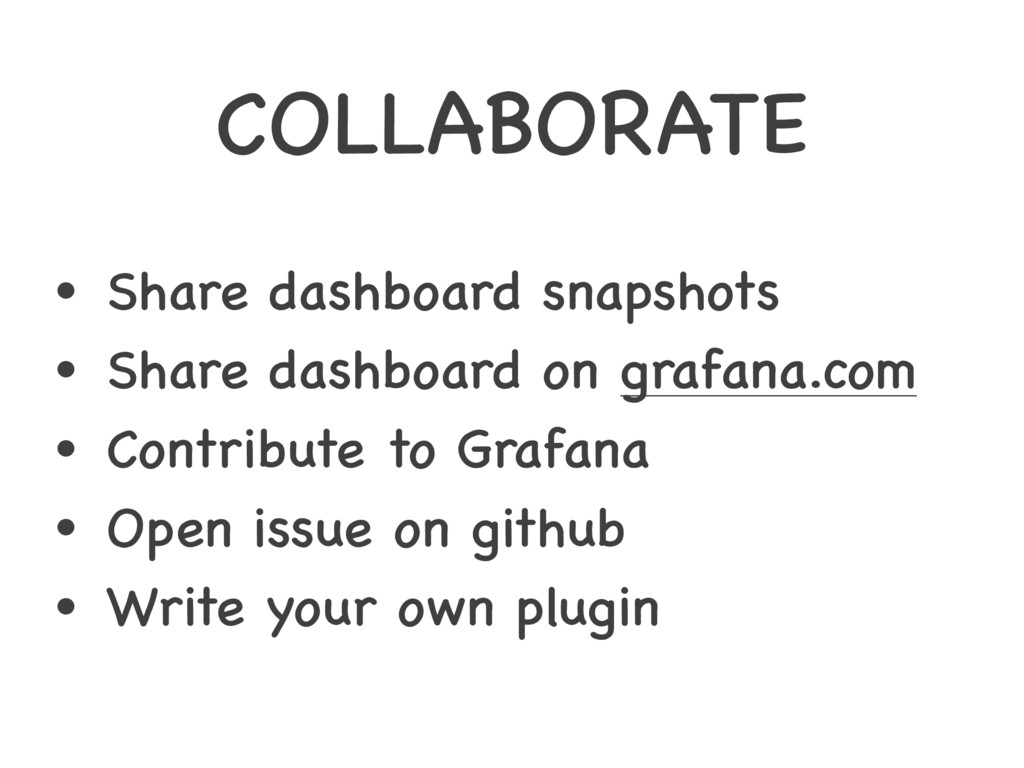
COLLABORATE • Share dashboard snapshots • Share dashboard on grafana.com
• Contribute to Grafana • Open issue on github • Write your own plugin
None
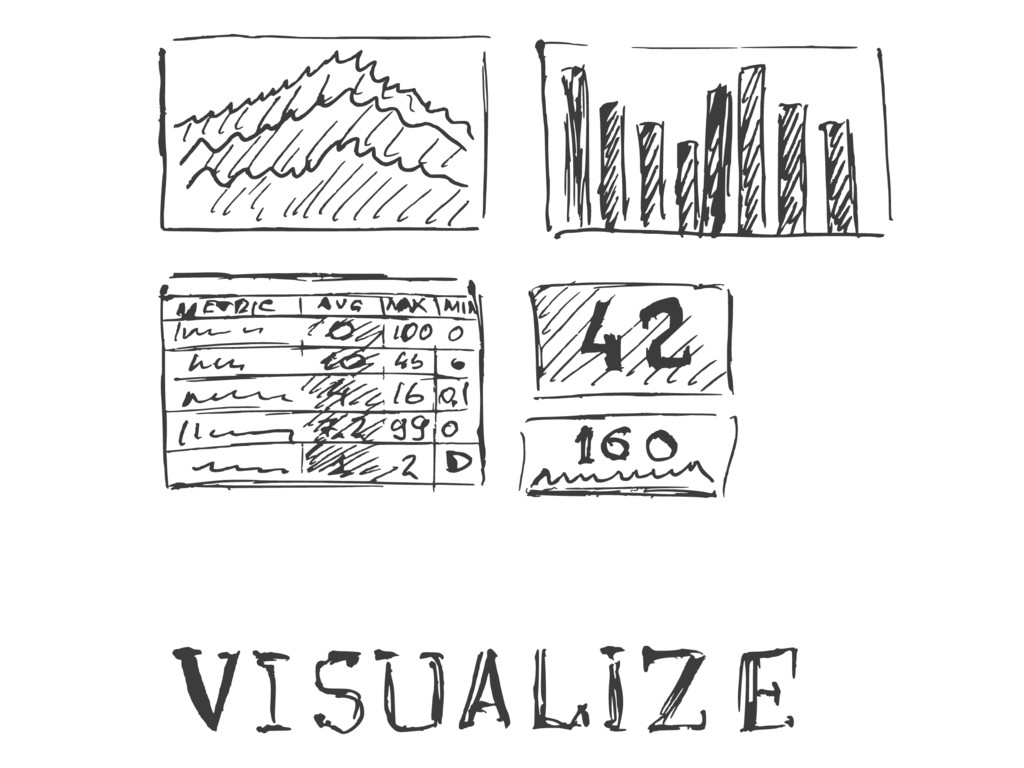
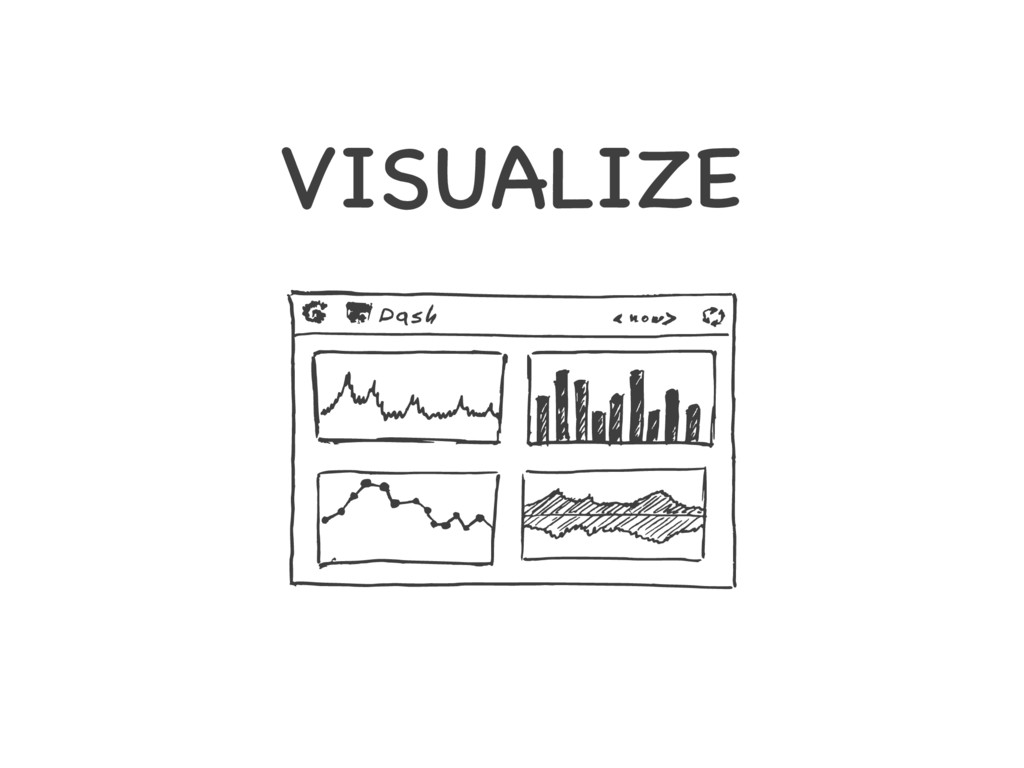
VISUALIZE
None
None
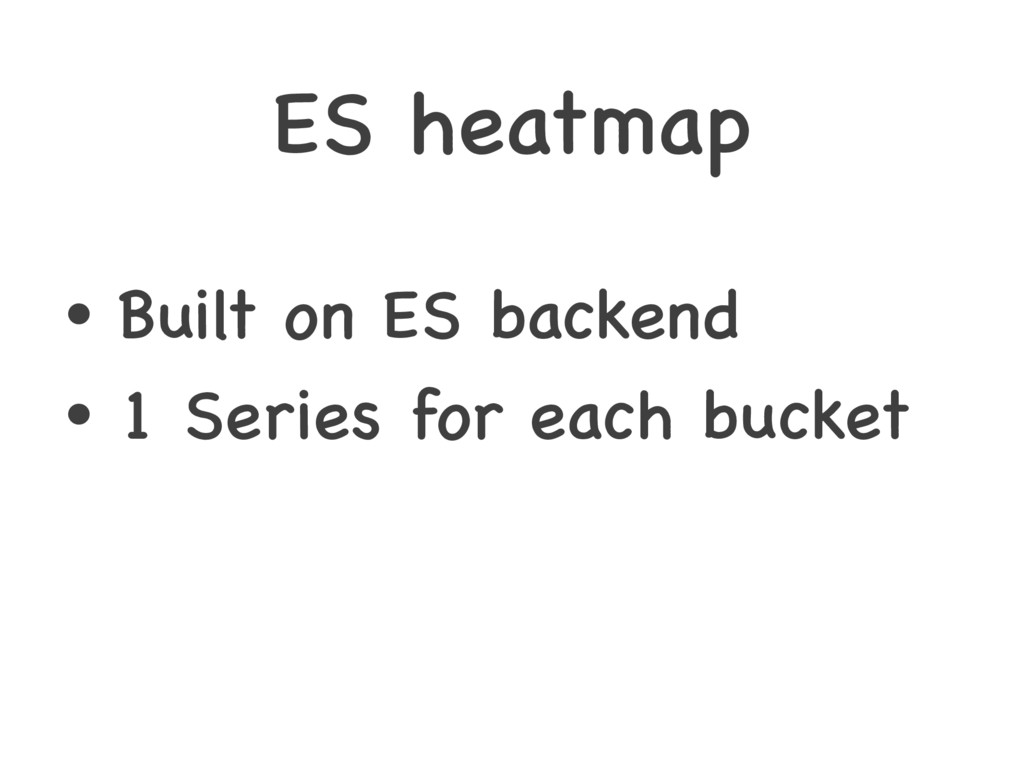
ES heatmap • Built on ES backend • 1 Series
for each bucket
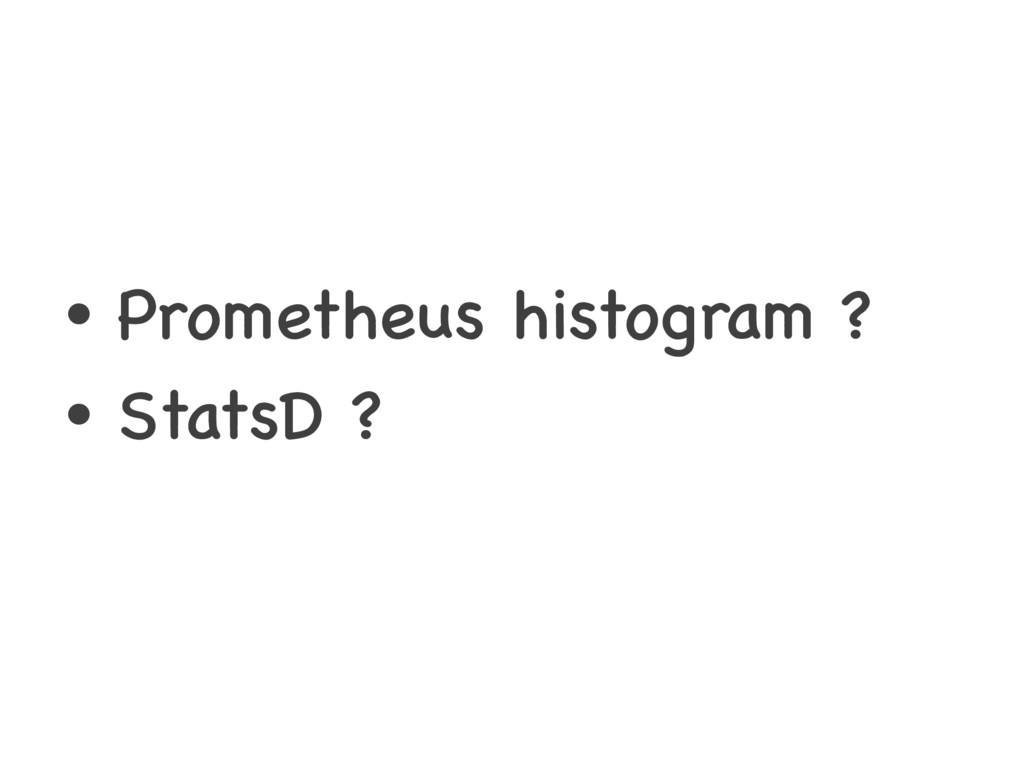
• Prometheus histogram ? • StatsD ?
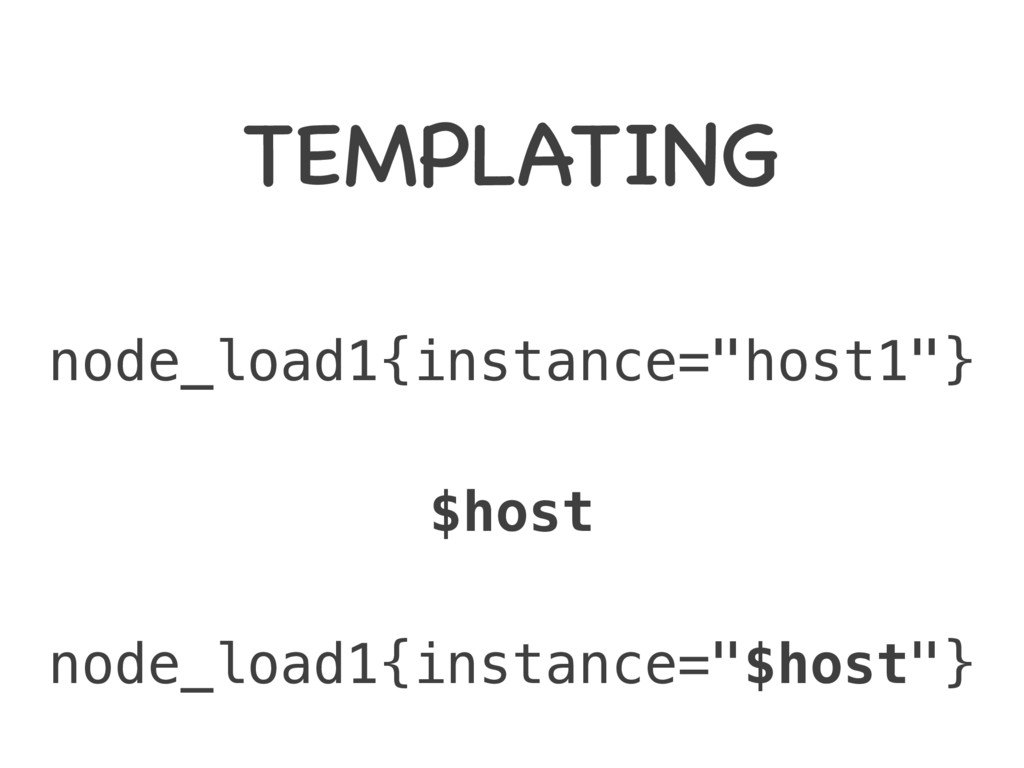
TEMPLATING
TEMPLATING node_load1{instance="host1"} node_load1{instance="$host"} $host
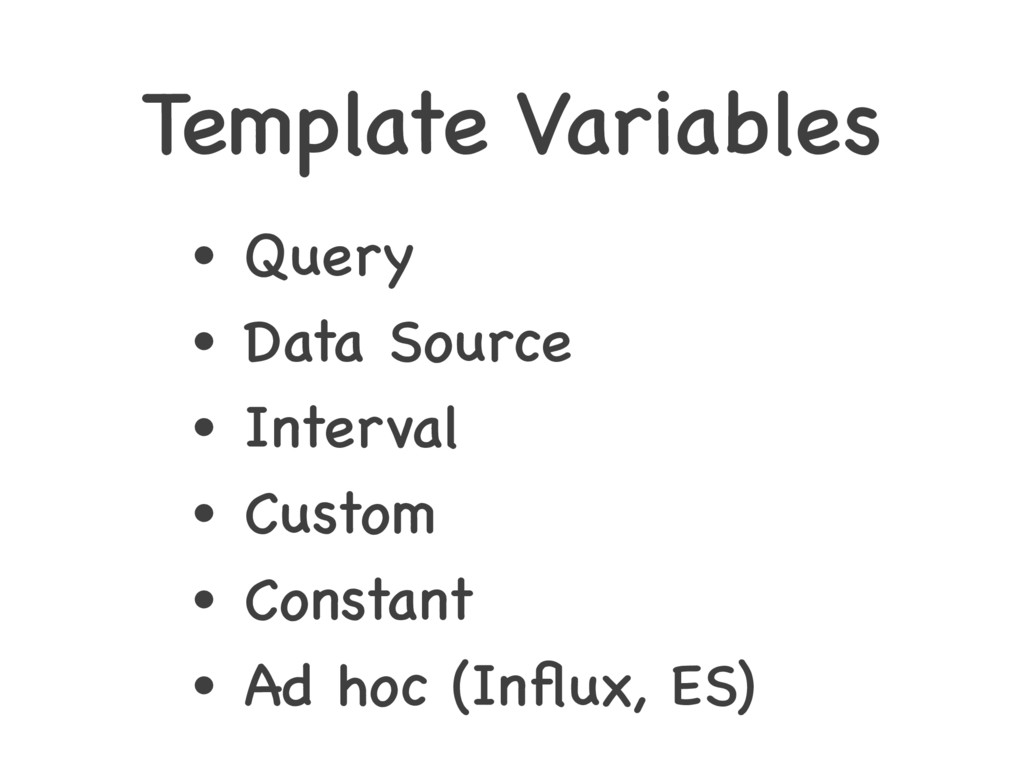
Template Variables • Query • Data Source • Interval •
Custom • Constant • Ad hoc (Influx, ES)
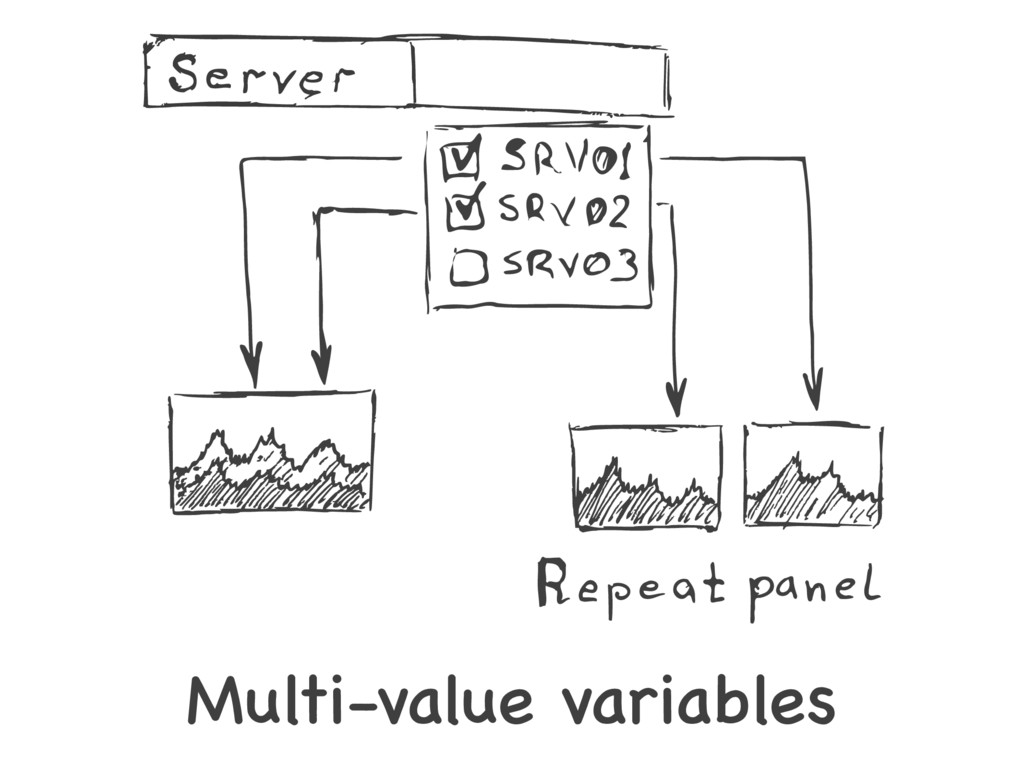
Multi-value variables
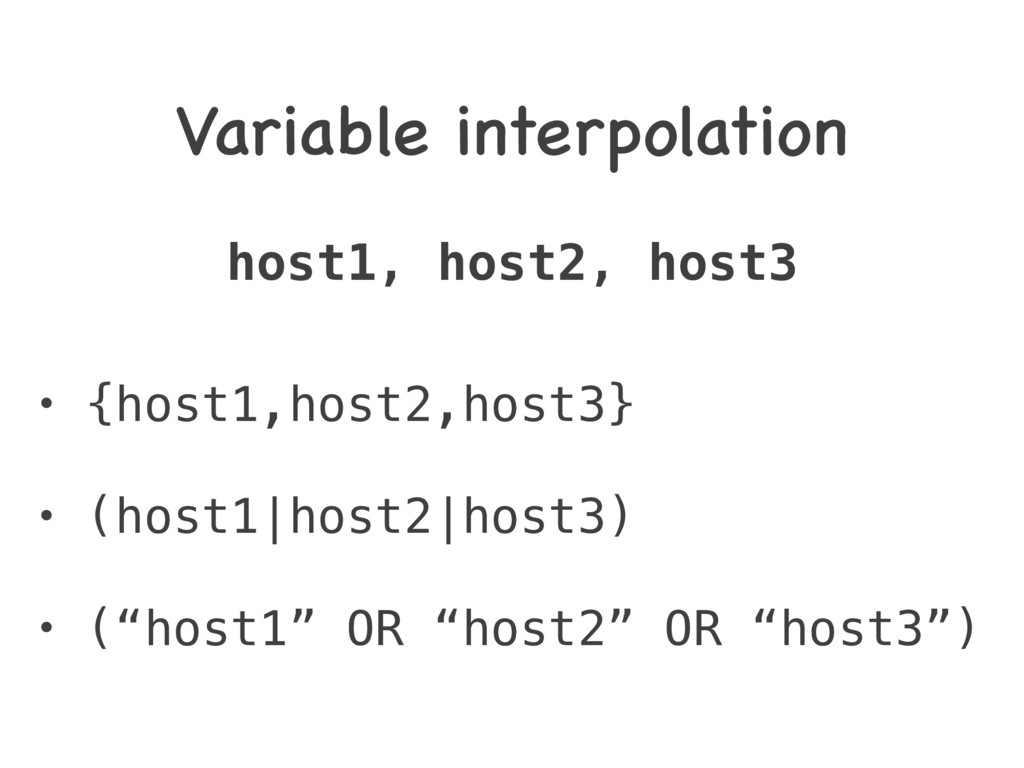
Variable interpolation host1, host2, host3 • {host1,host2,host3} • (host1|host2|host3) •
(“host1” OR “host2” OR “host3”)
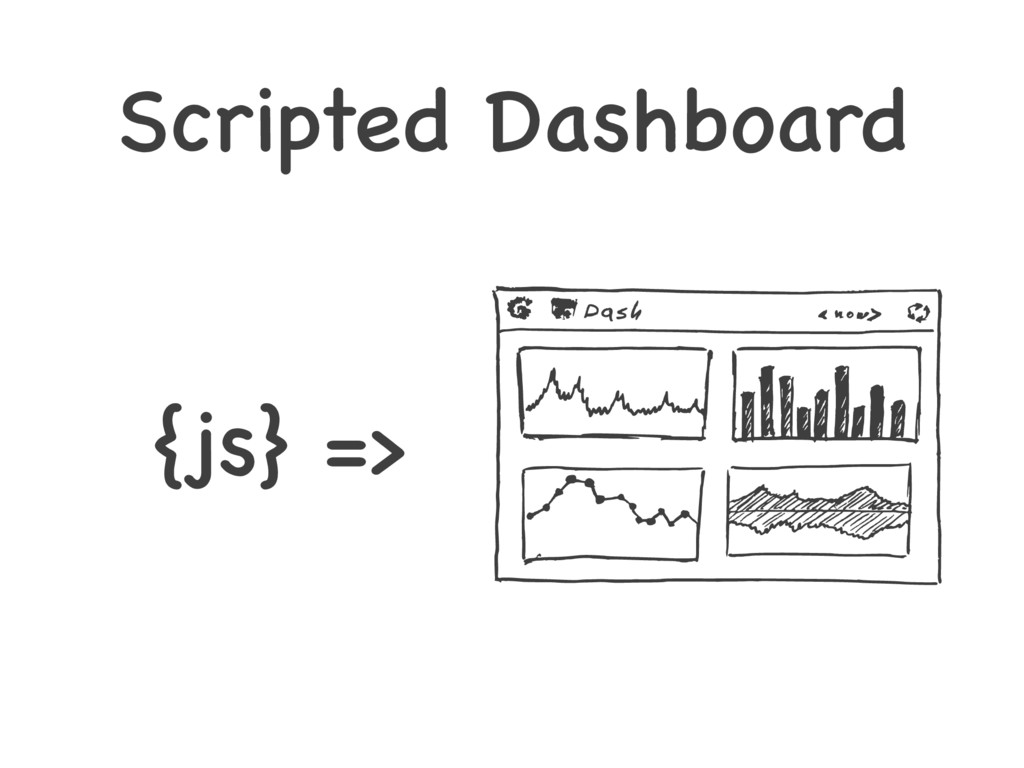
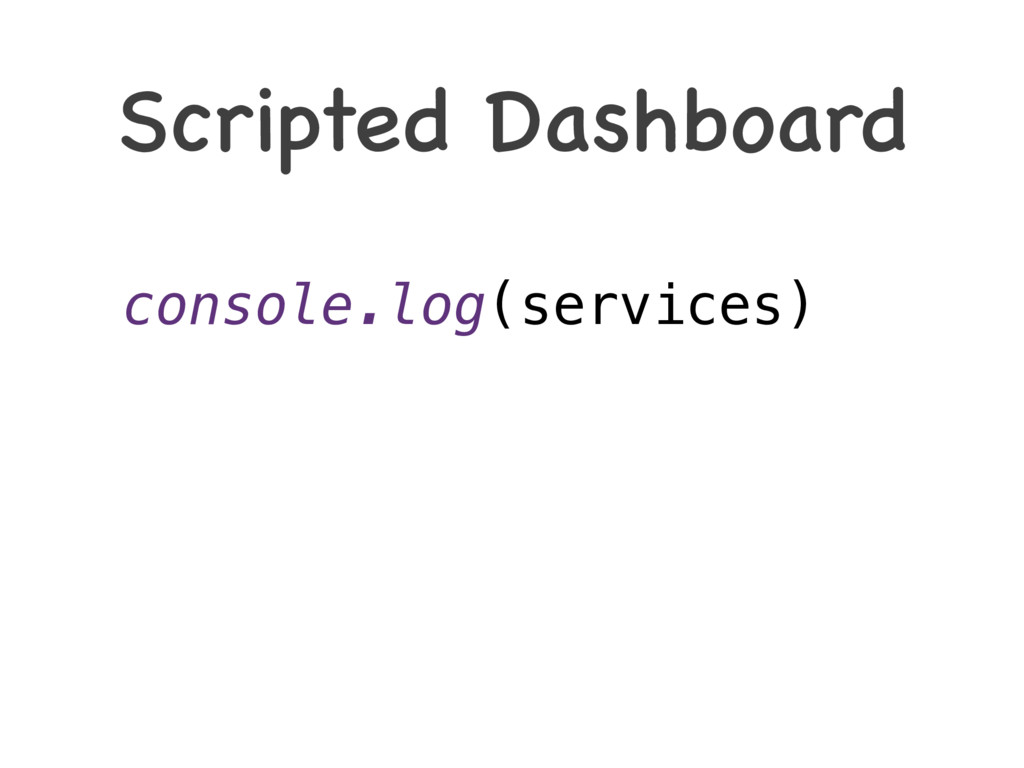
Scripted Dashboard {js} =>
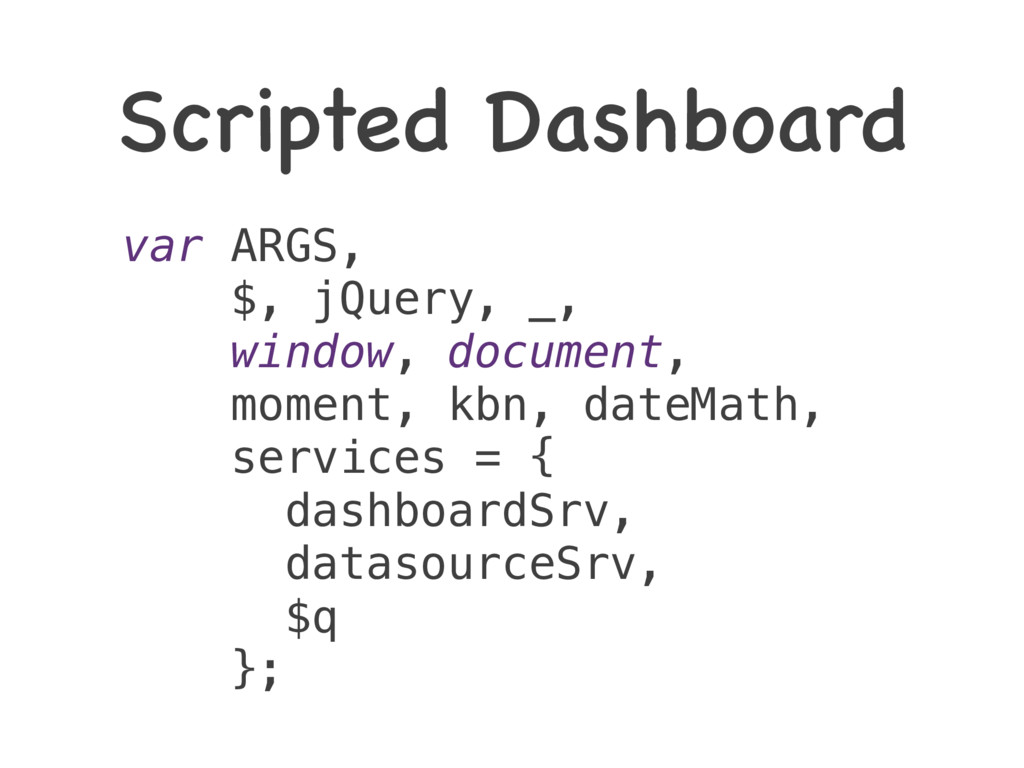
Scripted Dashboard var ARGS, $, jQuery, _, window, document, moment,
kbn, dateMath, services = { dashboardSrv, datasourceSrv, $q };
Scripted Dashboard console.log(services)
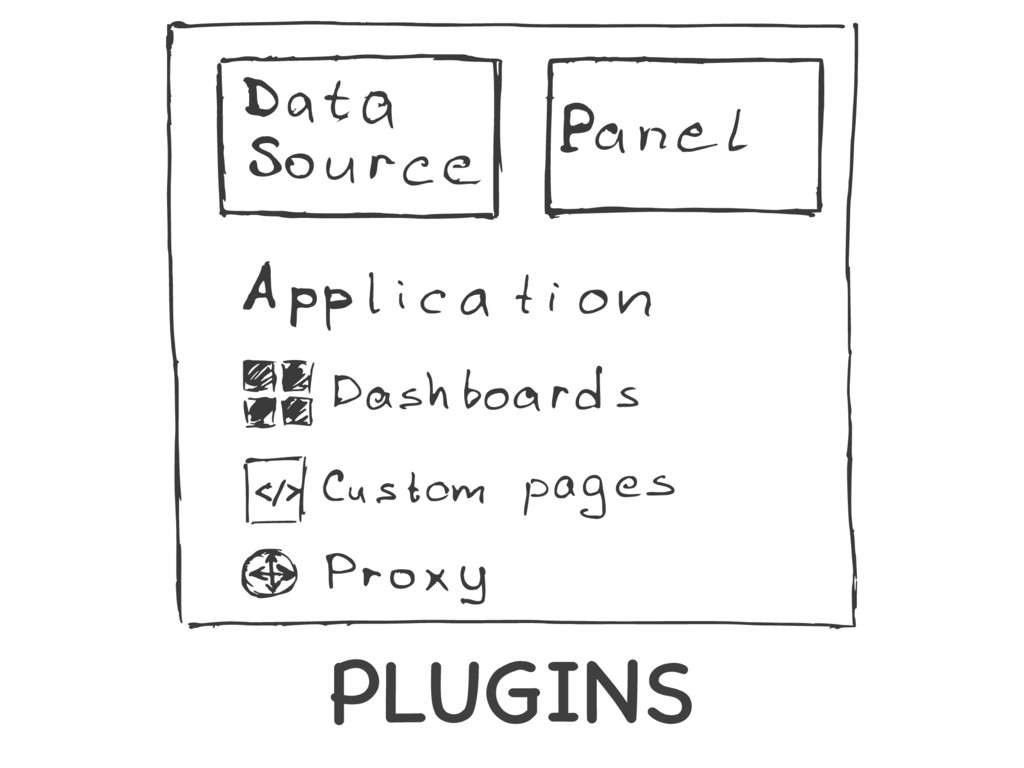
PLUGINS
PLUGINS
DS Plugin
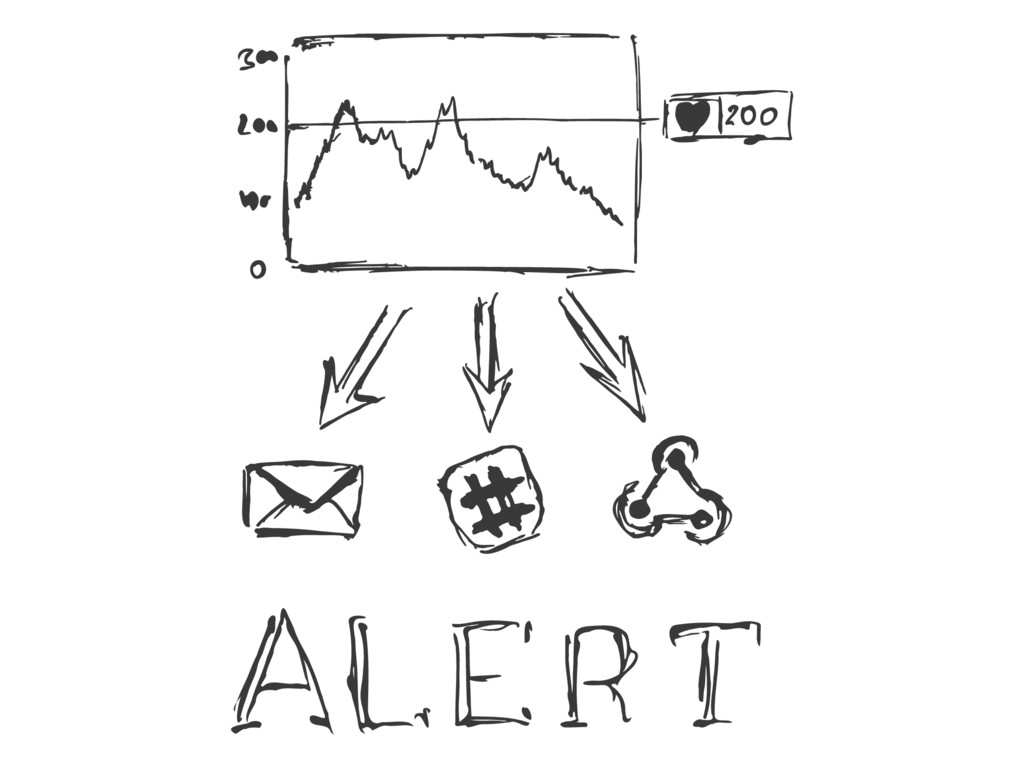
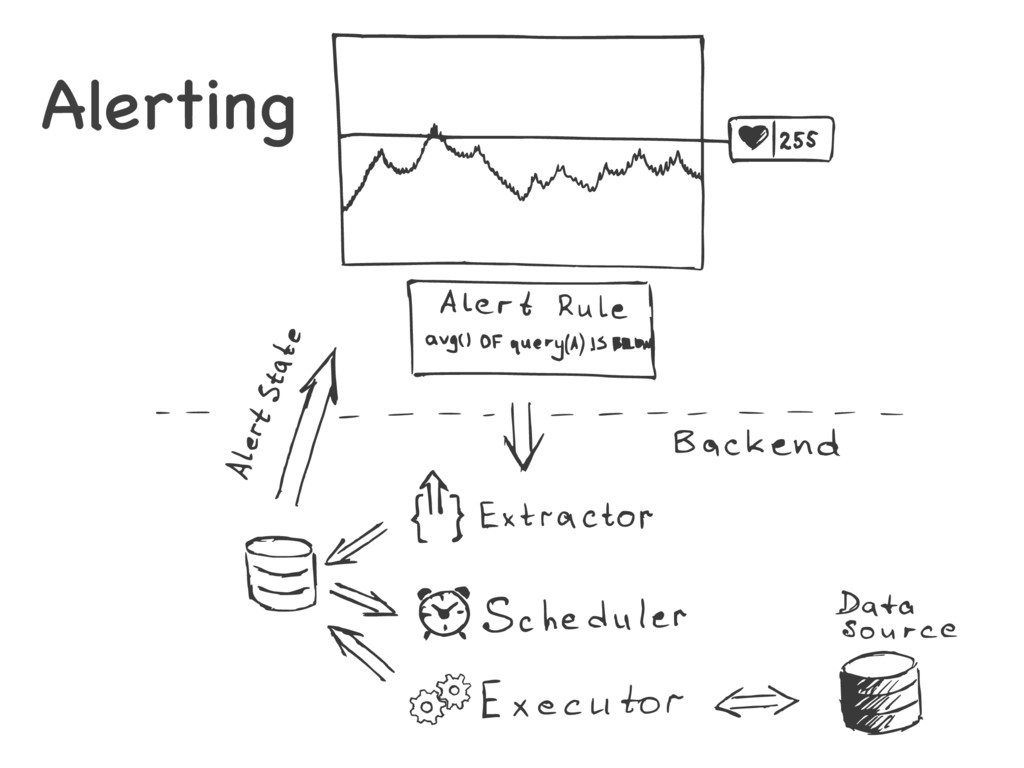
ALERTING
Alerting
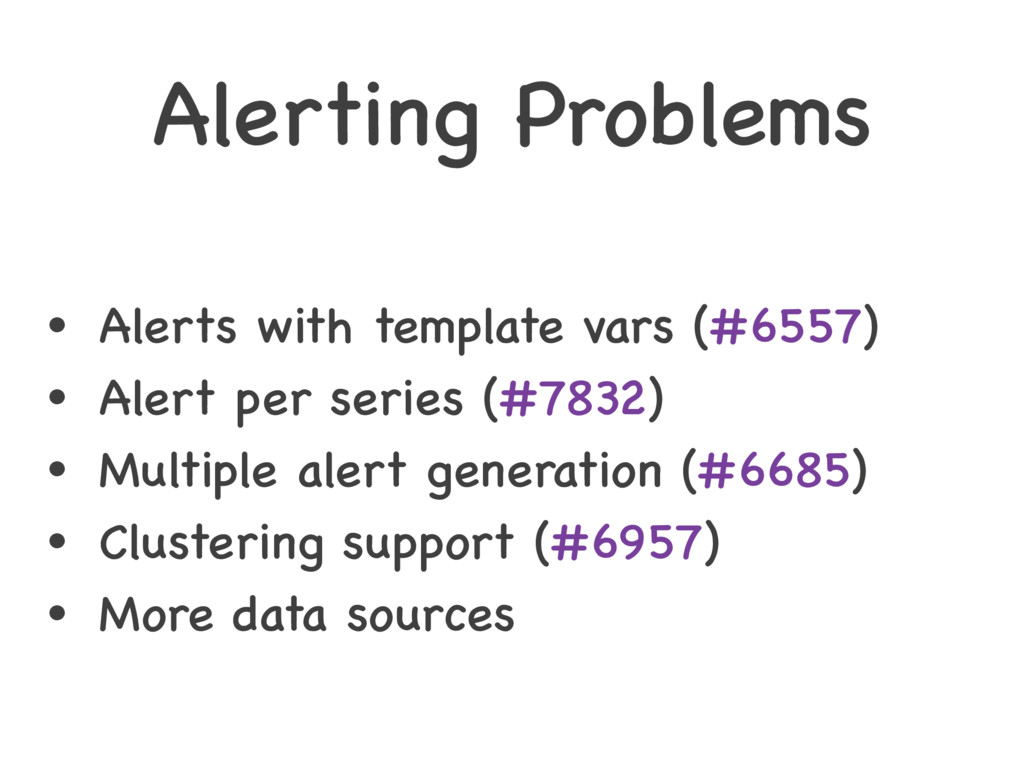
Alerting Problems • Alerts with template vars (#6557) • Alert
per series (#7832) • Multiple alert generation (#6685) • Clustering support (#6957) • More data sources
COLLABORATE
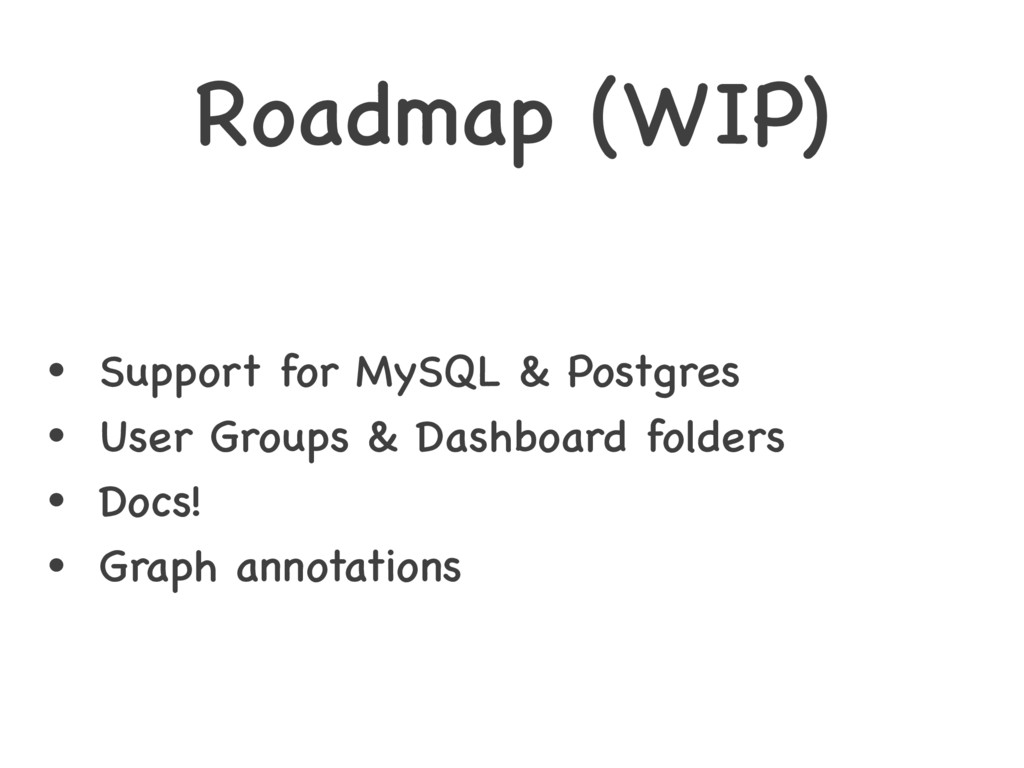
Roadmap (WIP) • Support for MySQL & Postgres • User
Groups & Dashboard folders • Docs! • Graph annotations
Roadmap • Improved panel layout • Backend plugins • Time
series transformations • Reporting • Web socket & live data streams • Migrate to Angular2
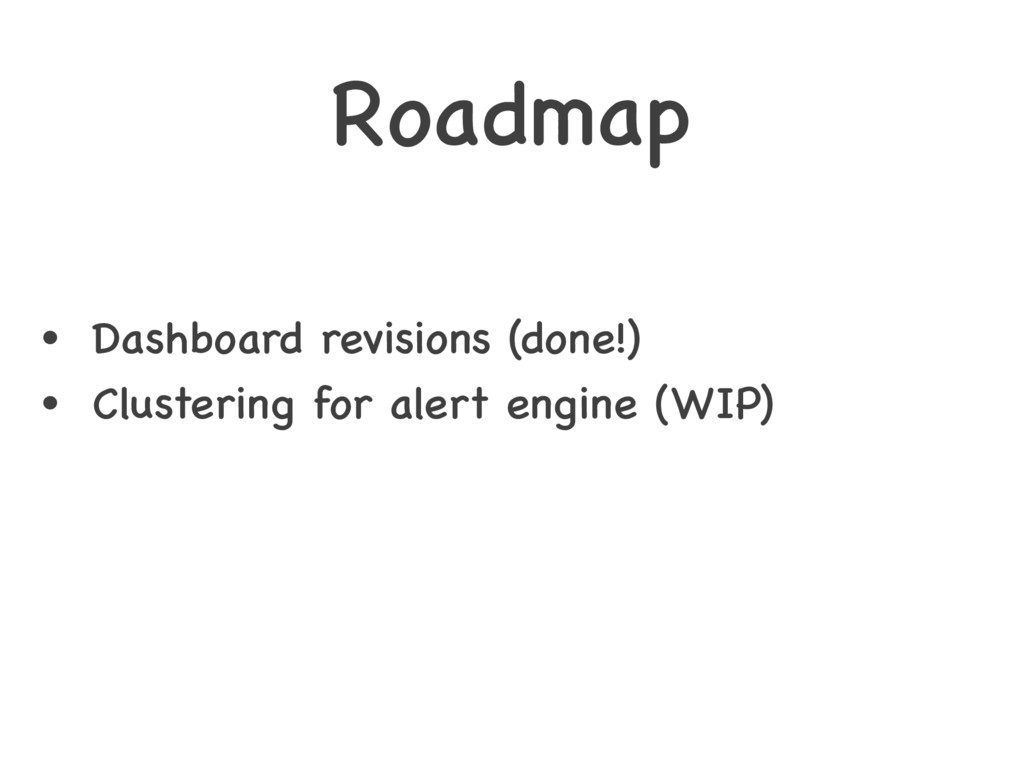
Roadmap • Dashboard revisions (done!) • Clustering for alert engine
(WIP)
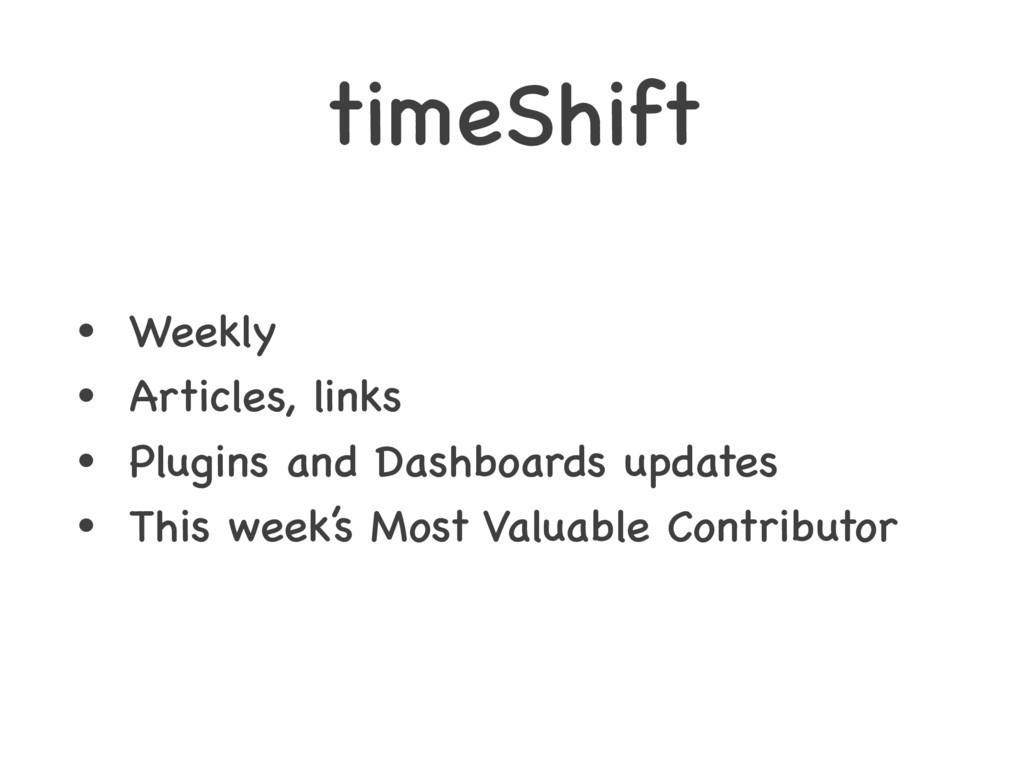
timeShift • Weekly • Articles, links • Plugins and Dashboards
updates • This week’s Most Valuable Contributor
Александр Зобнин
[email protected]
github.com/alexanderzobnin grafana.com
![Александр Зобнин [email protected] github.com/alexanderzobnin grafana.com](https://files.speakerdeck.com/presentations/9a77a49625de455abff0b4fa2c241d76/slide_41.jpg)