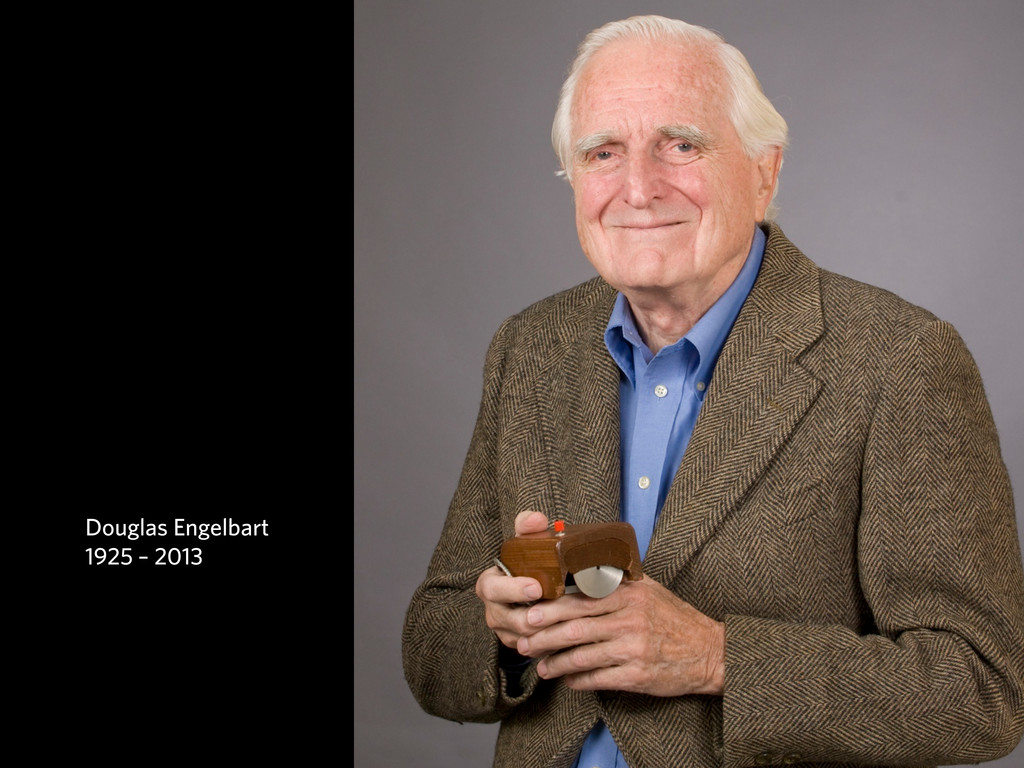
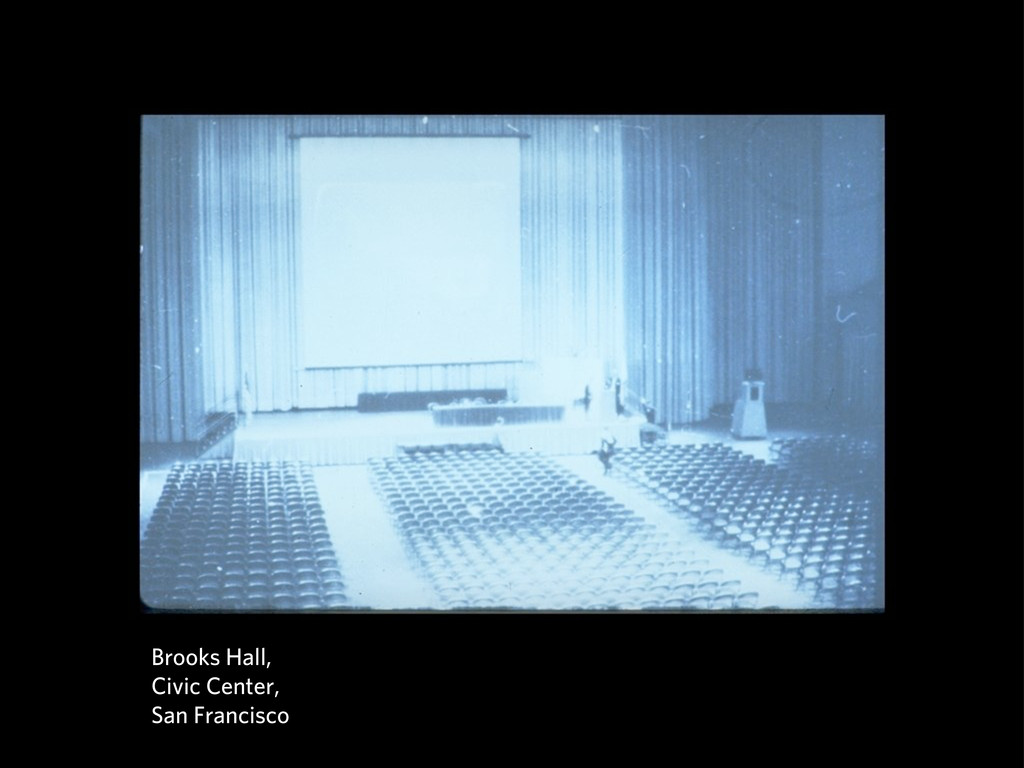
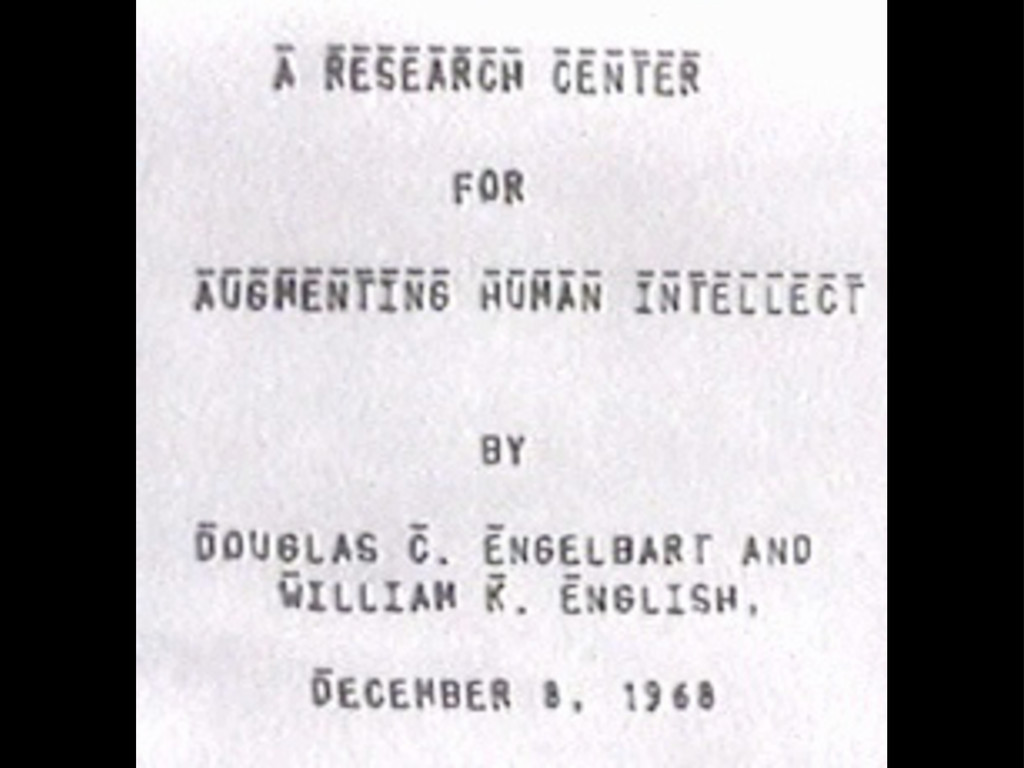
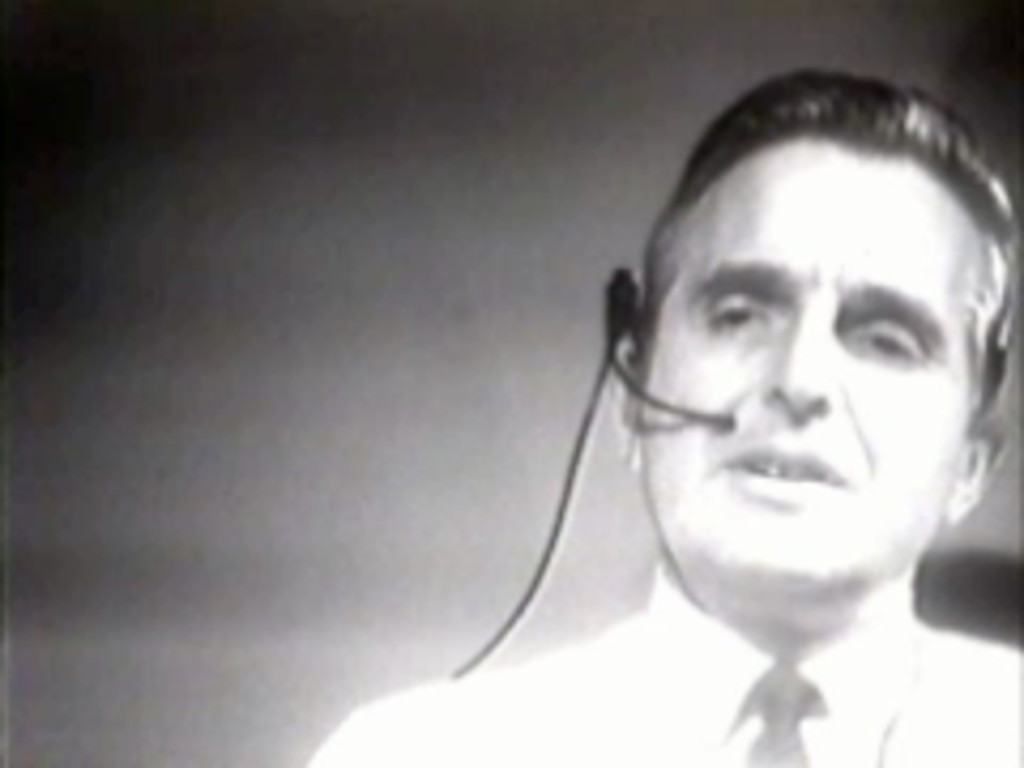
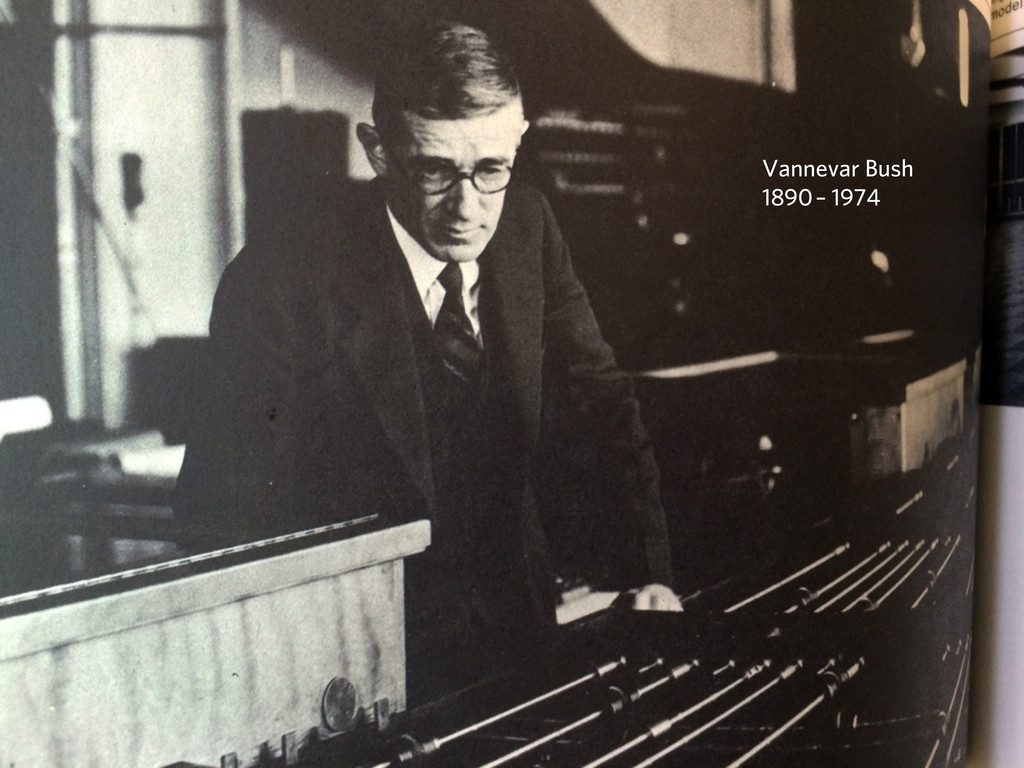
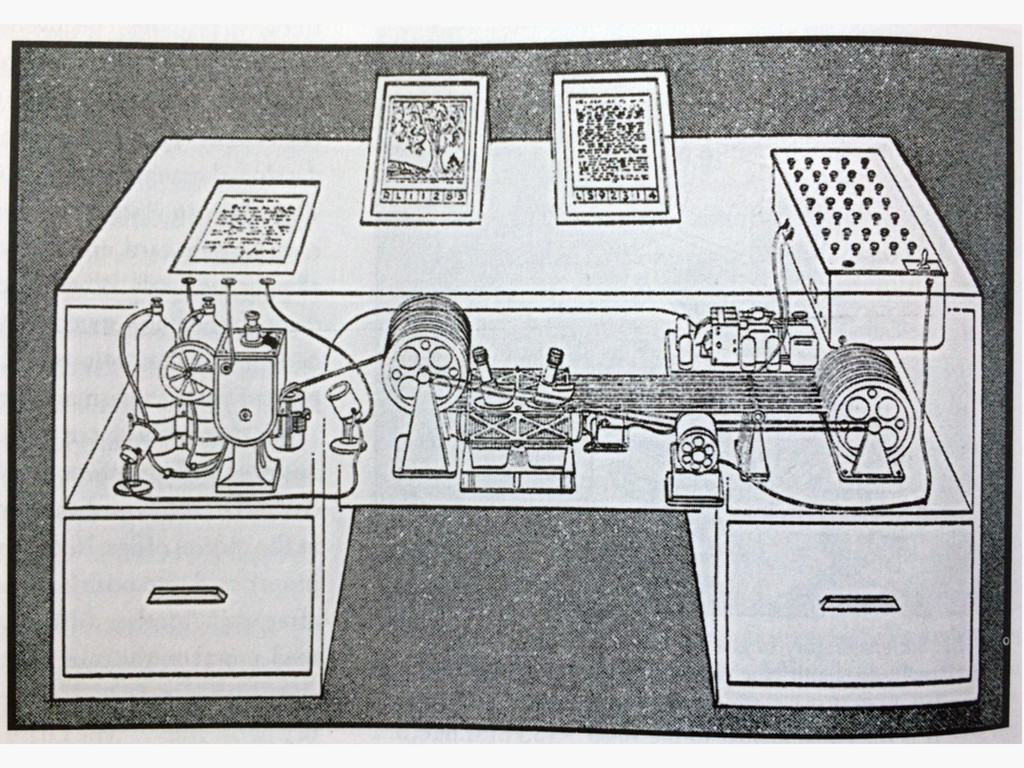
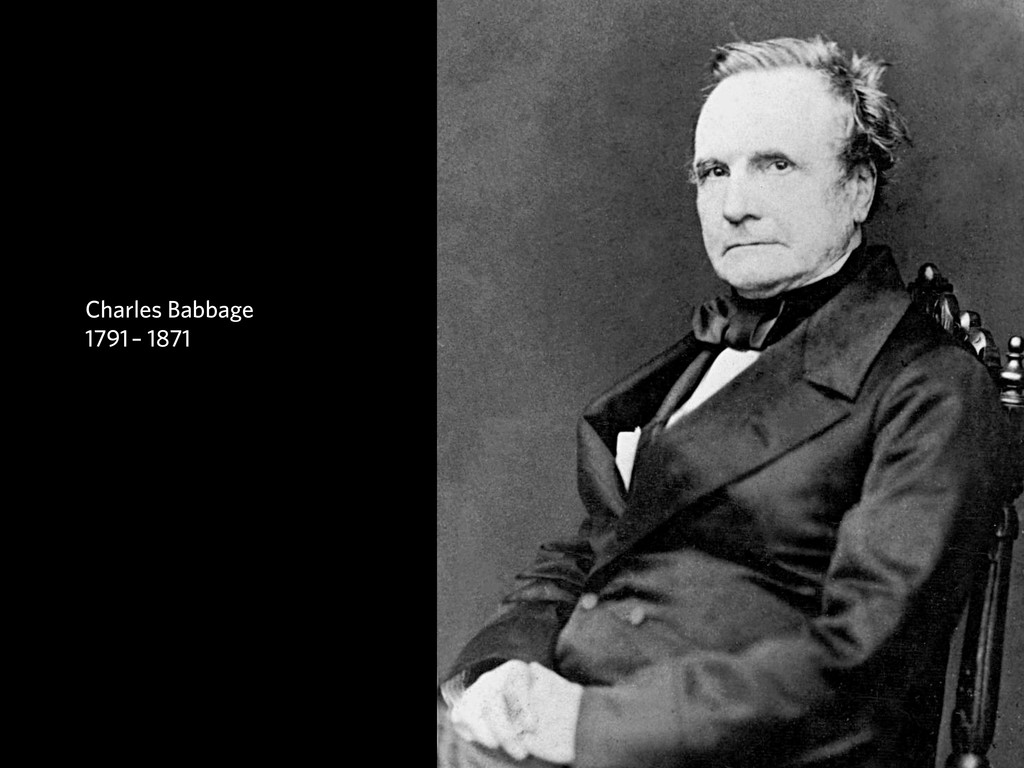
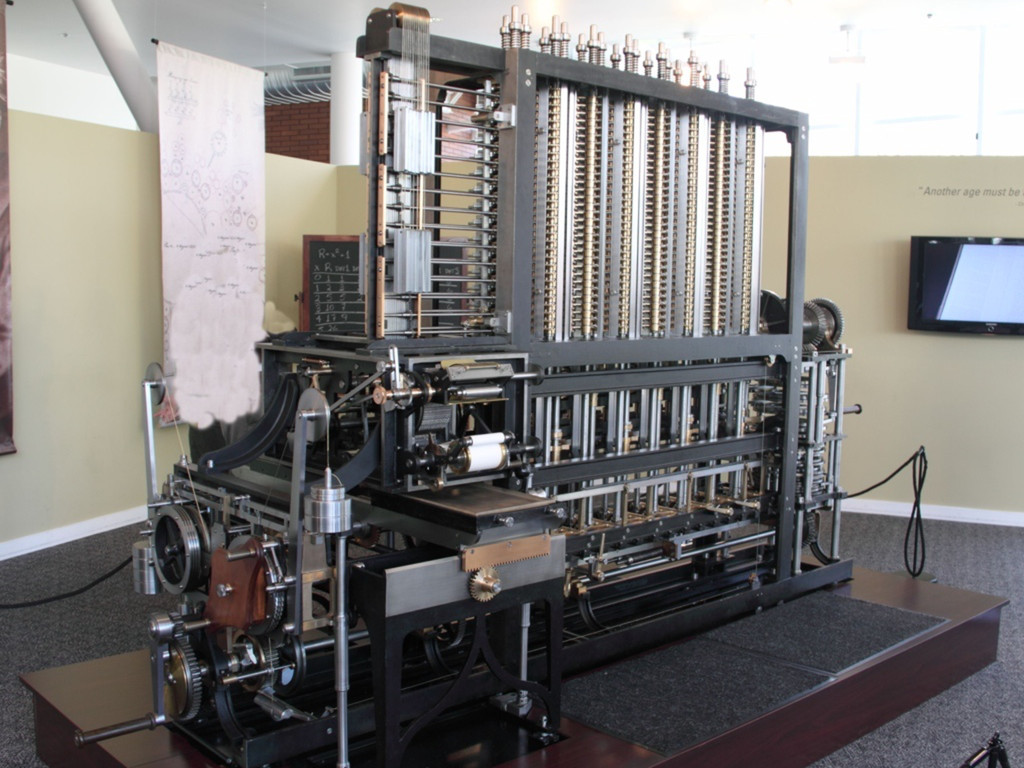
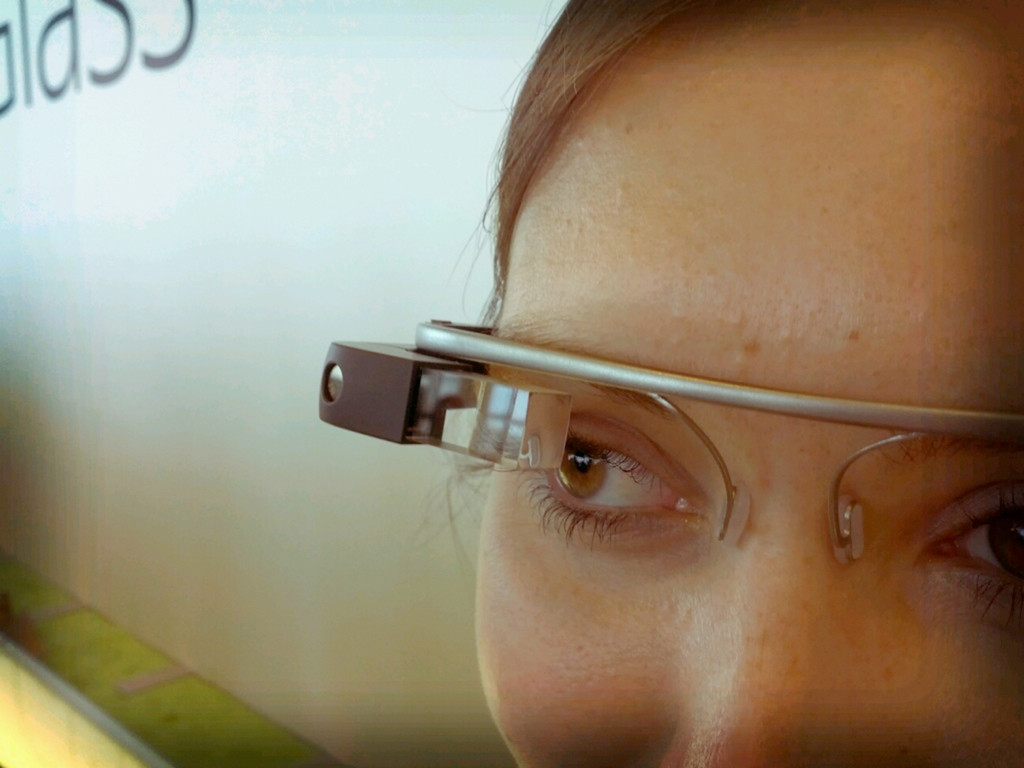
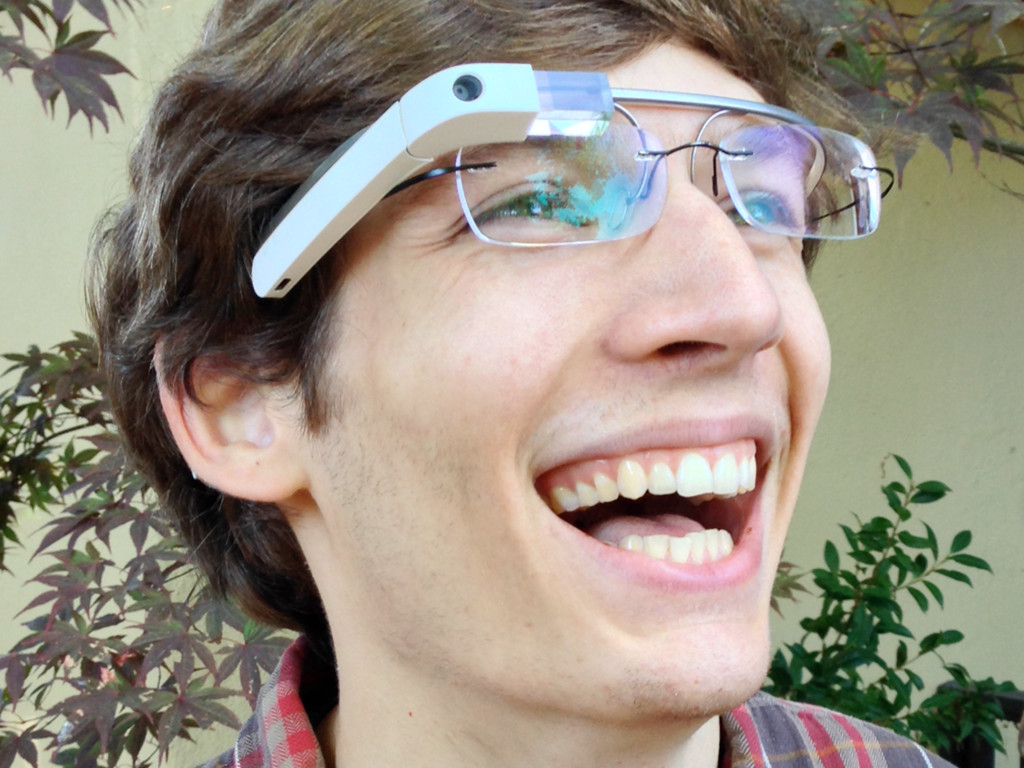
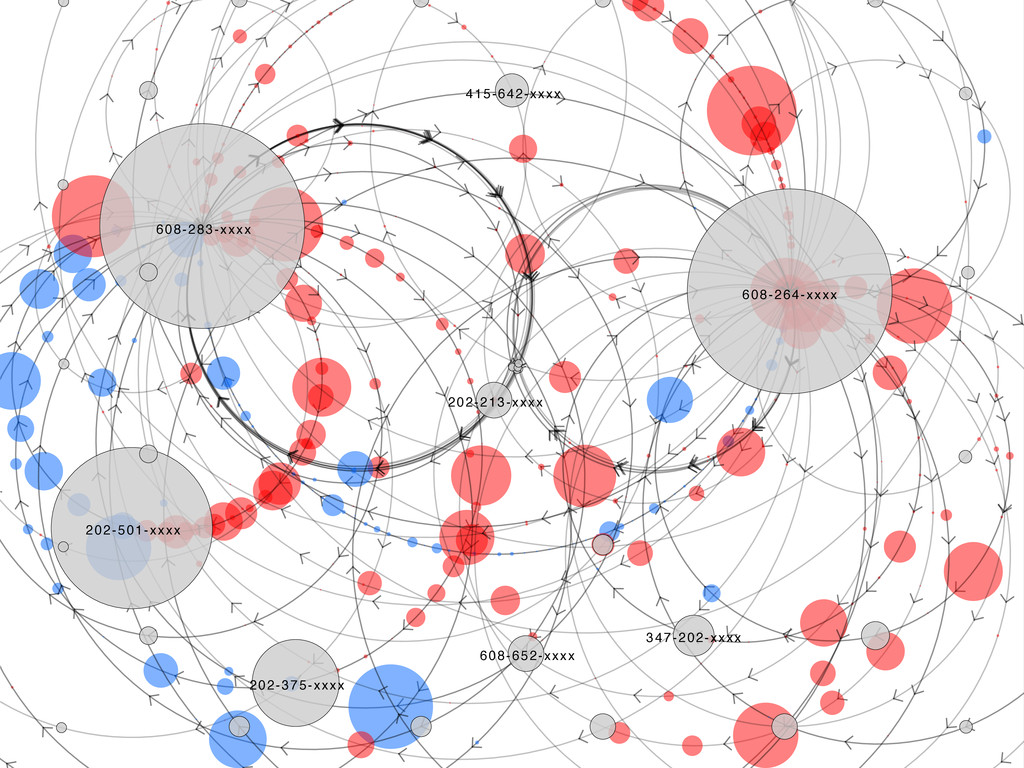
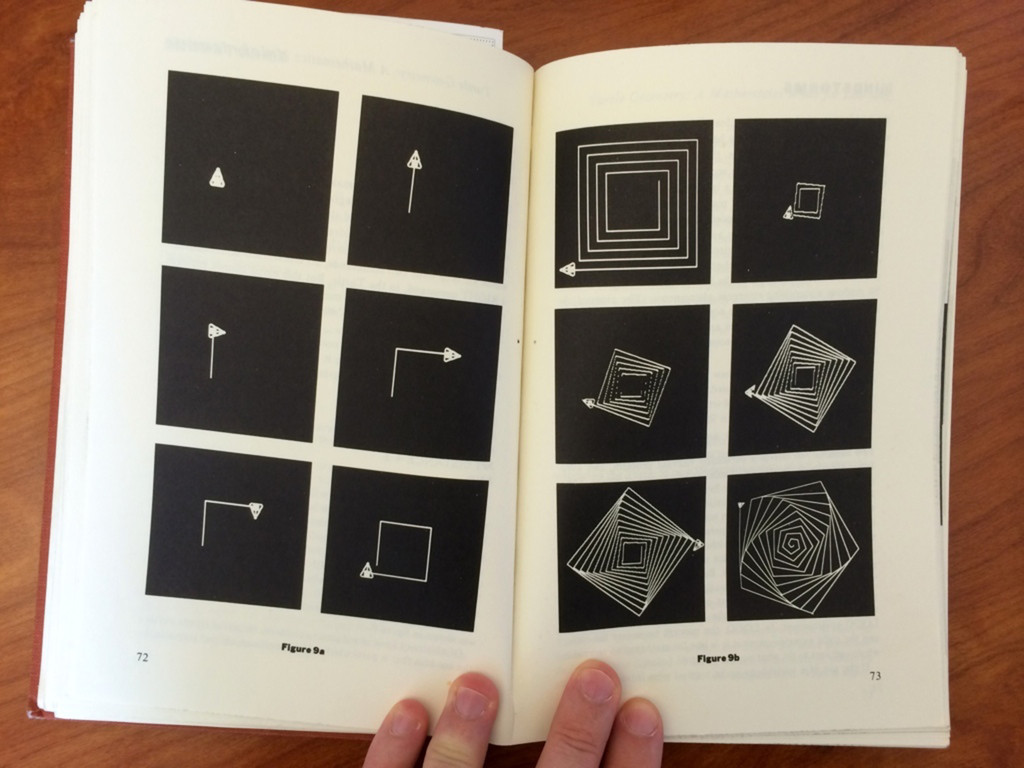
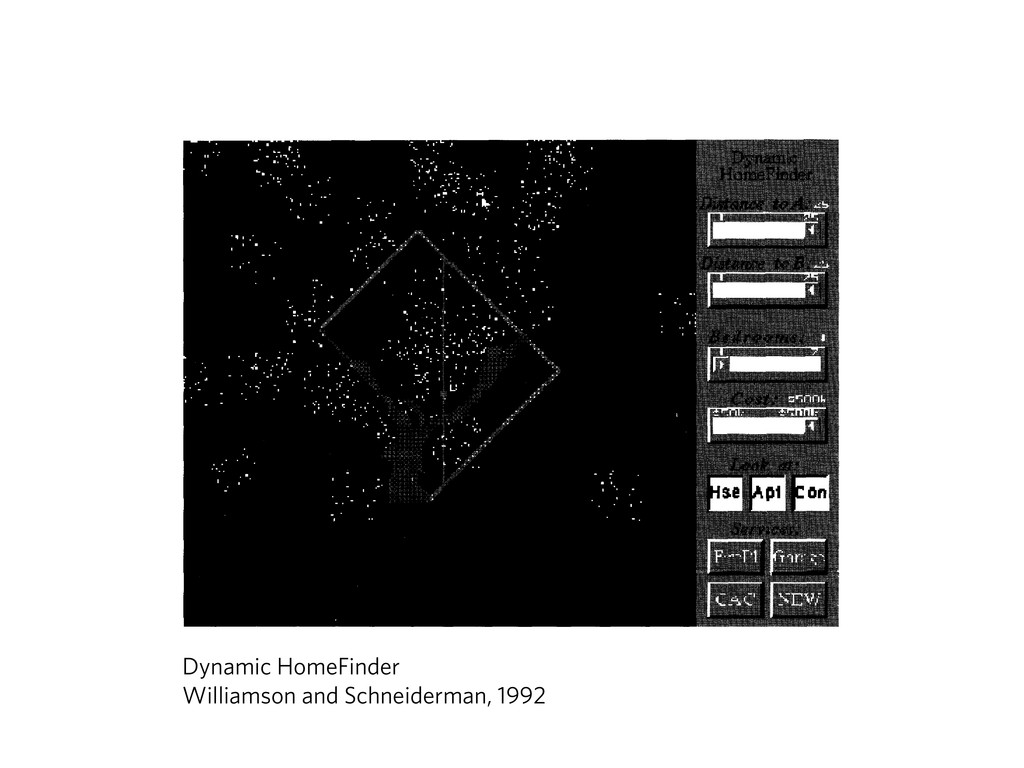
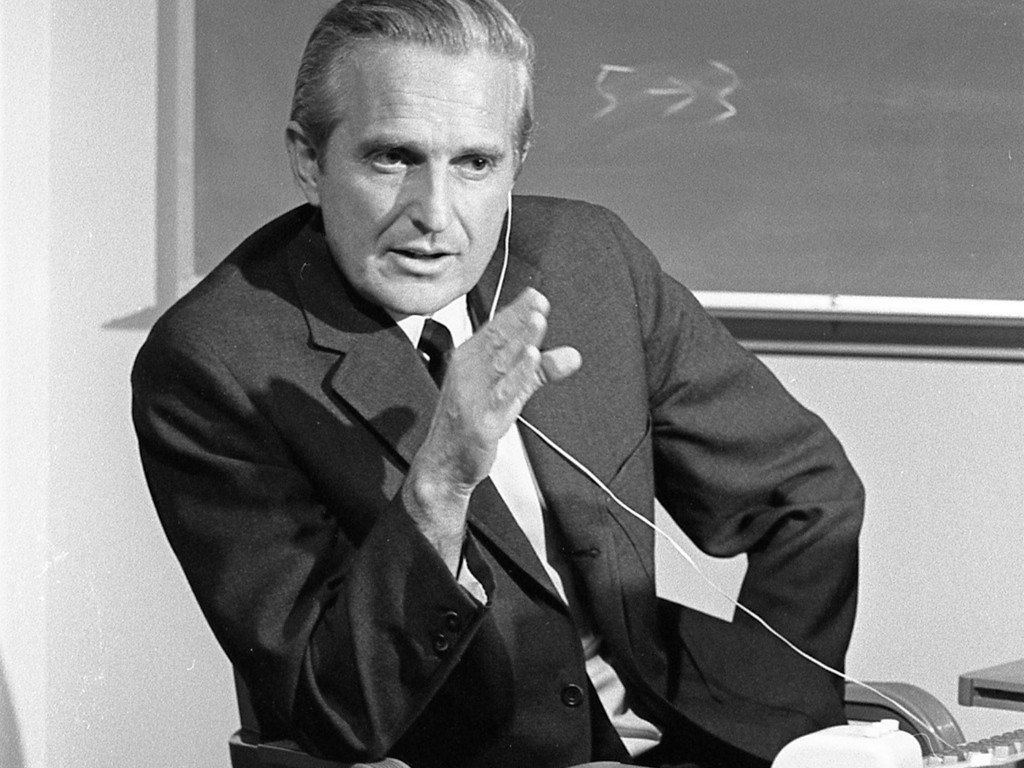
Bolt, Beranek and Newman. Burlington, MA, January 4, 1978. Photo of Douglas Engelbart from SRI, http://www.sri.com/ newsroom/press-releases/douglas-engelbart-passed-away- july-2-2013 AFIPS CONFERENCE PROCEEDINGS VOLUME 33 PART ONE 1968 FALL JOINT COMPUTER CONFERENCE THE THOMPSON BOOK COMPANY National Press Building Washington, D.C. 2 0 0 0 4 December 9-11, 1968 San Francisco, California AFIPS Conference Proceedings, 1968, http://portalparts.acm.org/ 1480000/1476589/fm/frontmatter.pdf#page=5pagemode=thumbs “San Francisco's Brooks Hall all set for the 1968 Fall Joint Computer Conference,” 1968, provided by the Doug Engelbart Institute, http:// www.dougengelbart.org/history/pix.html#FJCC-1968 Still images from video recording of Engelbart’s presentation “A Research Center for Augmenting Human Intellect,” 1968, provided by the Doug Engelbart Institute, http://www.dougengelbart.org/firsts/ dougs-1968-demo.html Video recording of Engelbart’s presentation “A Research Center for Augmenting Human Intellect,” 1968, provided by the Doug Engelbart Institute, http://www.dougengelbart.org/firsts/dougs-1968- demo.html Photo of Vannevar Bush, originally from Pieces of the Action (New York, William Morrow, 1970, p. 161) by Vannevar Bush. Reproduced and photographed from A Computer Perspective (Harvard Univ. Press, Cambridge, 1990 ed., p. 113) by the office of Charles and Ray Eames. Photo originally from “As We May Think” (Life, September 1945, p. 112–124) by Vannevar Bush. Reproduced and photographed from The New Media Reader (MIT Press, Cambridge, 2003, p. 113), Noah Wardrip-Fruin and Nick Montfort, eds. Photo originally from “As We May Think” (Life, September 1945, p. 112–124) by Vannevar Bush. Reproduced and photographed from The New Media Reader (MIT Press, Cambridge, 2003, p. 113), Noah Wardrip-Fruin and Nick Montfort, eds. Photo of Charles Babbage, 1860, photographer unknown, http:// commons.wikimedia.org/wiki/File:Charles_Babbage_-_1860.jpg Photo of the Babbage Difference Engine, 2009, Allan J. Cronin, http://commons.wikimedia.org/wiki/File:Difference_engine.JPG “Instagram and Other Social Media Apps,” 2012, Jason A. Howie, http://www.flickr.com/photos/jasonahowie/7910370882/sizes/l/ “A Google Glass Wearer,” 2013, Loic Le Meur, http:// commons.wikimedia.org/wiki/File:A_Google_Glass_wearer.jpg “Google Glass Detail,” 2012, Antonio Zugaldia, http:// commons.wikimedia.org/wiki/File:Google_Glass_detail.jpg “Stephen Balaban wearing Google Glass on July 16th, 2013,” 2013, Stephen Balaban, http://commons.wikimedia.org/wiki/ File:Stephen_Balaban_wearing_Google_Glass_on_July_16th, 2013.png 608-283-xxxx 123 608-264-xxxx 202-375-xxxx 202-501-xxxx 415-642-xxxx 608-652-xxxx 202-213-xxxx 347-202-xxxx Still image from Relationship Visualizer by Scott Murray, http:// alignedleft.com/work/relationship-visualizer Dynamic Queries 3 The dynamic queries interface (Figure 2) provides a visualization of both the query formulation and corresponding results. This application was built using the C programming language. A map of the District of Columbia area is displayed on the left. The homes that fulfill the criteria set by the user’s current query are shown as yellow dots on the map. Users perform queries, using the mouse, by setting the values of the sliders and buttons in the control panel to the right. The query result is determined by ANDing all sliders and buttons. The dynamic homefinder interface is best explained through an example. Take a hypothetical situation where a new professor, Dr. Jones, has just been hired by the Umversity of Maryland. She might encounter this tool in a touchscreen kiosk at a real-estate office or at the student union. She selects the location where she will be working by dragging the ‘A’ on the map. Next. she selects where her husband will be working. downtown, near the capitol, by dragging the ‘B’. Figure 2 shows the interface after Dr. Jones has dragged the ‘A’ and ‘B’ indicators to her desired locations (the indicators are more visible in Figure 4). 340 “The Dynamic HomeFinder: Evaluating dynamic queries in a real- estate information exploration system.” Christopher Williamson and Ben Shneiderman. ACM, 1992. Visual Thinking by Rudolf Arnheim, University of California Press, Berkeley, 1969. Mindstorms: Children, Computers, and Powerful Ideas by Seymour Papert, Basic Books, New York, 1980. Photo of Douglas Engelbart from SRI, http://www.sri.com/ newsroom/press-releases/douglas-engelbart-passed-away- july-2-2013