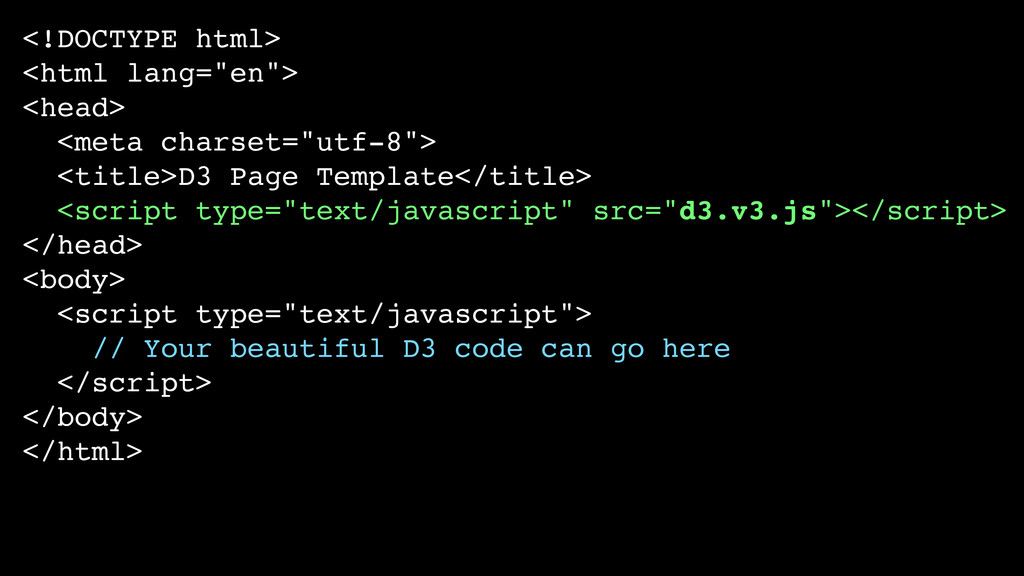
<script type="text/javascript" src="d3.v3.js"></script> </head> <body> <script type="text/javascript"> // Your beautiful D3 code can go here </script> </body> </html>
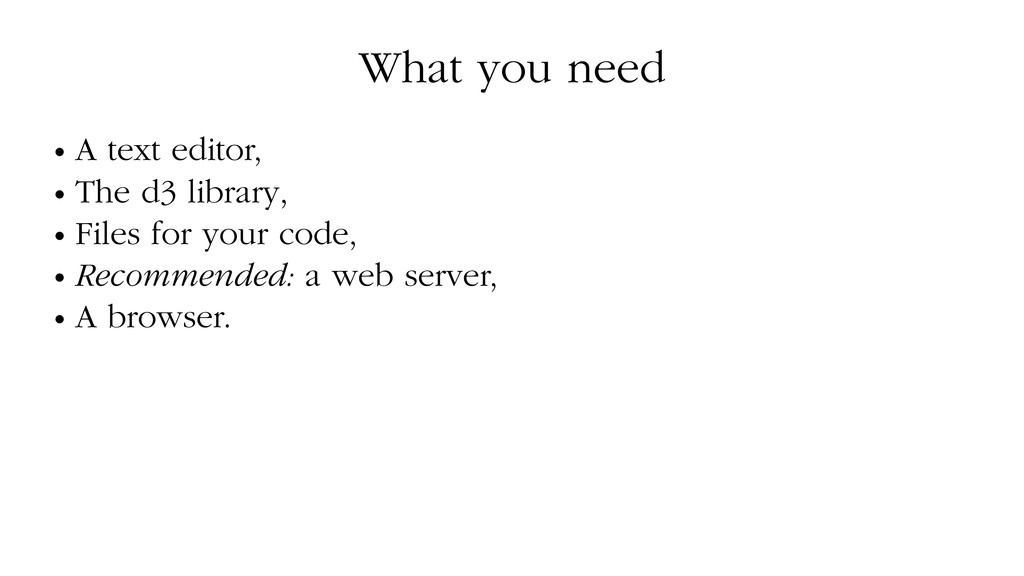
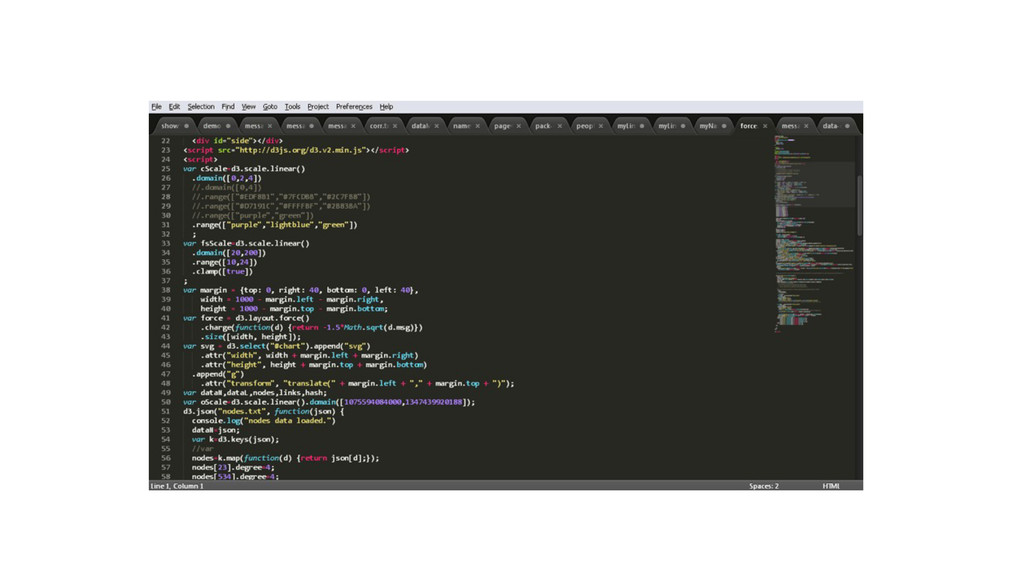
there: textMate, eclipse / aptana, sublime text 2… • What you really need is an editor with syntax highlighting. Constructs with d3 can become very intricate. • Personally, I like sublime text 2.
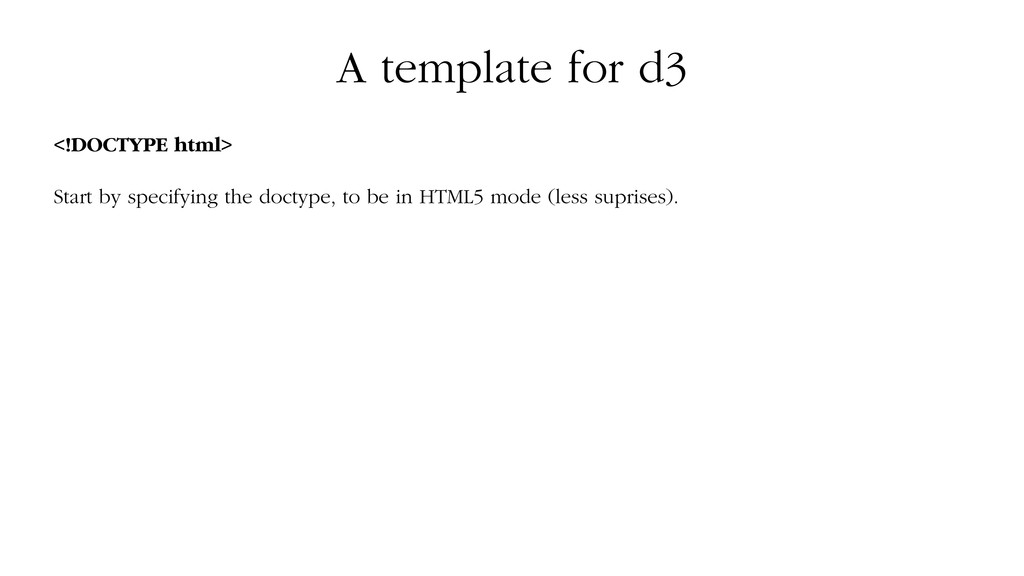
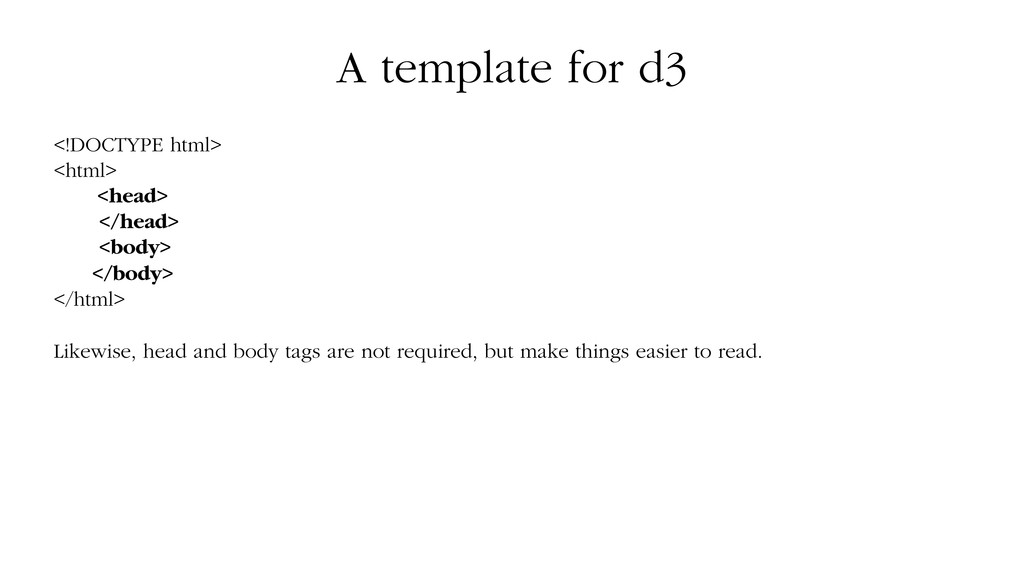
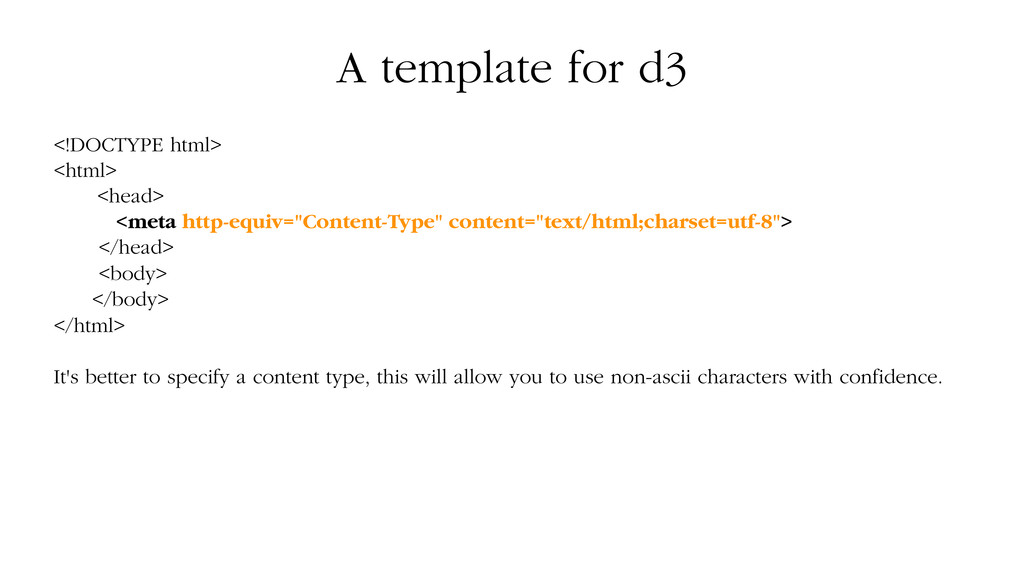
content="text/html;charset=utf-8"> </head> <body> </body> </html> It's better to specify a content type, this will allow you to use non-ascii characters with confidence.
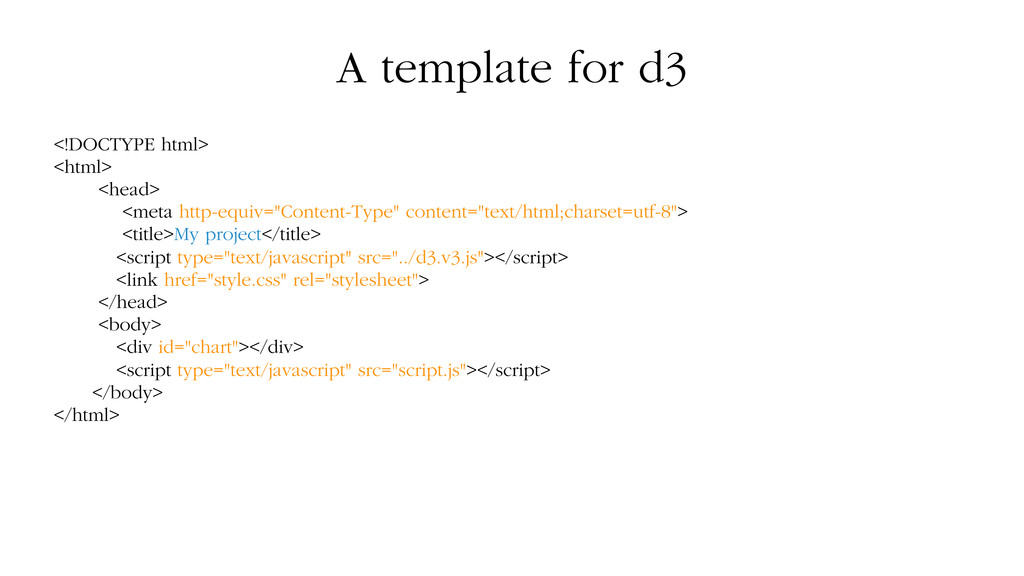
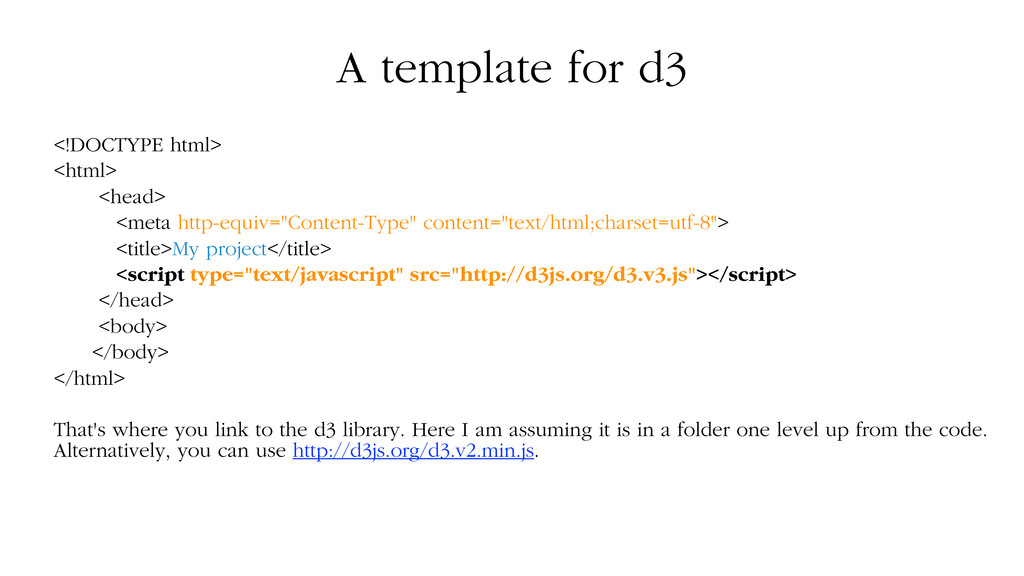
content="text/html;charset=utf-8"> <title>My project</title> <script type="text/javascript" src="http://d3js.org/d3.v3.js"></script> </head> <body> </body> </html> That's where you link to the d3 library. Here I am assuming it is in a folder one level up from the code. Alternatively, you can use http://d3js.org/d3.v2.min.js.
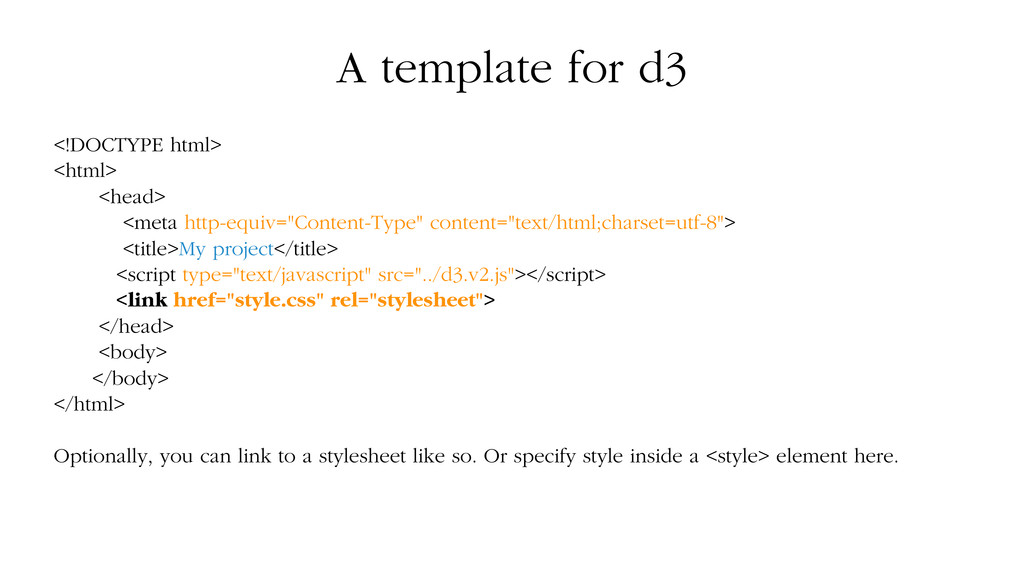
content="text/html;charset=utf-8"> <title>My project</title> <script type="text/javascript" src="../d3.v2.js"></script> <link href="style.css" rel="stylesheet"> </head> <body> </body> </html> Optionally, you can link to a stylesheet like so. Or specify style inside a <style> element here.
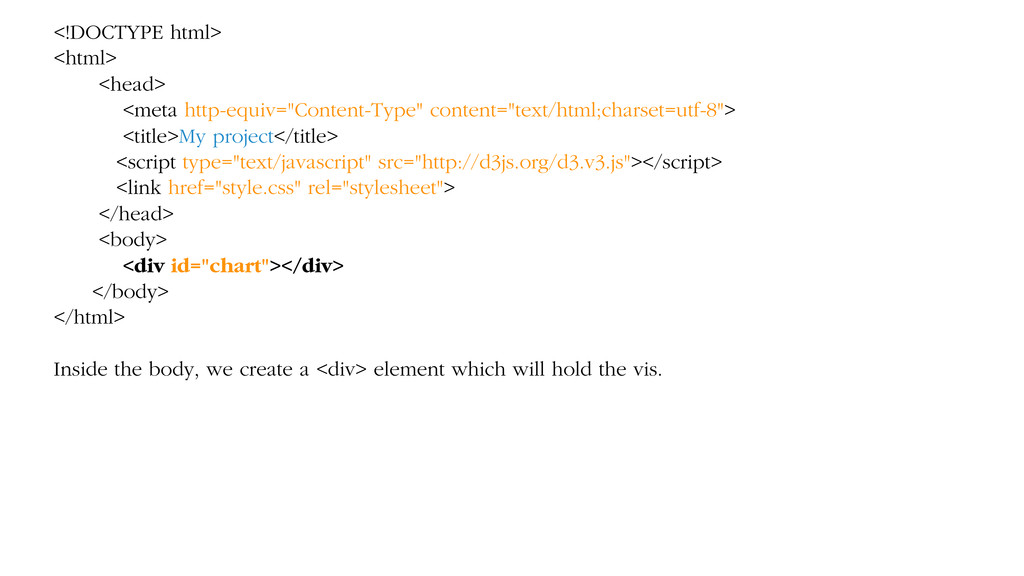
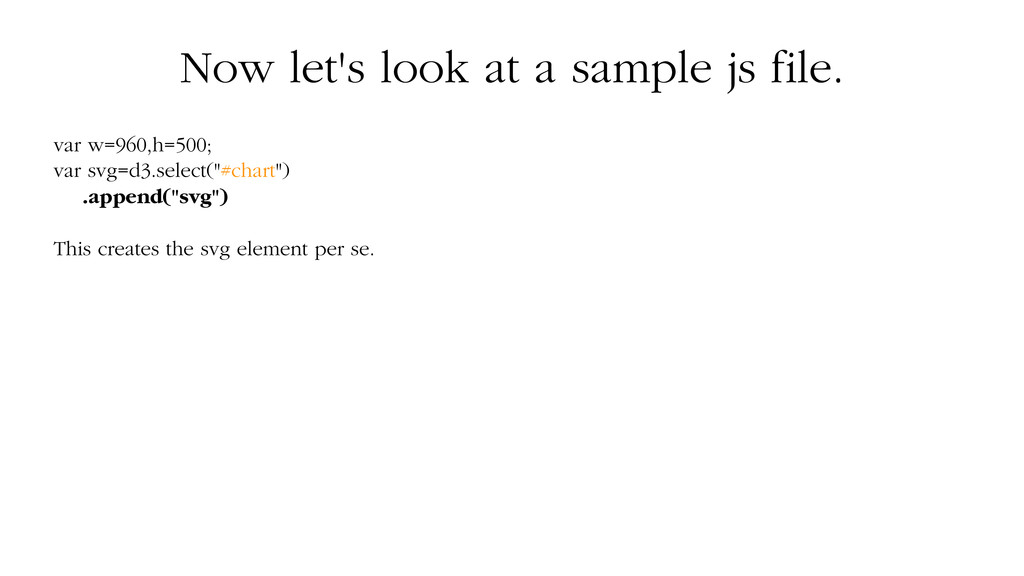
type="text/javascript" src="http://d3js.org/d3.v3.js"></script> <link href="style.css" rel="stylesheet"> </head> <body> <div id="chart"></div> </body> </html> Inside the body, we create a <div> element which will hold the vis.
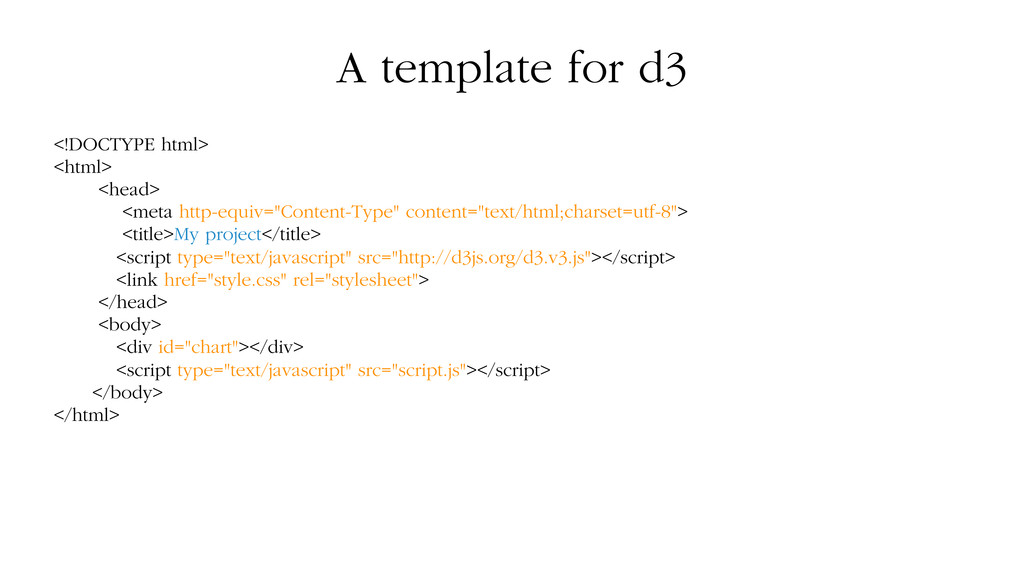
type="text/javascript" src="http://d3js.org/d3.v3.js"></script> <link href="style.css" rel="stylesheet"> </head> <body> <div id="chart"></div> <script type="text/javascript" src="script.js"></script> </body> </html> Finally, we link to a script file containing our actual javascript code. Alternatively, we may write our code here inside a <script> element.
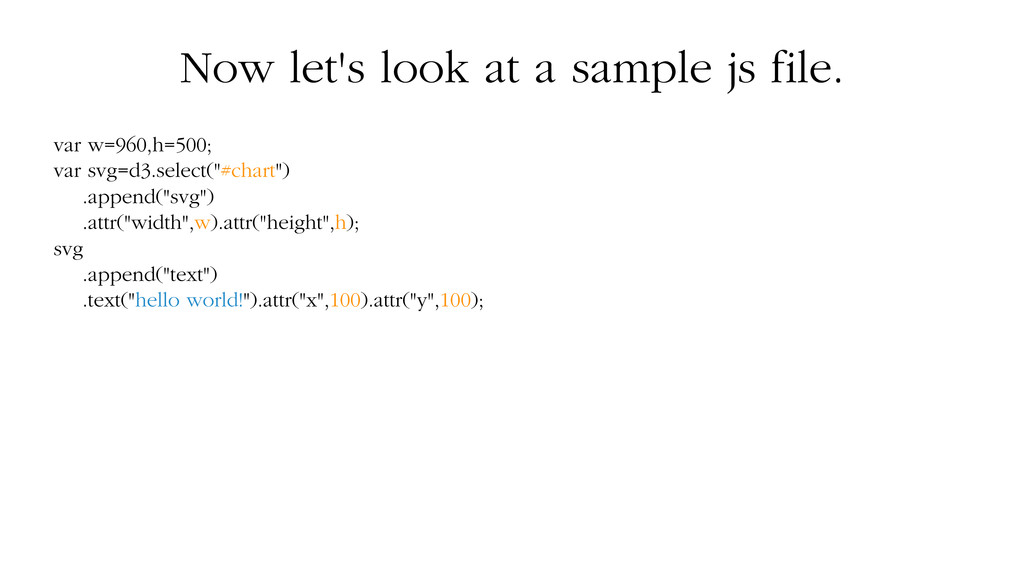
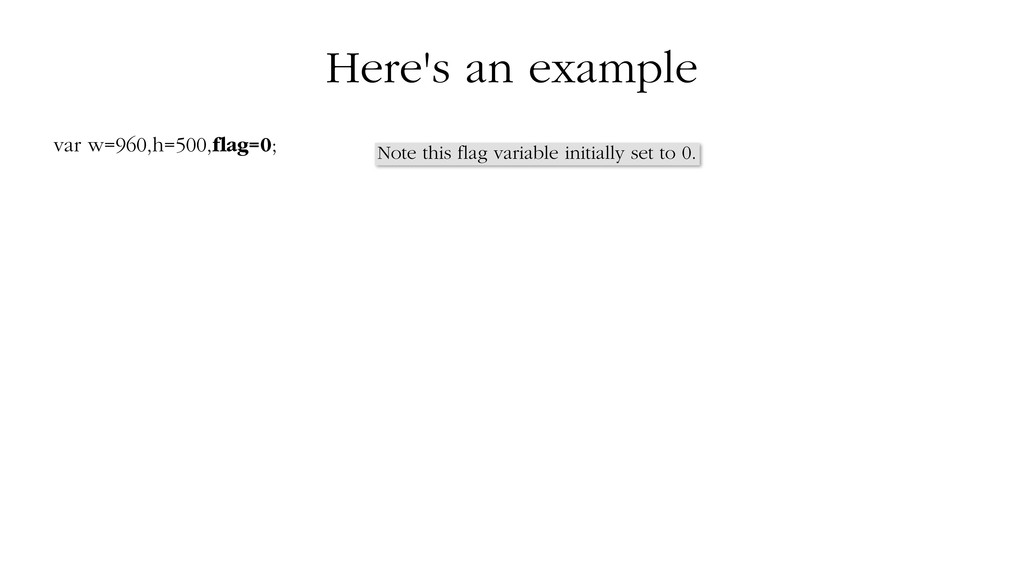
Simple variables to size the vis. Those numbers are chosen because they work well with Mike Bostock's http://bl.ocks.org, a simple viewer for code examples hosted on GitHub Gist.
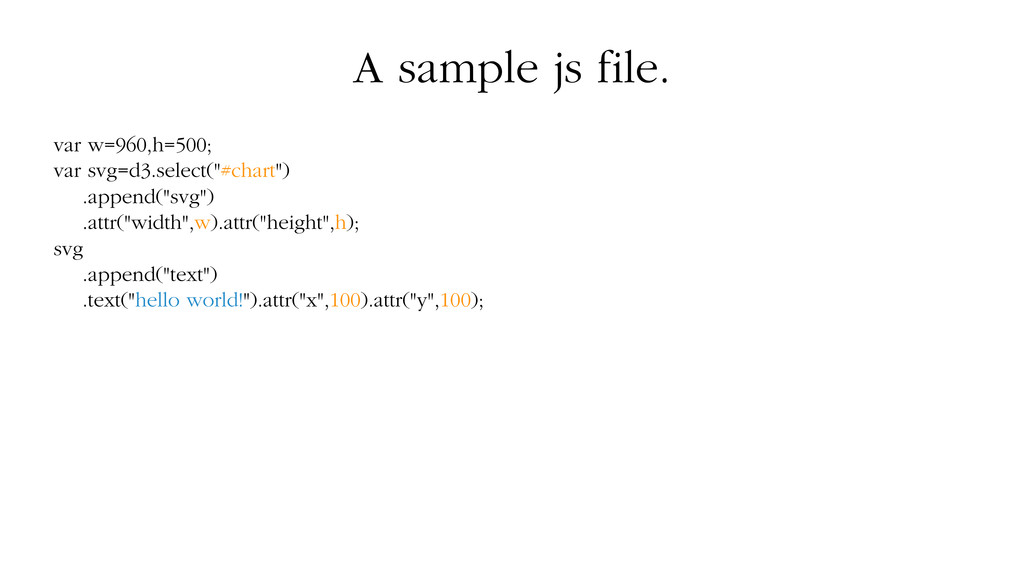
var svg=d3.select("#chart") .append("svg") .attr("width",w).attr("height",h); And this last line gives an explicit width and height to the svg element. This is desired in Firefox (in chrome/safari, the svg just resizes as needed) and generally more proper.
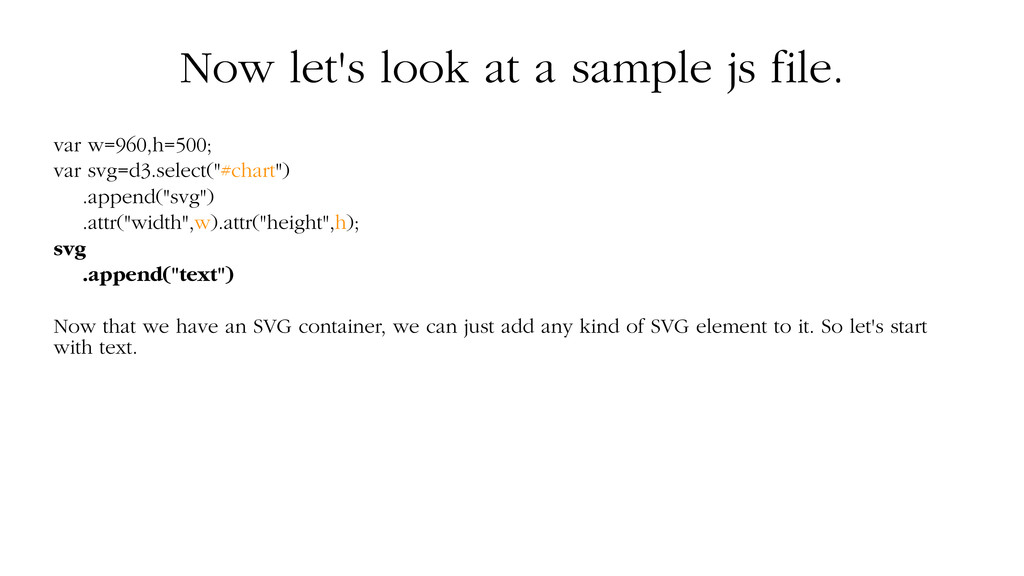
var svg=d3.select("#chart") .append("svg") .attr("width",w).attr("height",h); svg .append("text") Now that we have an SVG container, we can just add any kind of SVG element to it. So let's start with text.
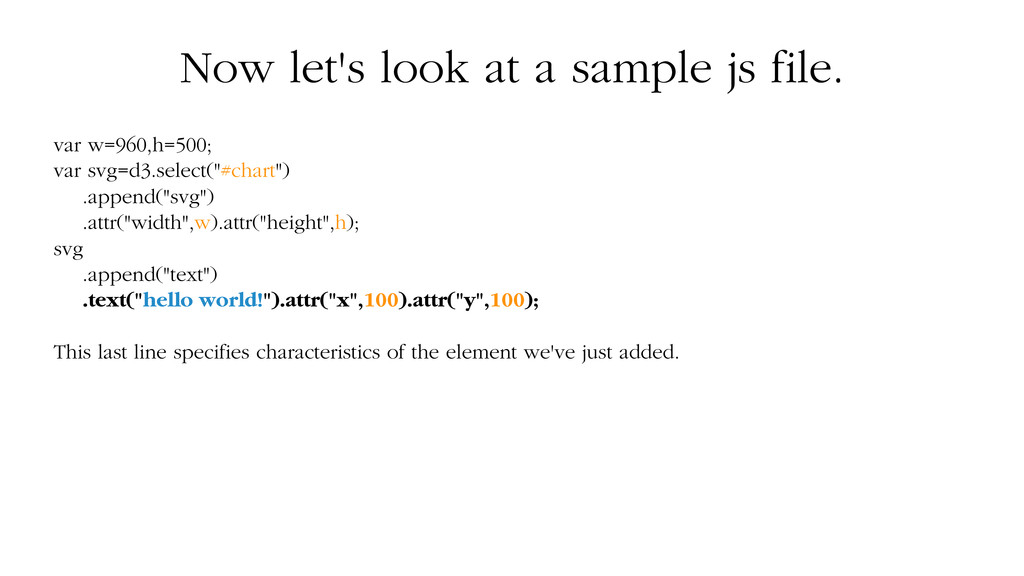
var svg=d3.select("#chart") .append("svg") .attr("width",w).attr("height",h); svg .append("text") .text("hello world!").attr("x",100).attr("y",100); This last line specifies characteristics of the element we've just added.
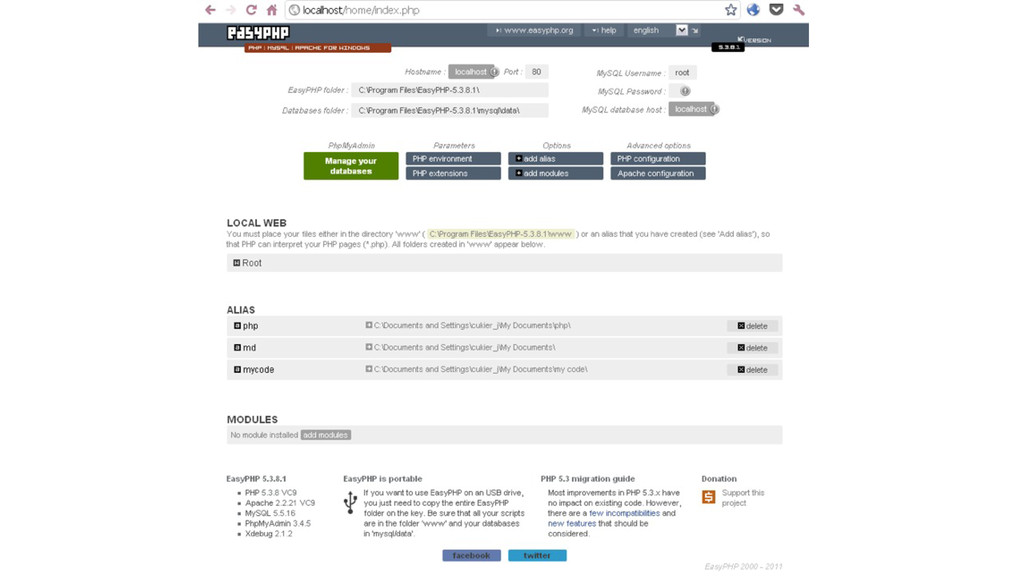
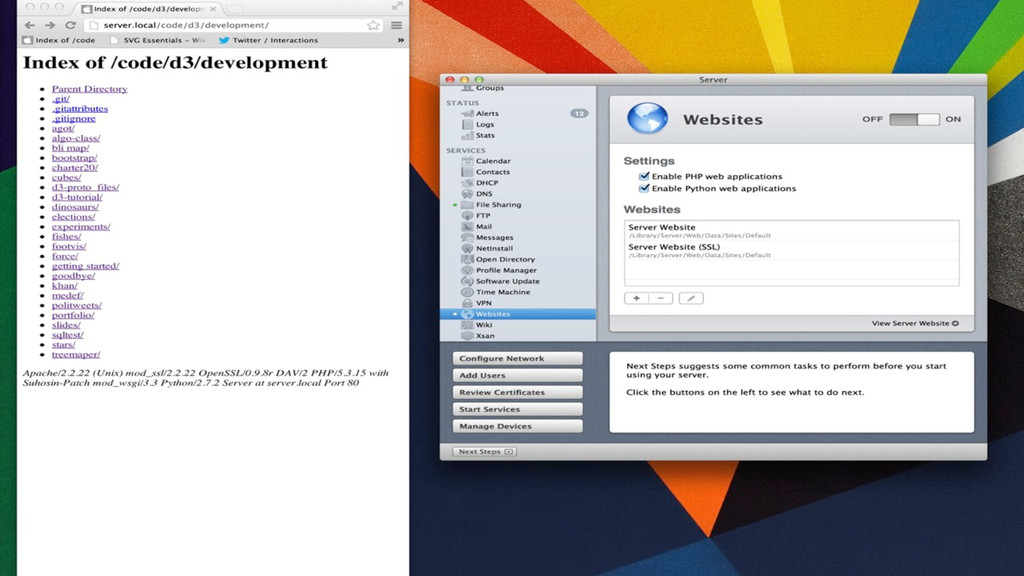
locally, simply by opening an html file in a browser. • But if your visualization is reading data from files or from a database (XMLHttpRequest), then you need to publish it on a web server to test it. • There are many options: EasyPHP (windows), Mac OS X Server, MAMP (Mac OS X)
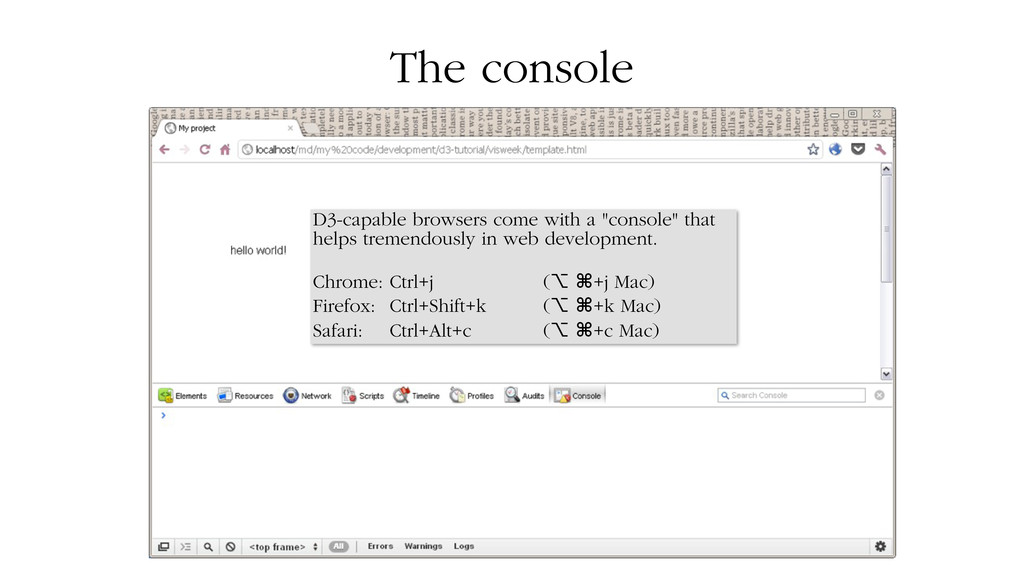
tremendously in web development. Chrome: Ctrl+j (⌥ ⌘+j Mac) Firefox: Ctrl+Shift+k (⌥ ⌘+k Mac) Safari: Ctrl+Alt+c (⌥ ⌘+c Mac) Among other things, the console lets you see the value of variables, and let you enter some commands directly, without having to put them in a file.
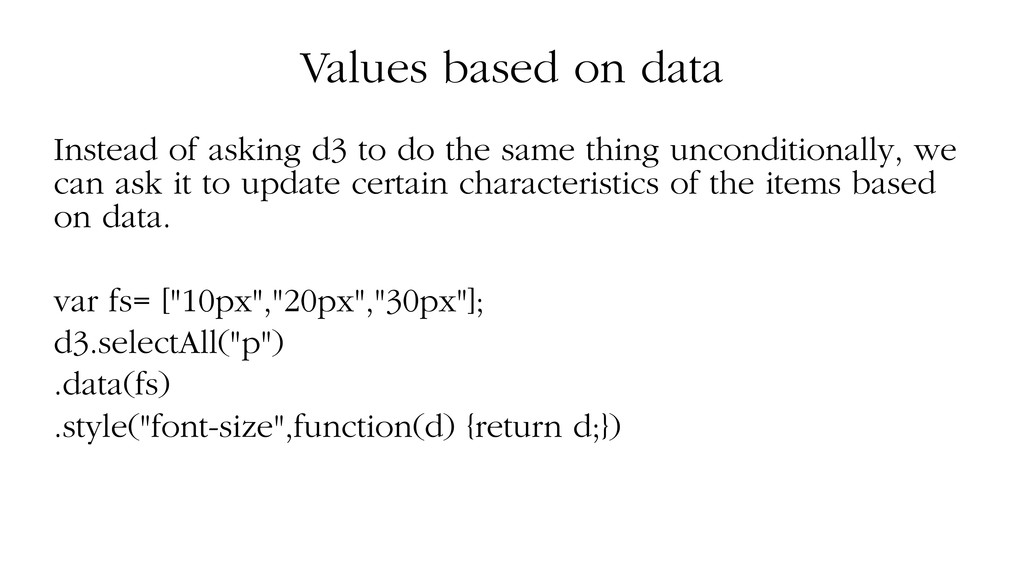
the same thing unconditionally, we can ask it to update certain characteristics of the items based on data. var fs= ["10px","20px","30px"]; d3.selectAll("p") .data(fs) .style("font-size",function(d) {return d;})
d;}) What is d? Here, I'm assigning to the "font-size" style a value which is not static, but dynamic. To compute that value, we retrieve it from the data using functions. The first argument of these functions is the data item. The name of that argument is arbitrary, d is a convention. Here, we just return the value we've read, but inside the function there can be any kind of transformation.
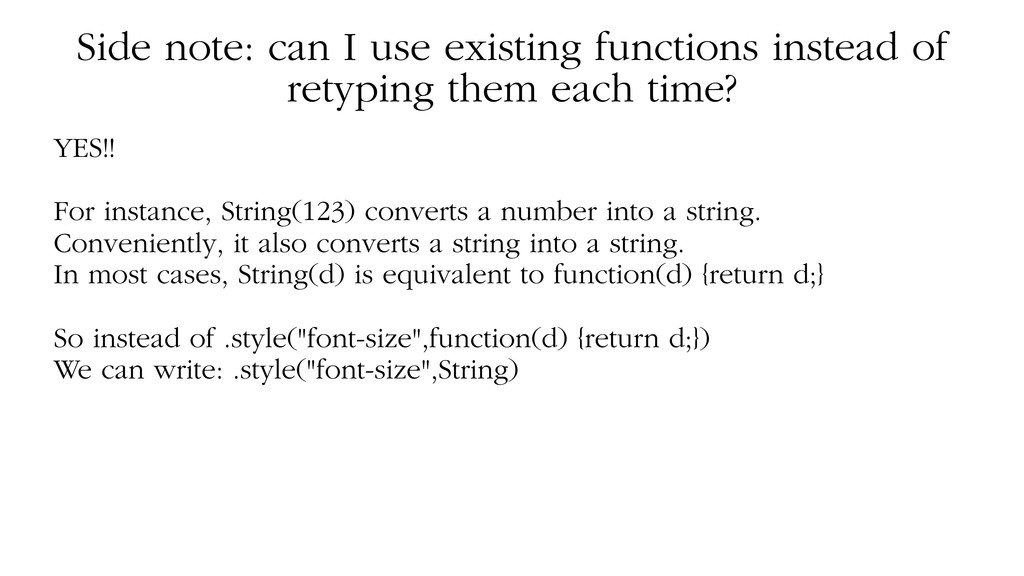
them each time? YES!! For instance, String(123) converts a number into a string. Conveniently, it also converts a string into a string. In most cases, String(d) is equivalent to function(d) {return d;} So instead of .style("font-size",function(d) {return d;}) We can write: .style("font-size",String)
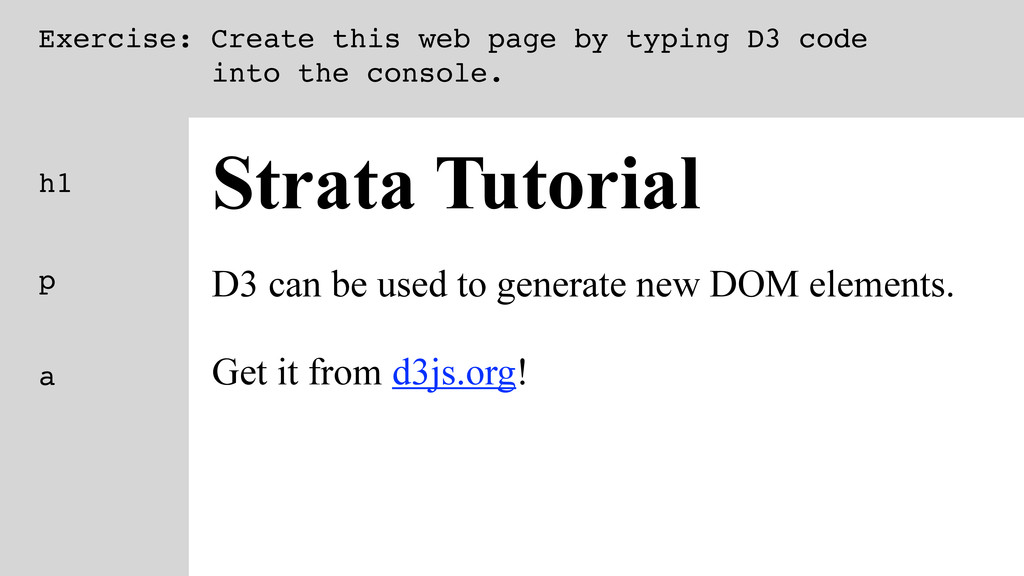
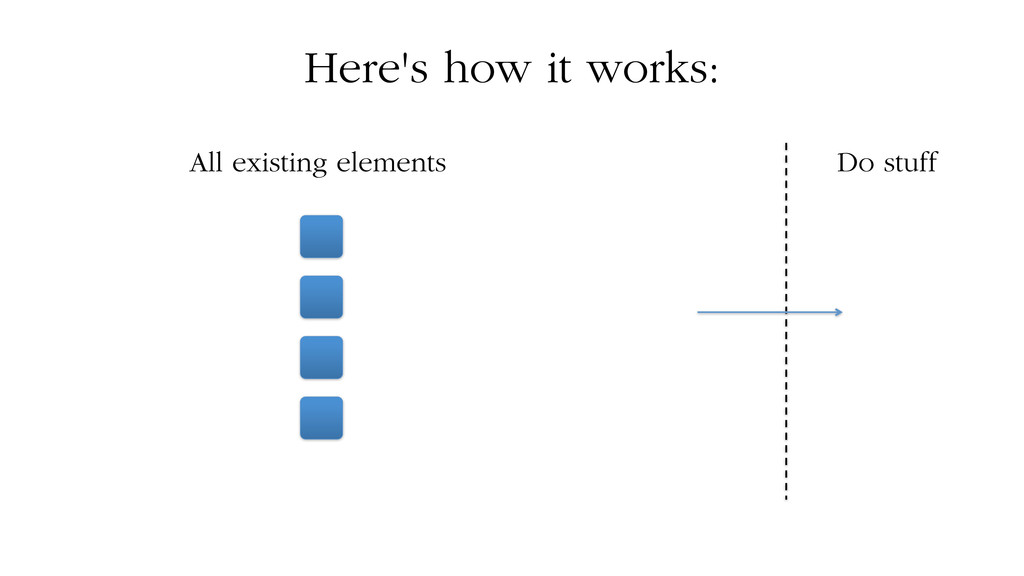
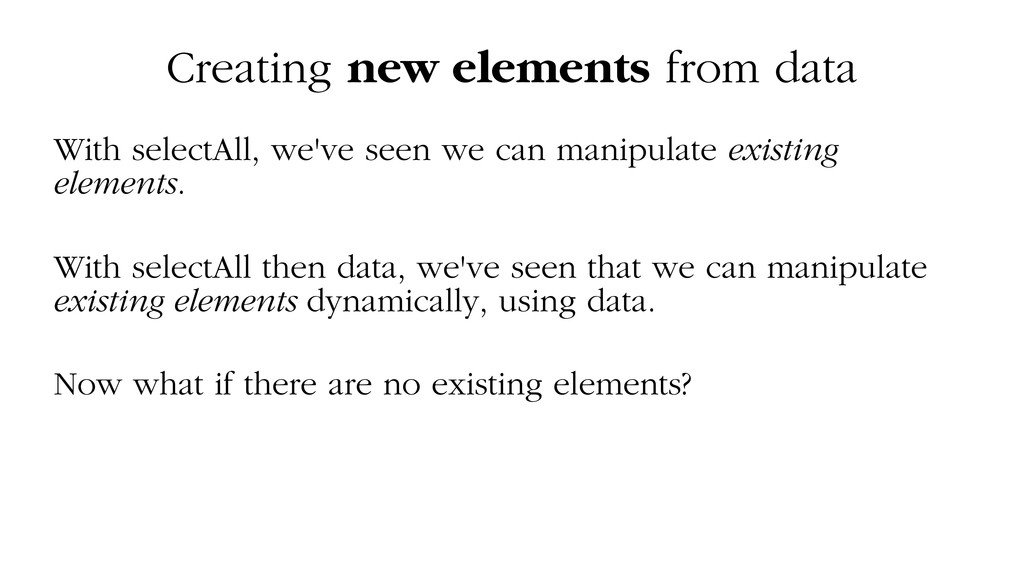
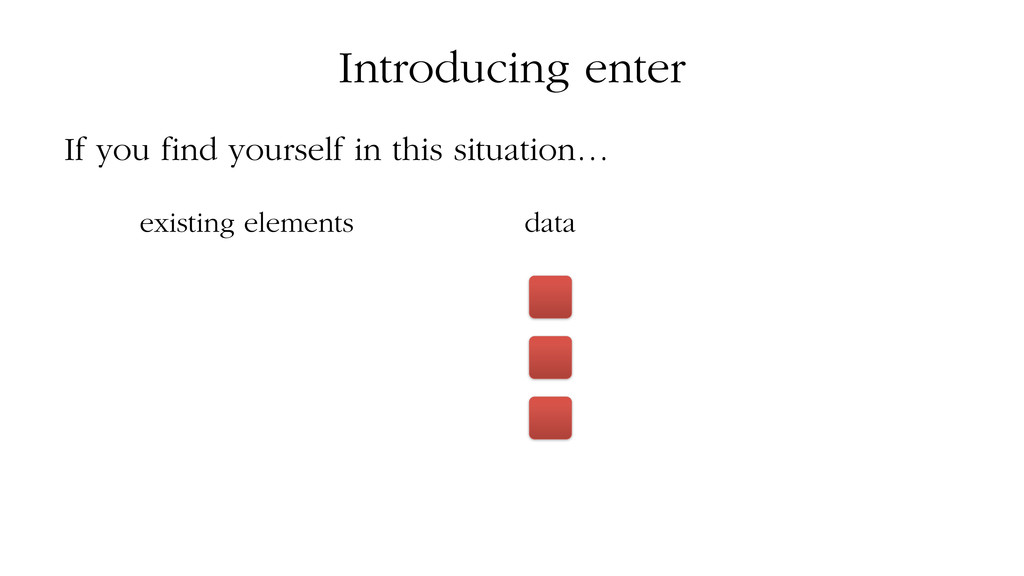
can manipulate existing elements. With selectAll then data, we've seen that we can manipulate existing elements dynamically, using data. Now what if there are no existing elements?
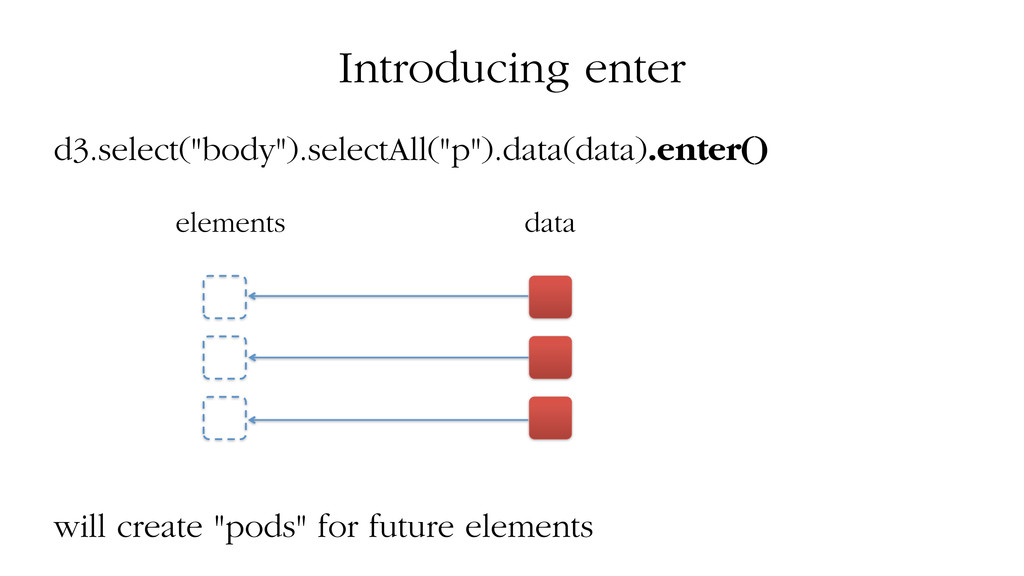
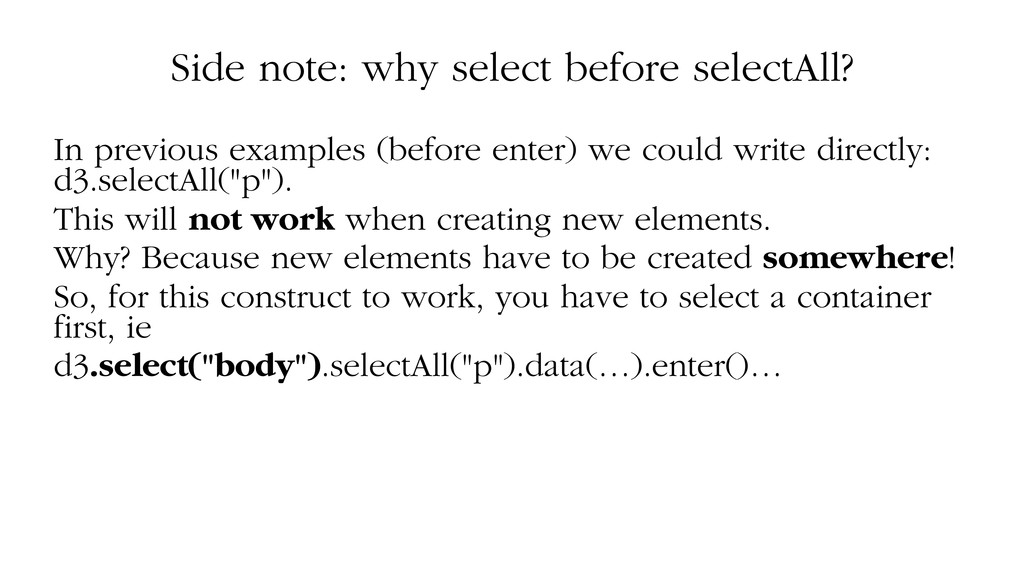
enter) we could write directly: d3.selectAll("p"). This will not work when creating new elements. Why? Because new elements have to be created somewhere! So, for this construct to work, you have to select a container first, ie d3.select("body").selectAll("p").data(…).enter()…
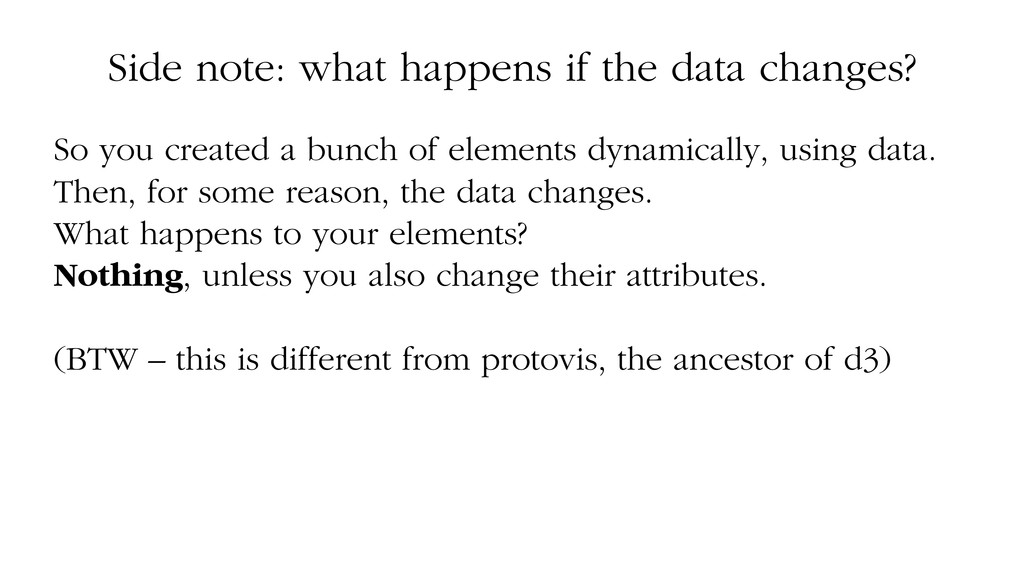
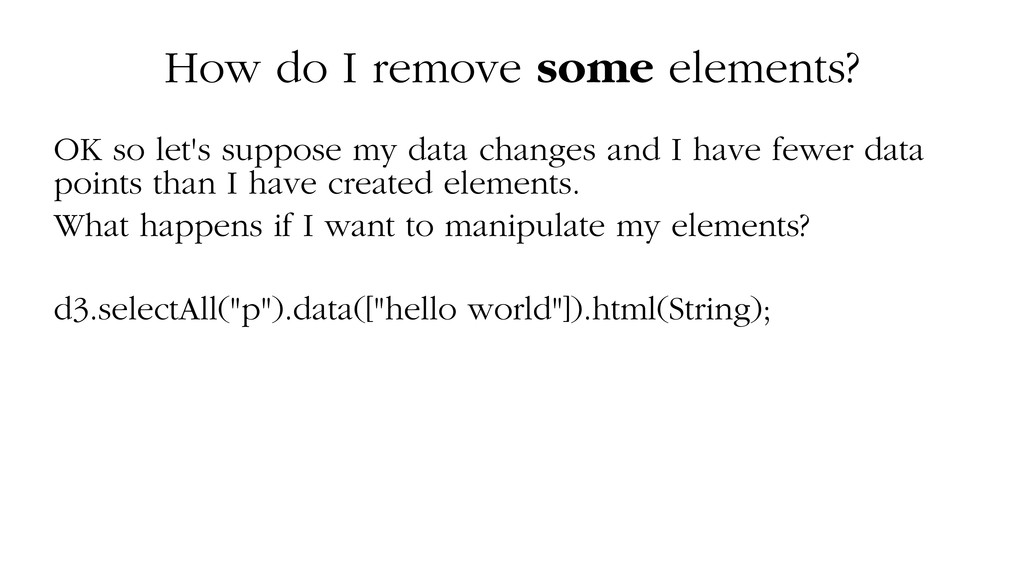
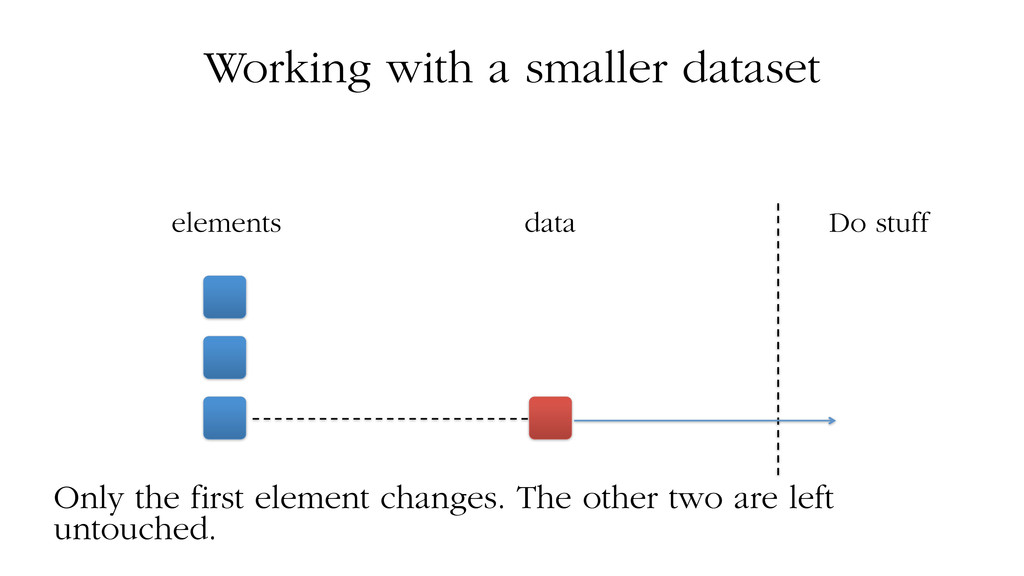
created a bunch of elements dynamically, using data. Then, for some reason, the data changes. What happens to your elements? Nothing, unless you also change their attributes. (BTW – this is different from protovis, the ancestor of d3)
my data changes and I have fewer data points than I have created elements. What happens if I want to manipulate my elements? d3.selectAll("p").data(["hello world"]).html(String);
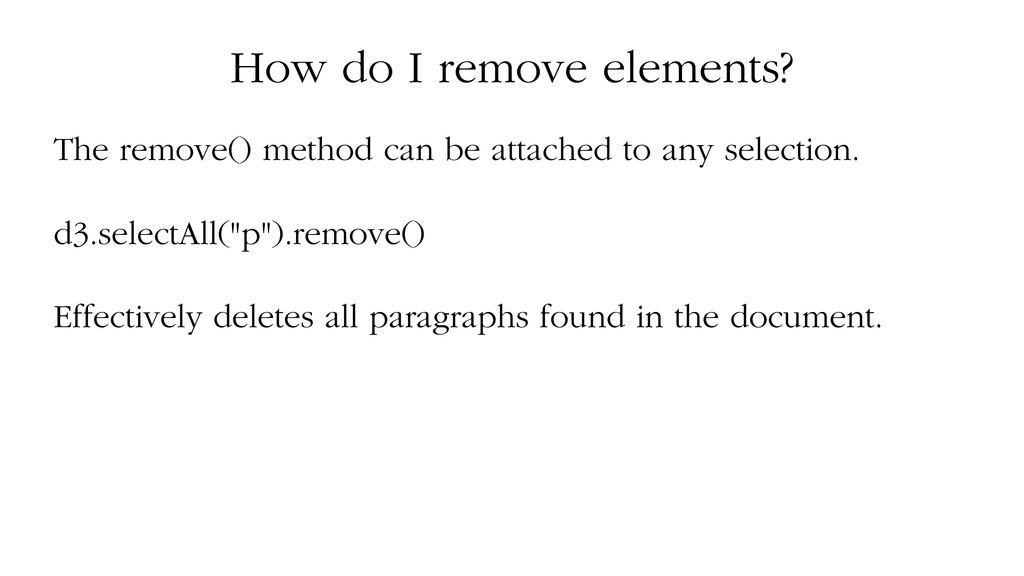
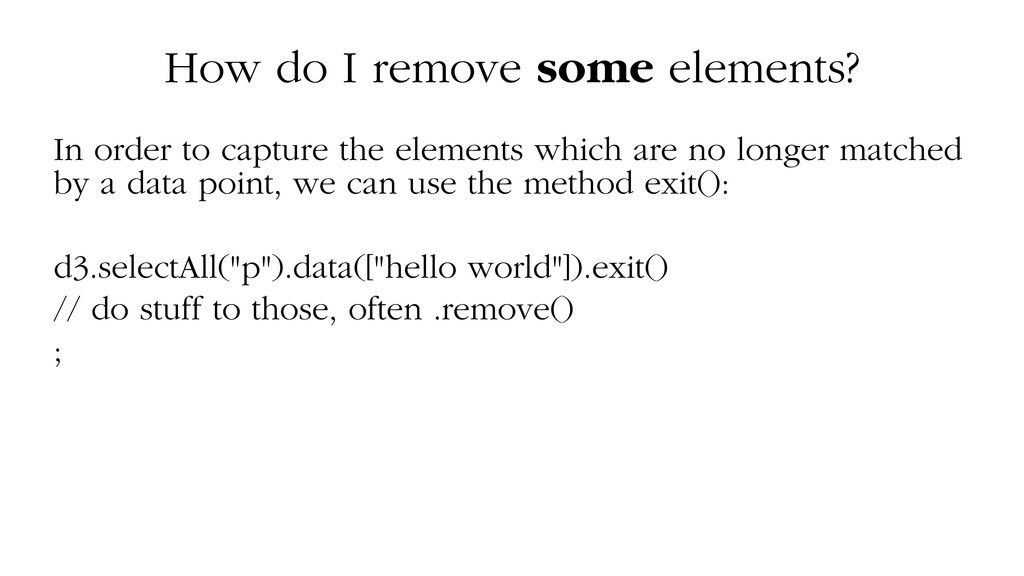
the elements which are no longer matched by a data point, we can use the method exit(): d3.selectAll("p").data(["hello world"]).exit() // do stuff to those, often .remove() ;
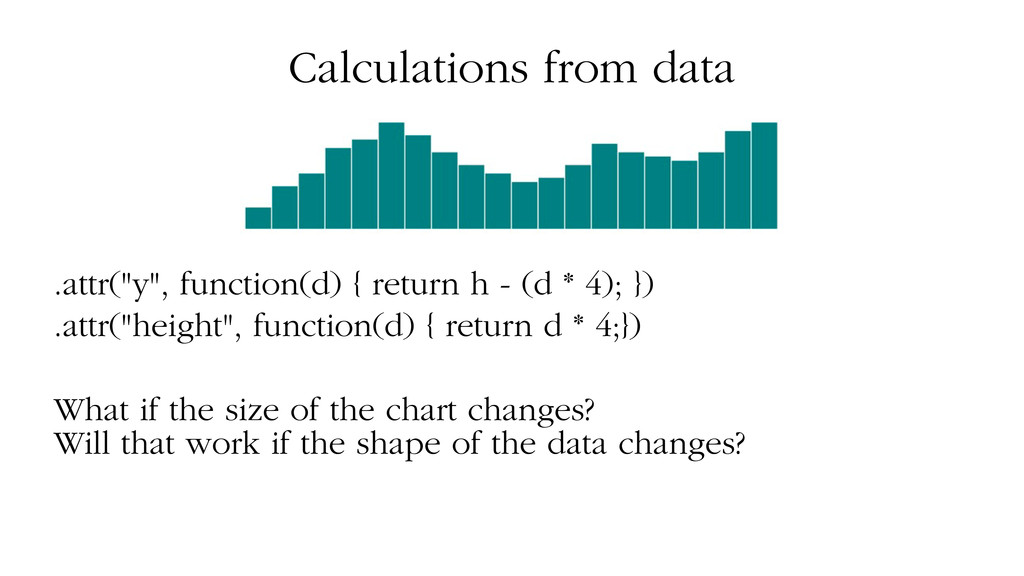
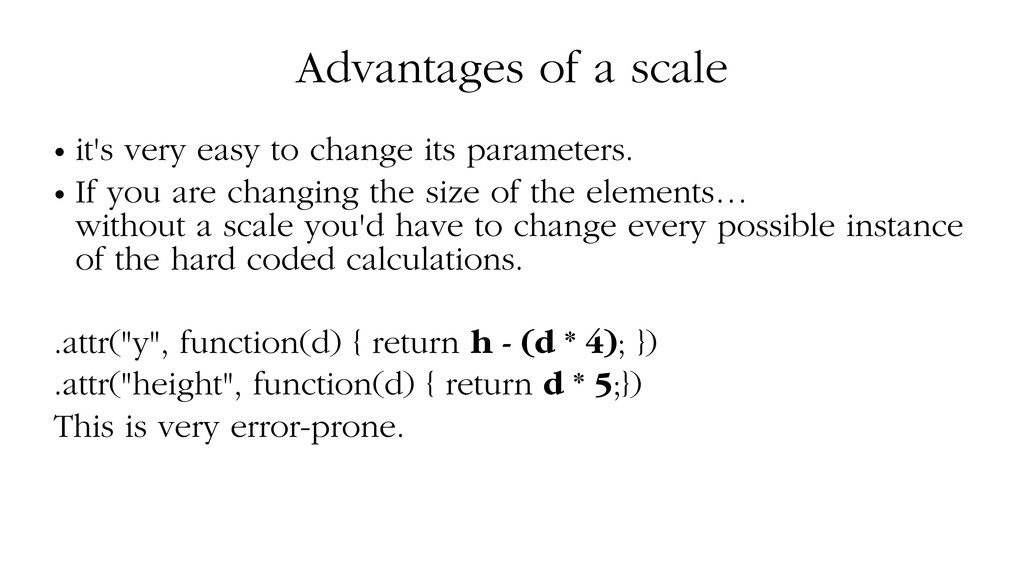
its parameters. • If you are changing the size of the elements… without a scale you'd have to change every possible instance of the hard coded calculations. .attr("y", function(d) { return h - (d * 4); }) .attr("height", function(d) { return d * 5;}) This is very error-prone.
y.domain(d3.extent(dataset)) // computes bounds of the scale automatically y.domain([0,d3.max(dataset)]) // another way of determining the domain automatically y.clamp([true]) // values outside the bounds of the domain get the min or max value of the range. y.invert() // the mapping in the reverse direction.
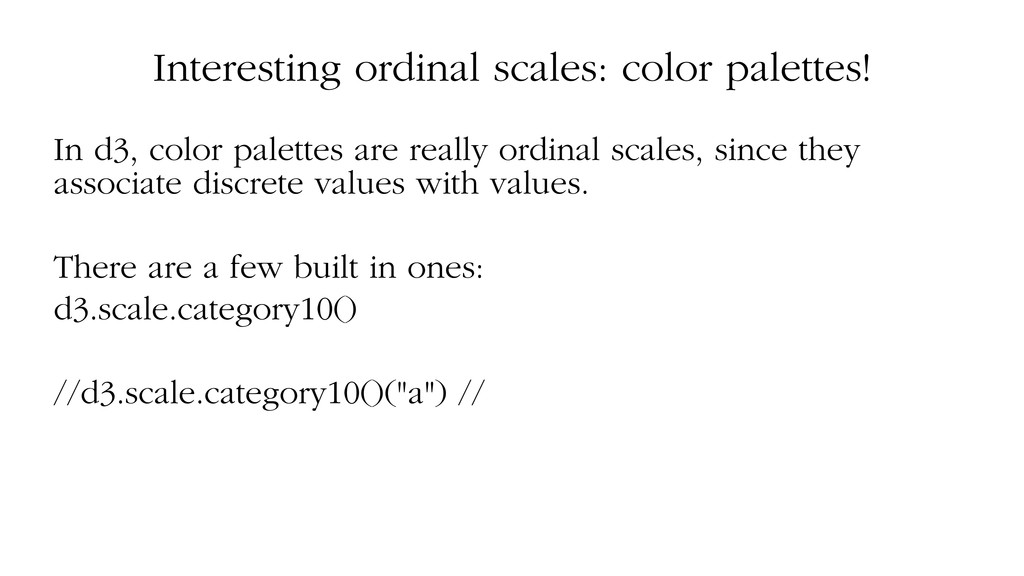
really ordinal scales, since they associate discrete values with values. There are a few built in ones: d3.scale.category10() //d3.scale.category10()("a") //
it doesn’t have to be a full-fledged form: controls like drop- down menus, tick boxes, sliders etc. • Interaction on elements of the chart proper SVG or HTML elements: clicking, moving the cursor in or out, etc.
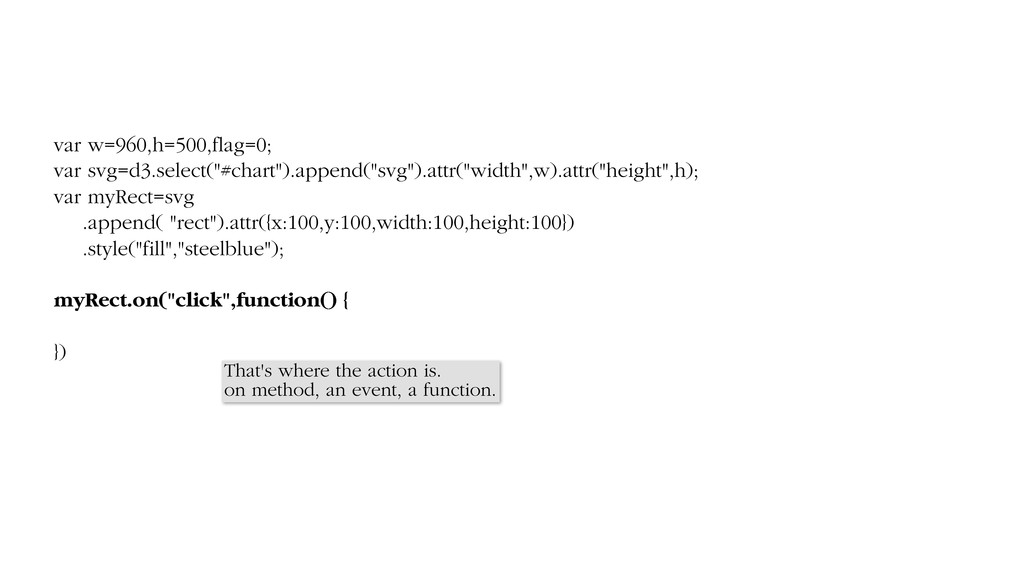
{ flag=1-flag; myRect.style("fill", flag?"darkorange":"steelblue"); }) And now for the win: we just toggle the value of flag (0 becomes 1 and vice versa) then we style our rectangle according to that value : orange if flag is 1, else blue.
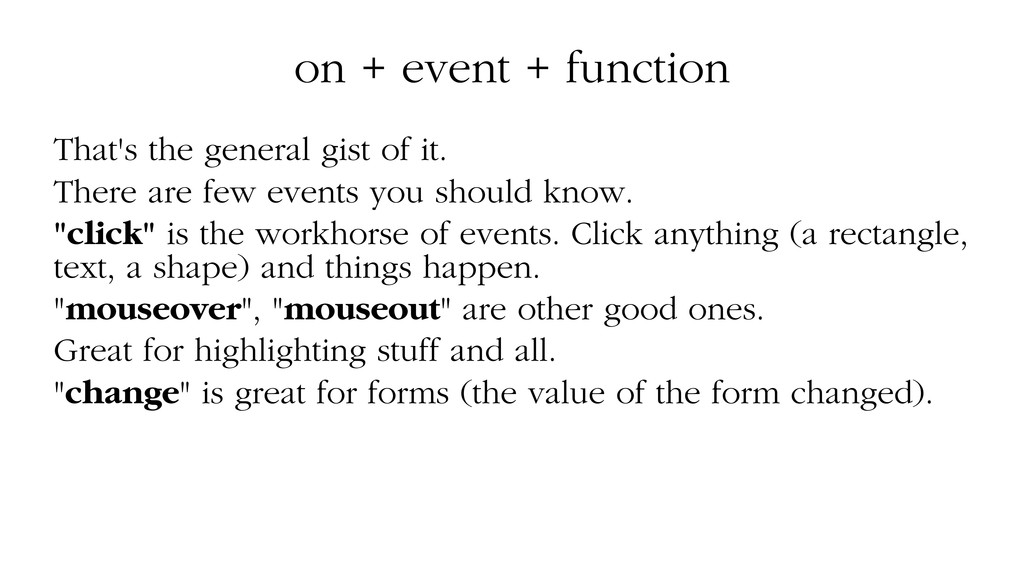
it. There are few events you should know. "click" is the workhorse of events. Click anything (a rectangle, text, a shape) and things happen. "mouseover", "mouseout" are other good ones. Great for highlighting stuff and all. "change" is great for forms (the value of the form changed).
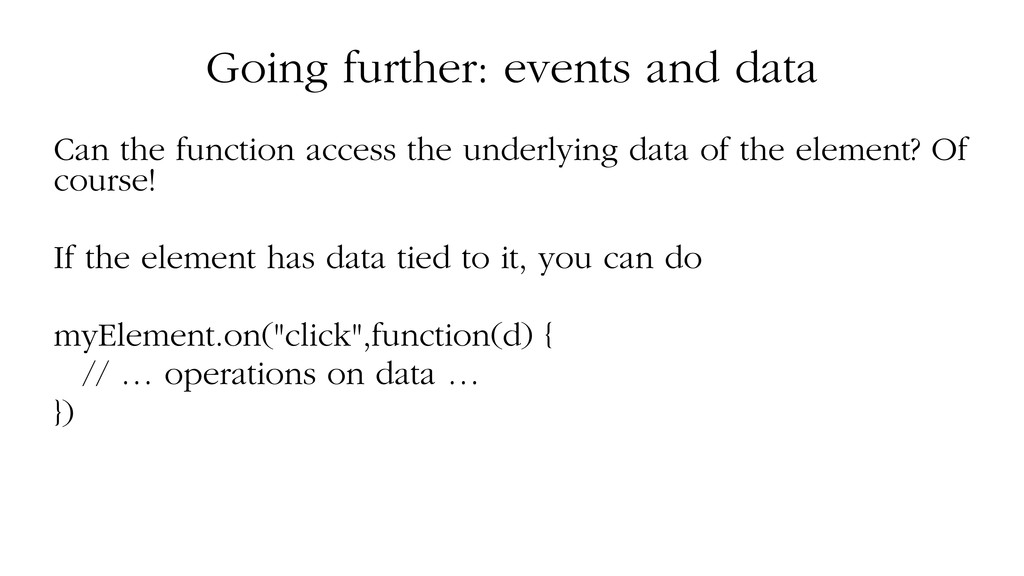
underlying data of the element? Of course! If the element has data tied to it, you can do myElement.on("click",function(d) { // … operations on data … })
controls is to access the value selected by the user. So you'll often have something like: myControl.on("change",function() { doStuff(this.value); }) this.value will store the value of the control.
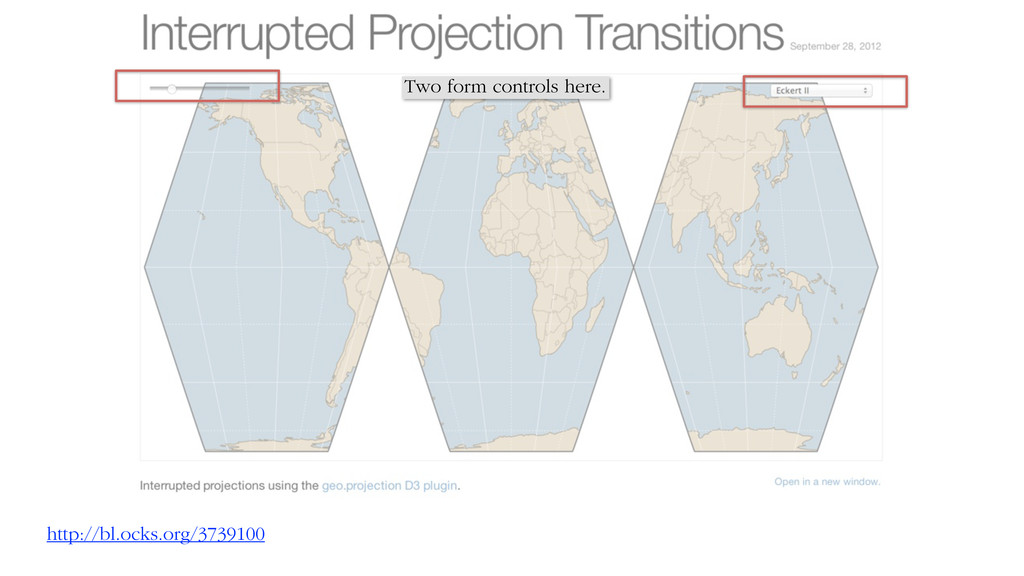
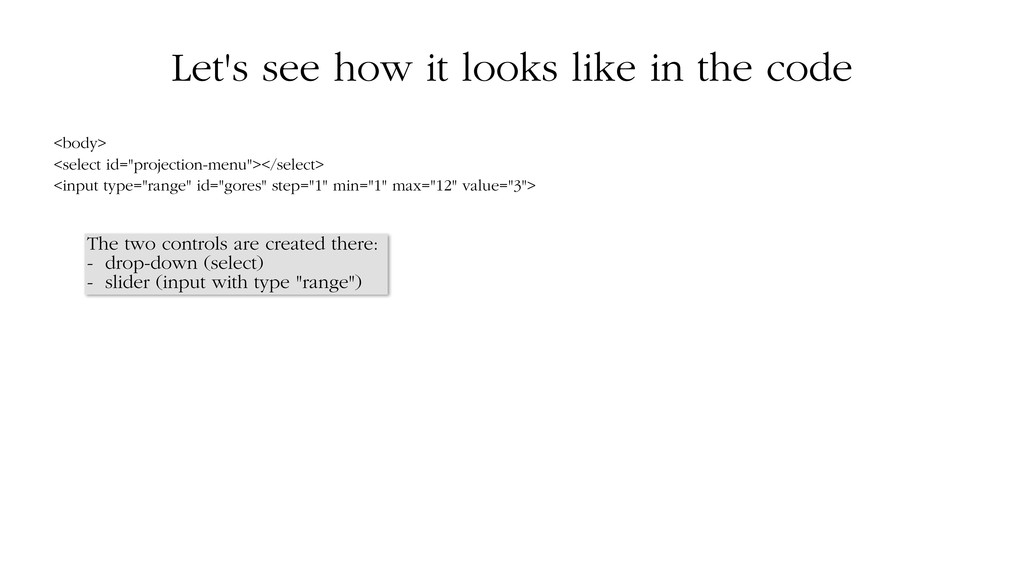
<select id="projection-menu"></select> <input type="range" id="gores" step="1" min="1" max="12" value="3"> The two controls are created there: - drop-down (select) - slider (input with type "range")
function() { gores(); … }); … function gores() { var n = +d3.select("#gores").property("value"); … } When the slider value changes, the "change" event is triggered and so the gores() function is called. Then, this function does stuff depending on the position of the slider, which is obtained thusly: by looking up the property "value" of the slider.
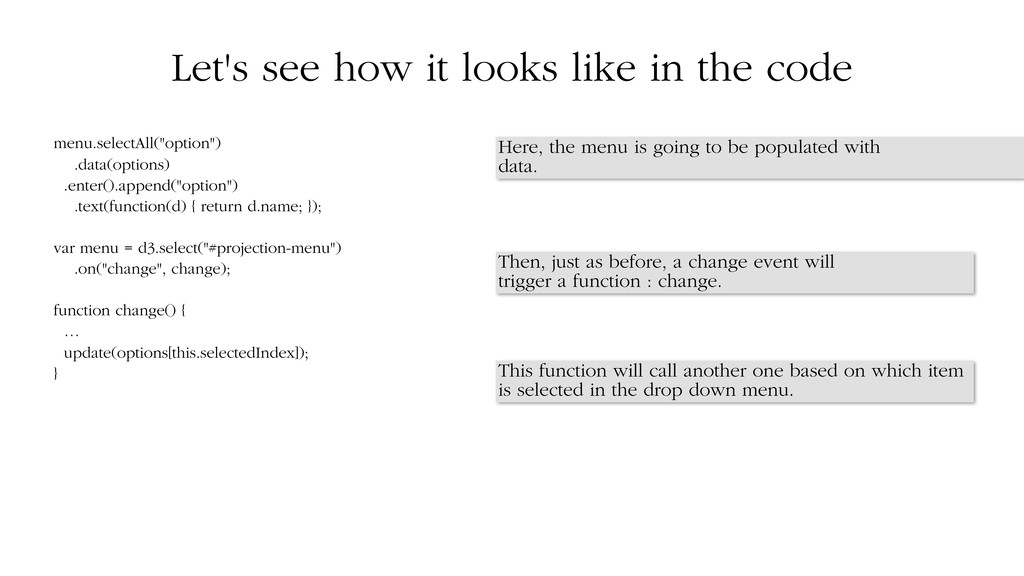
.data(options) .enter().append("option") .text(function(d) { return d.name; }); var menu = d3.select("#projection-menu") .on("change", change); function change() { … update(options[this.selectedIndex]); } Here, the menu is going to be populated with data. Then, just as before, a change event will trigger a function : change. This function will call another one based on which item is selected in the drop down menu.
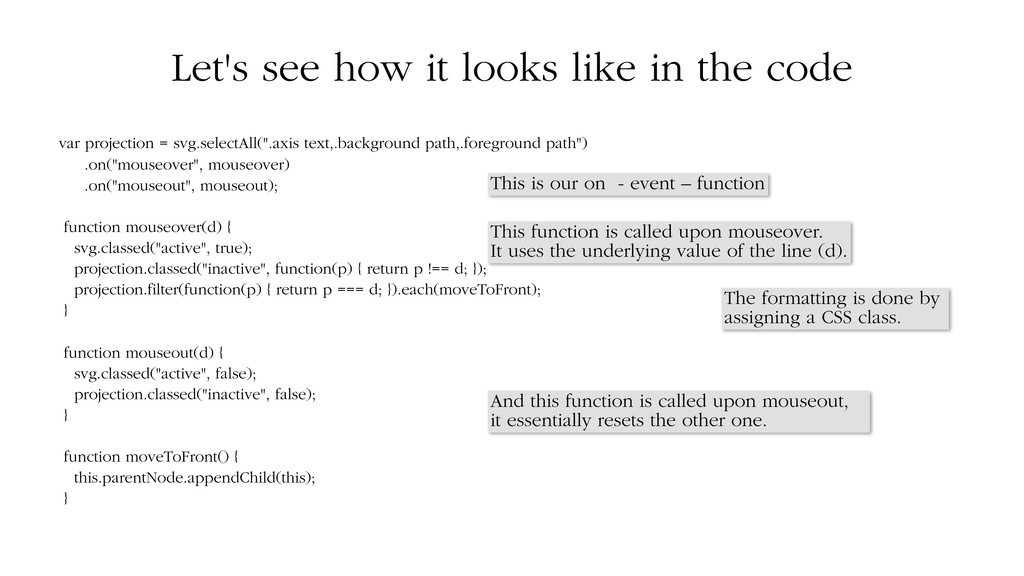
projection = svg.selectAll(".axis text,.background path,.foreground path") .on("mouseover", mouseover) .on("mouseout", mouseout); function mouseover(d) { svg.classed("active", true); projection.classed("inactive", function(p) { return p !== d; }); projection.filter(function(p) { return p === d; }).each(moveToFront); } function mouseout(d) { svg.classed("active", false); projection.classed("inactive", false); } function moveToFront() { this.parentNode.appendChild(this); } This is our on - event – function This function is called upon mouseover. It uses the underlying value of the line (d). The formatting is done by assigning a CSS class. And this function is called upon mouseout, it essentially resets the other one.
![Wait! var myScale=d3.scale.linear().domain([0,25]) .range([0,100]); Isn't that the same as just](https://files.speakerdeck.com/presentations/d91ebfa0633301301eb922000a8d80c7/slide_70.jpg)
![rangeBands myScale=d3.scale.ordinal() .domain(["Monday","Tuesday","Wednesday","Thursday","Friday" ,"Saturday","Sunday"]) .rangeBands([0,100]) myScale("Tuesday")](https://files.speakerdeck.com/presentations/d91ebfa0633301301eb922000a8d80c7/slide_78.jpg)
![rangePoints myScale=d3.scale.ordinal() .domain(["Monday","Tuesday","Wednesday","Thursday","Friday" ,"Saturday","Sunday"]) .rangePoints([0,100]) myScale("Tuesday")](https://files.speakerdeck.com/presentations/d91ebfa0633301301eb922000a8d80c7/slide_79.jpg)