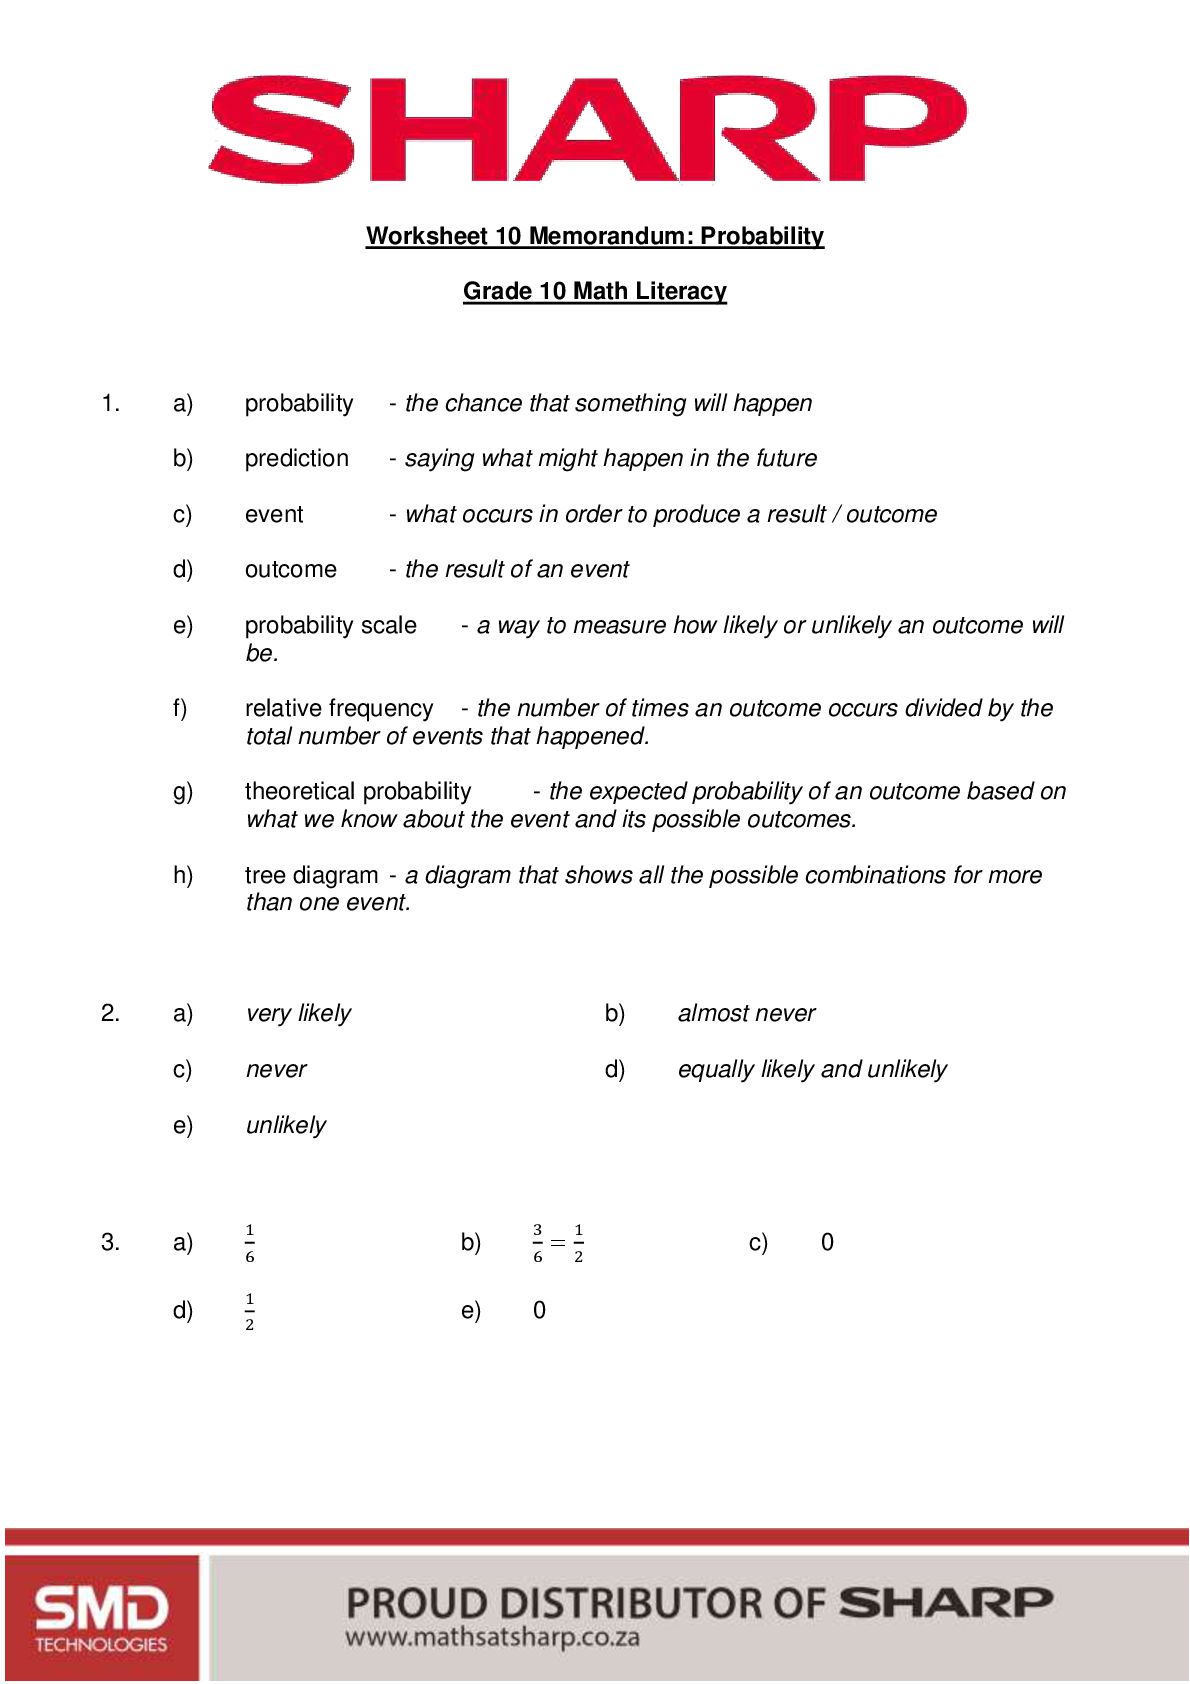
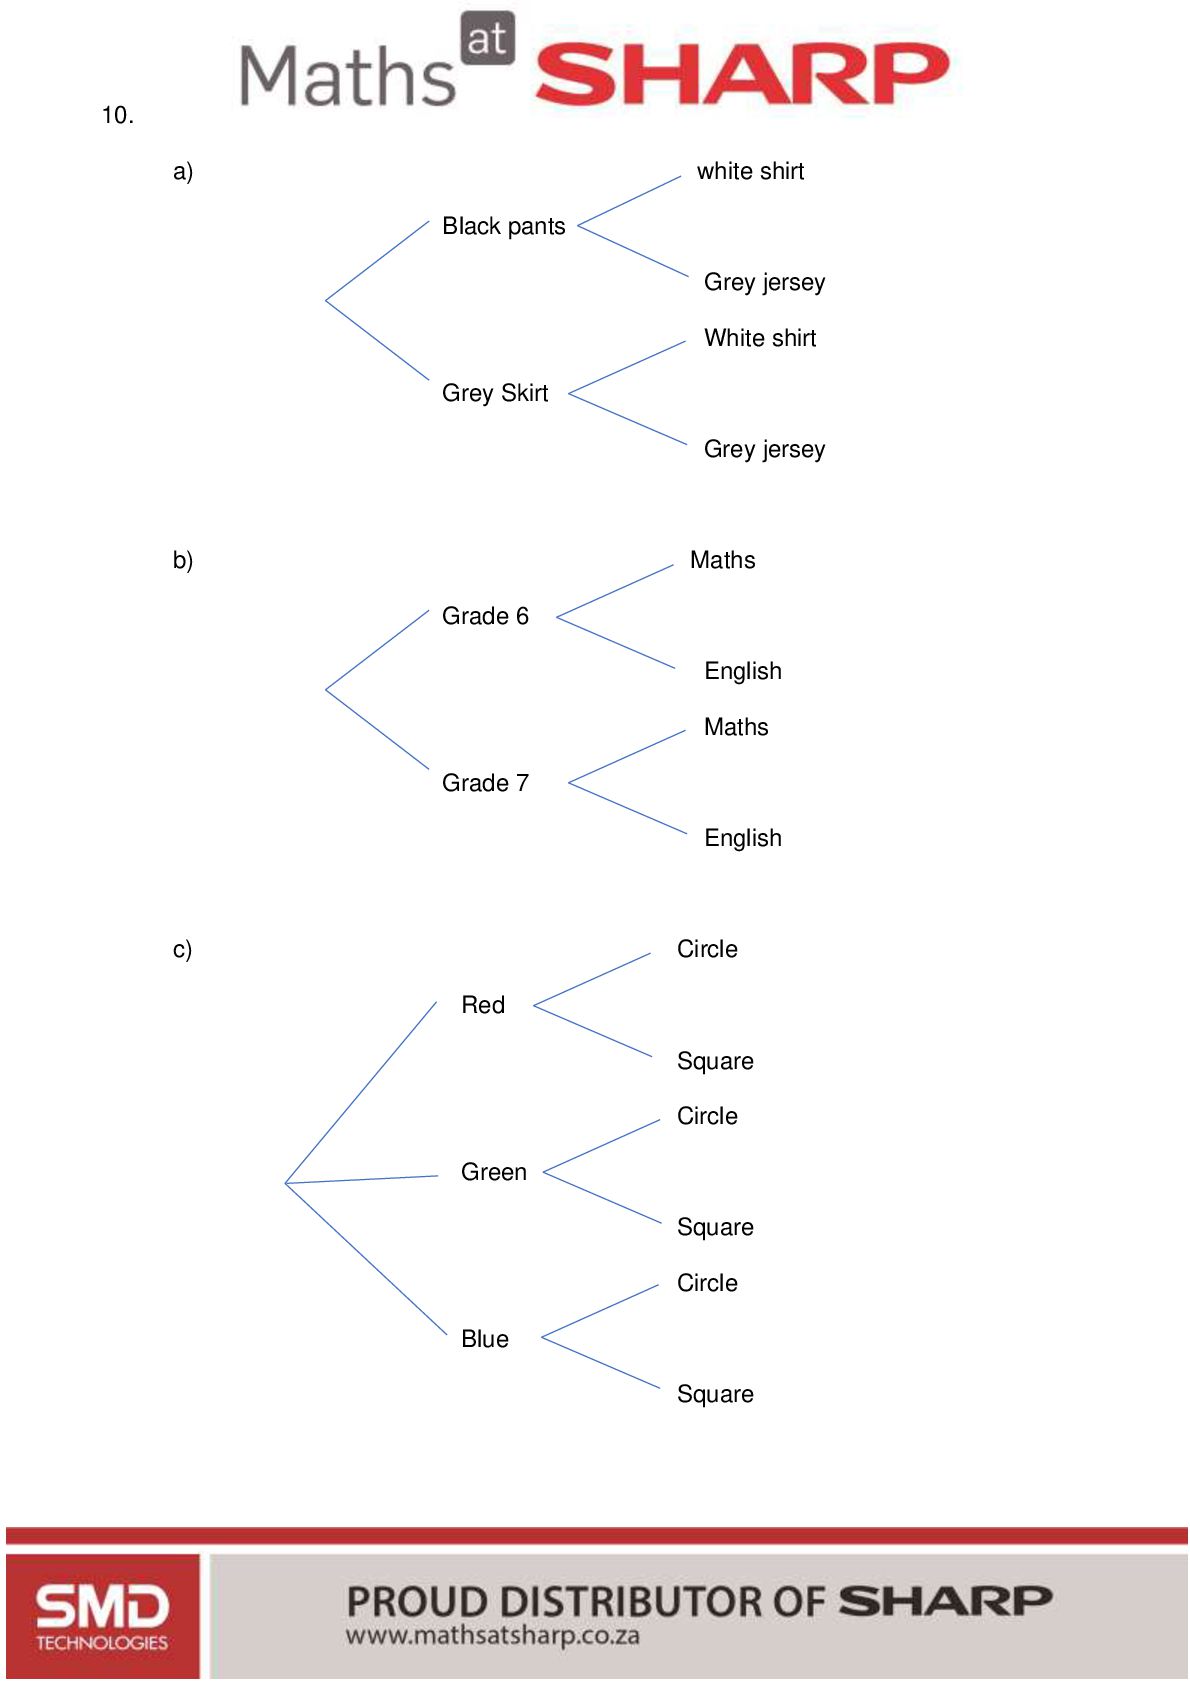
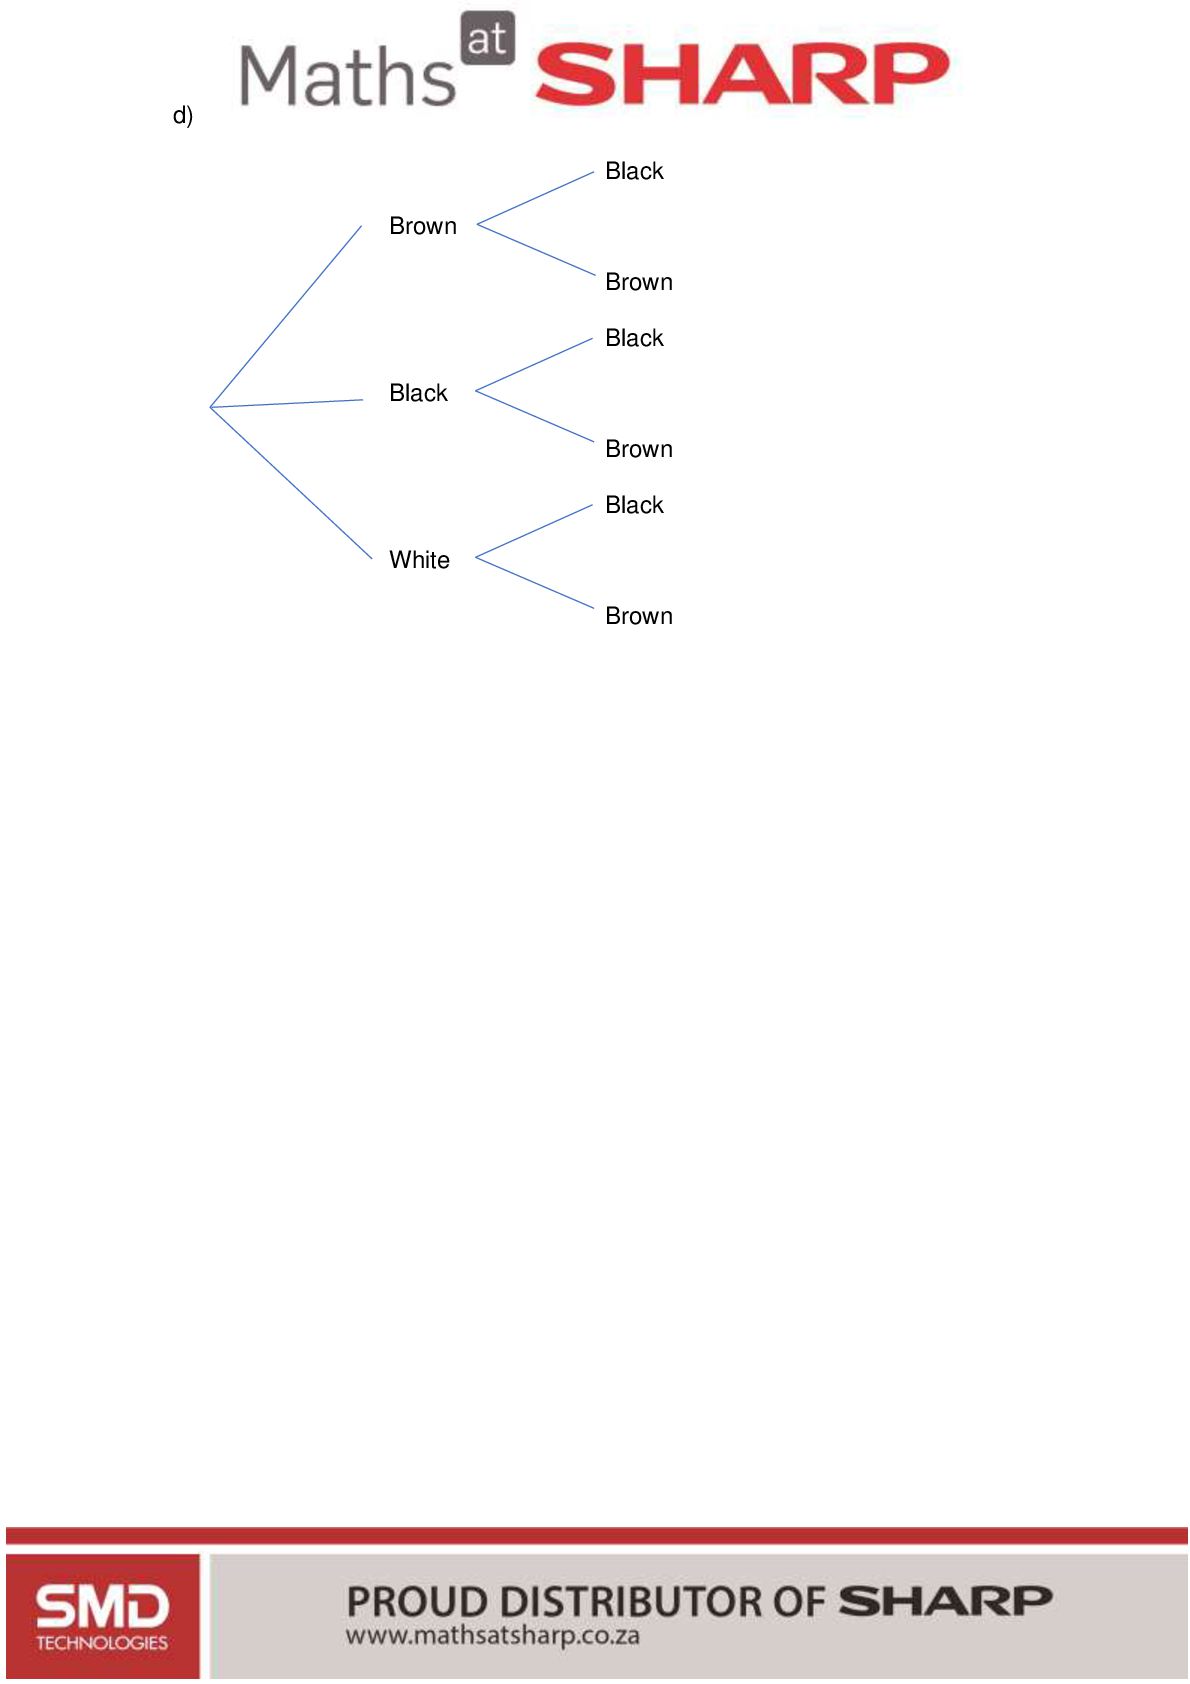
3. a) probability - the chance that something will happen b) prediction - saying what might happen in the future c) event - what occurs in order to produce a result / outcome d) outcome - the result of an event e) probability scale be. f) relative frequency - the number of times an outcome occurs divided by the total number of events that happened. g) theoretical probability - the expected probability of an outcome based on what we know about the event and its possible outcomes. h) tree diagram - a diagram that shows all the possible combinations for more than one event. a) very likely b) almost never c) never d) equally likely and unlikely e) unlikely a) d) 1 6 1 2 - a way to measure how likely or unlikely an outcome will b) e) 3 6 0 1 =2 c) 0
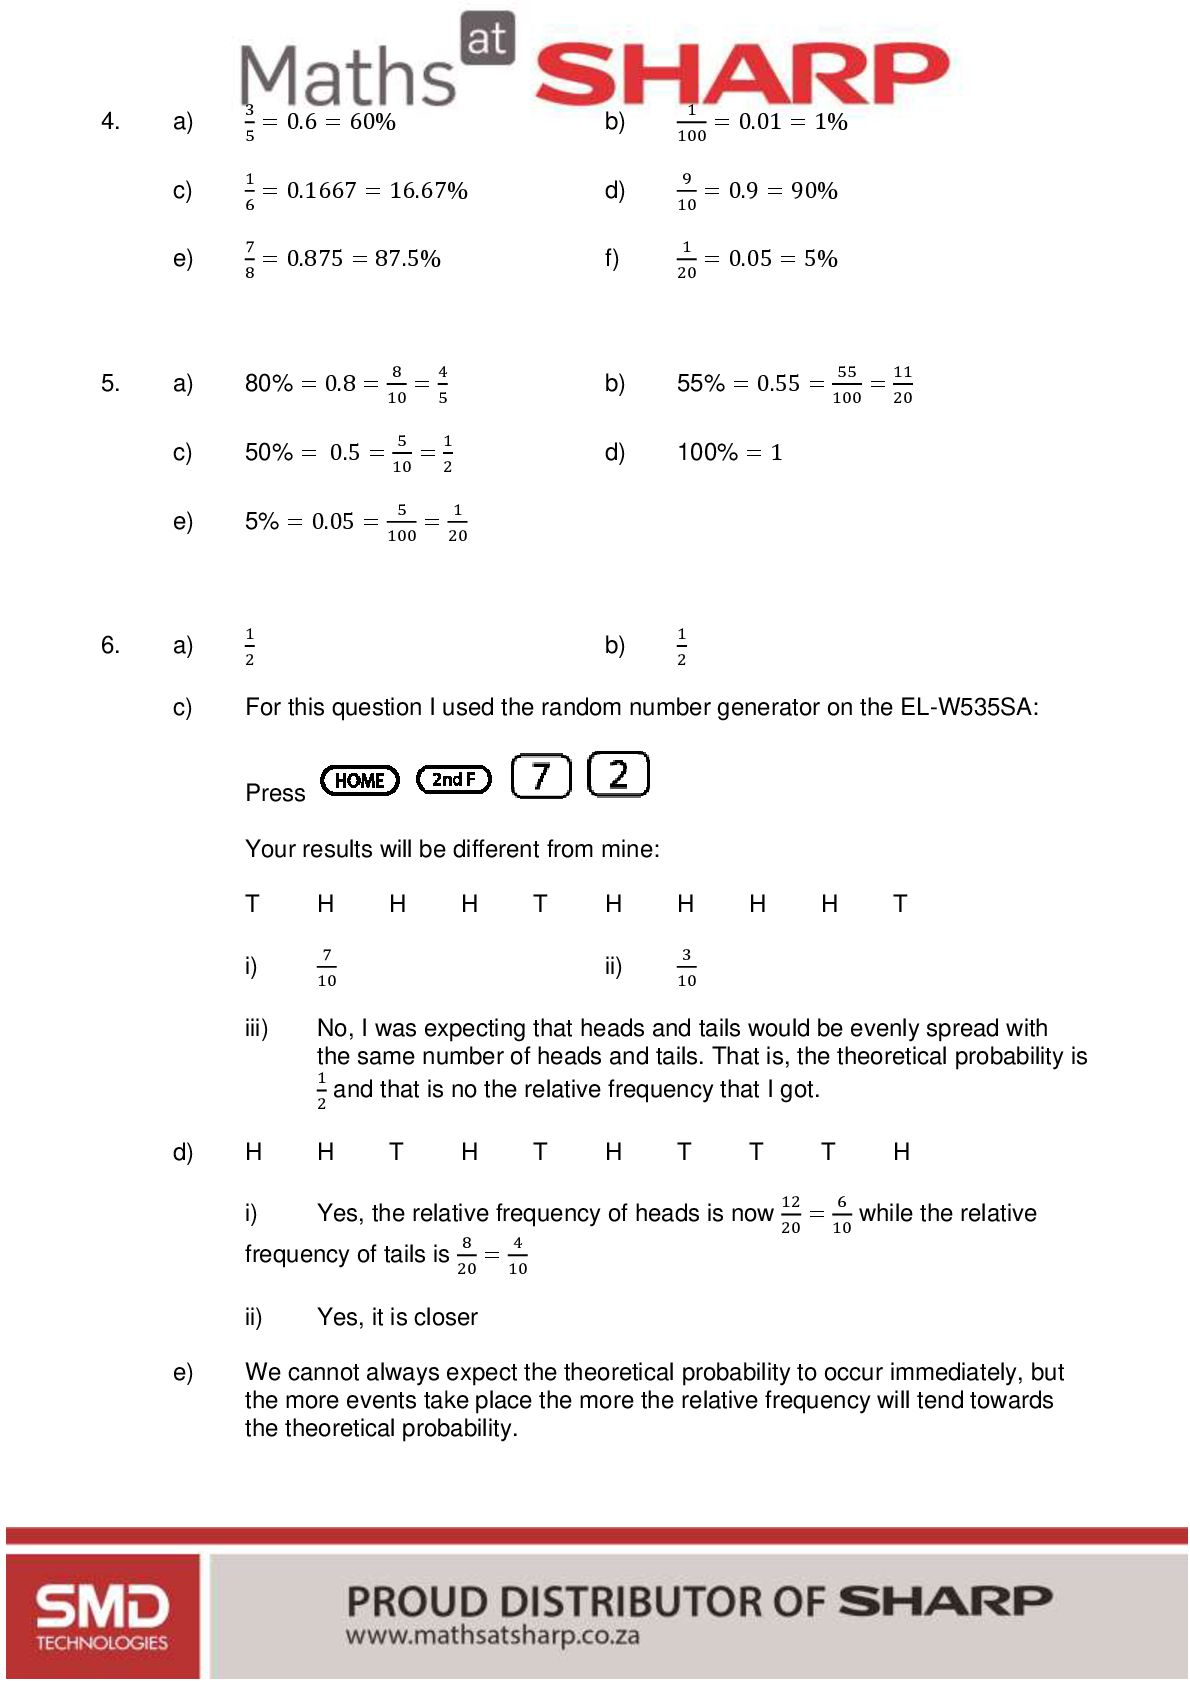
60% b) = 0.1667 = 16.67% 6 d) 5 1 7 8 = 0.875 = 87.5% f) 8 4 5 1 5 1 a) 80% = 0.8 = 10 = 5 c) 50% = 0.5 = 10 = 2 e) 5% = 0.05 = 100 = 20 a) c) 1 9 10 1 20 = 0.01 = 1% = 0.9 = 90% = 0.05 = 5% 55 11 b) 55% = 0.55 = 100 = 20 d) 100% = 1 b) 2 1 100 1 2 For this question I used the random number generator on the EL-W535SA: Press Your results will be different from mine: T i) d) H H H T 7 H ii) 10 H H H T 3 10 iii) No, I was expecting that heads and tails would be evenly spread with the same number of heads and tails. That is, the theoretical probability is 1 and that is no the relative frequency that I got. 2 H H i) Yes, the relative frequency of heads is now 20 = 10 while the relative T H T H T T T 12 8 H 6 4 frequency of tails is 20 = 10 ii) e) Yes, it is closer We cannot always expect the theoretical probability to occur immediately, but the more events take place the more the relative frequency will tend towards the theoretical probability.


 alisontutors23
 baltimoreniso
 adeputra13
 cbtlibrary
 bvr7352
 aisw77
 koheihasebe
 yatabe
 akiraasano
 minecr
 gmoriki
 madhuri28
 wayneb77
 rkendrick25
 addyosmani
 quramy
 garrettdimon
 nmsamuel
 portentint
 tmiket
 inesmontani
 colly
 deanohume
 helenjbeal