Share
Embed
GRADE 9 LINE GRAPHS
These are questions on Line Graphs . They involve drawing and interpretation of line graphs
Alison Tutors PRO
October 19, 2026
Transcript
8 slides
-
Name: Exam Style Questions Ensure you have: Pencil, pen, ruler,
protractor, pair of compasses and eraser You may use tracing paper if needed Guidance 1. Read each question carefully before you begin answering it. 2. Donʼt spend too long on one question. 3. Attempt every question. 4. Check your answers seem right. 5. Always show your workings Revision for this topic © Corbettmaths 2015 -
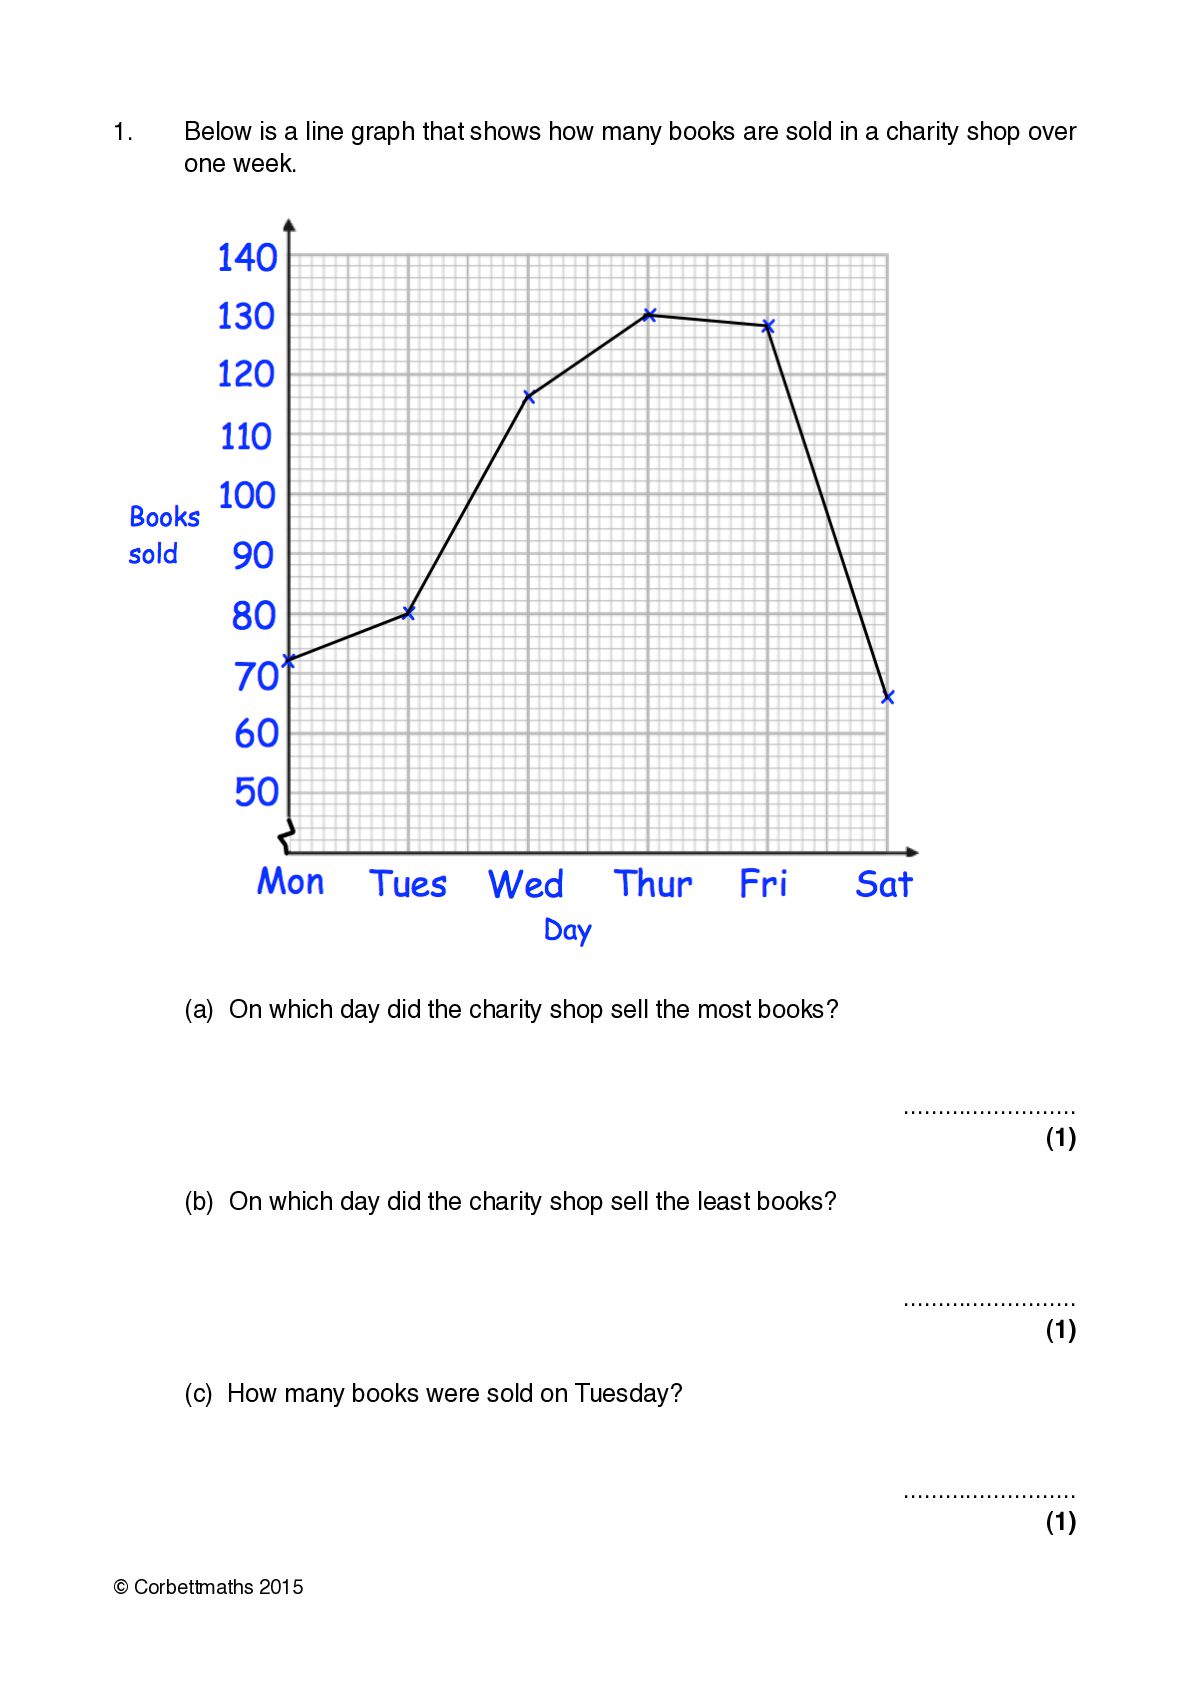
1.! ! Below is a line graph that shows how
many books are sold in a charity shop over one week. ! (a) On which day did the charity shop sell the most books? ......................... (1) ! (b) On which day did the charity shop sell the least books? ......................... (1) ! (c) How many books were sold on Tuesday? ......................... (1) © Corbettmaths 2015 -
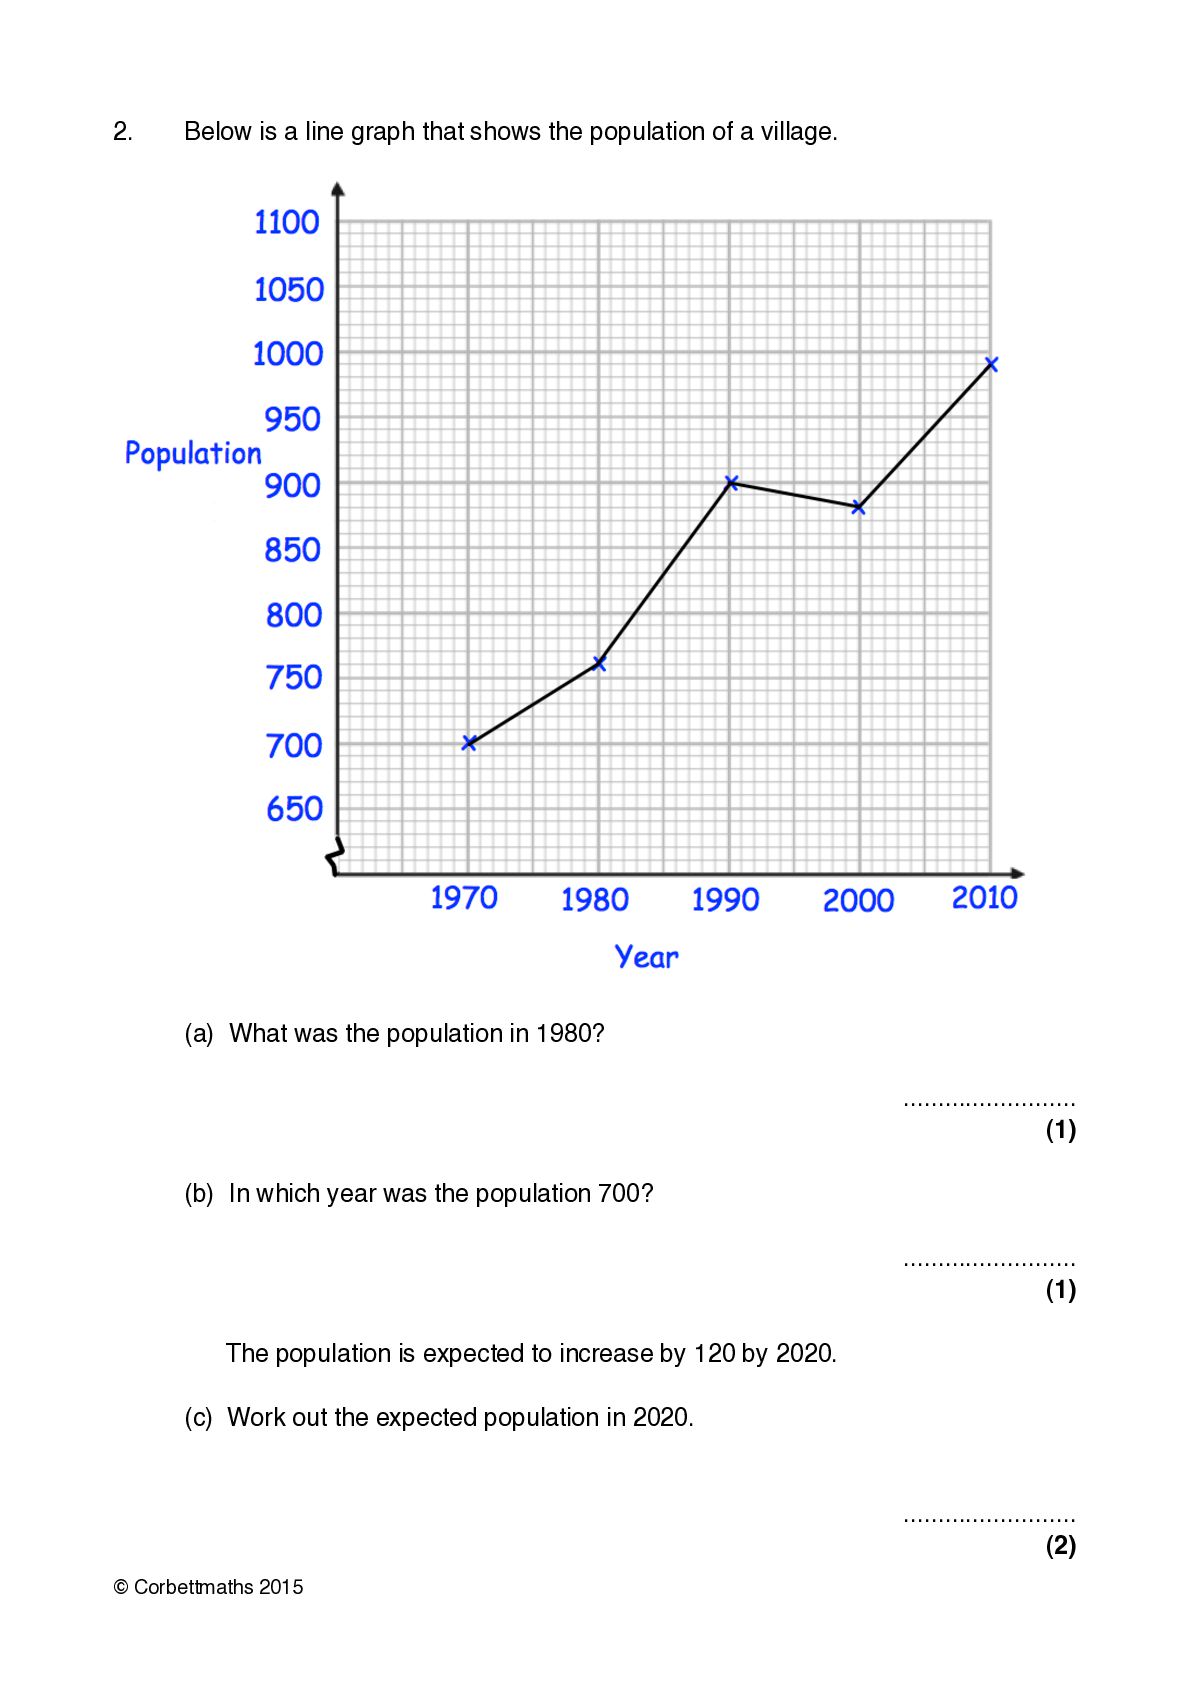
2.! Below is a line graph that shows the population
of a village. ! (a) What was the population in 1980? ......................... (1) ! (b) In which year was the population 700? ......................... (1) ! ! The population is expected to increase by 120 by 2020. (c) Work out the expected population in 2020. ......................... (2) © Corbettmaths 2015 -
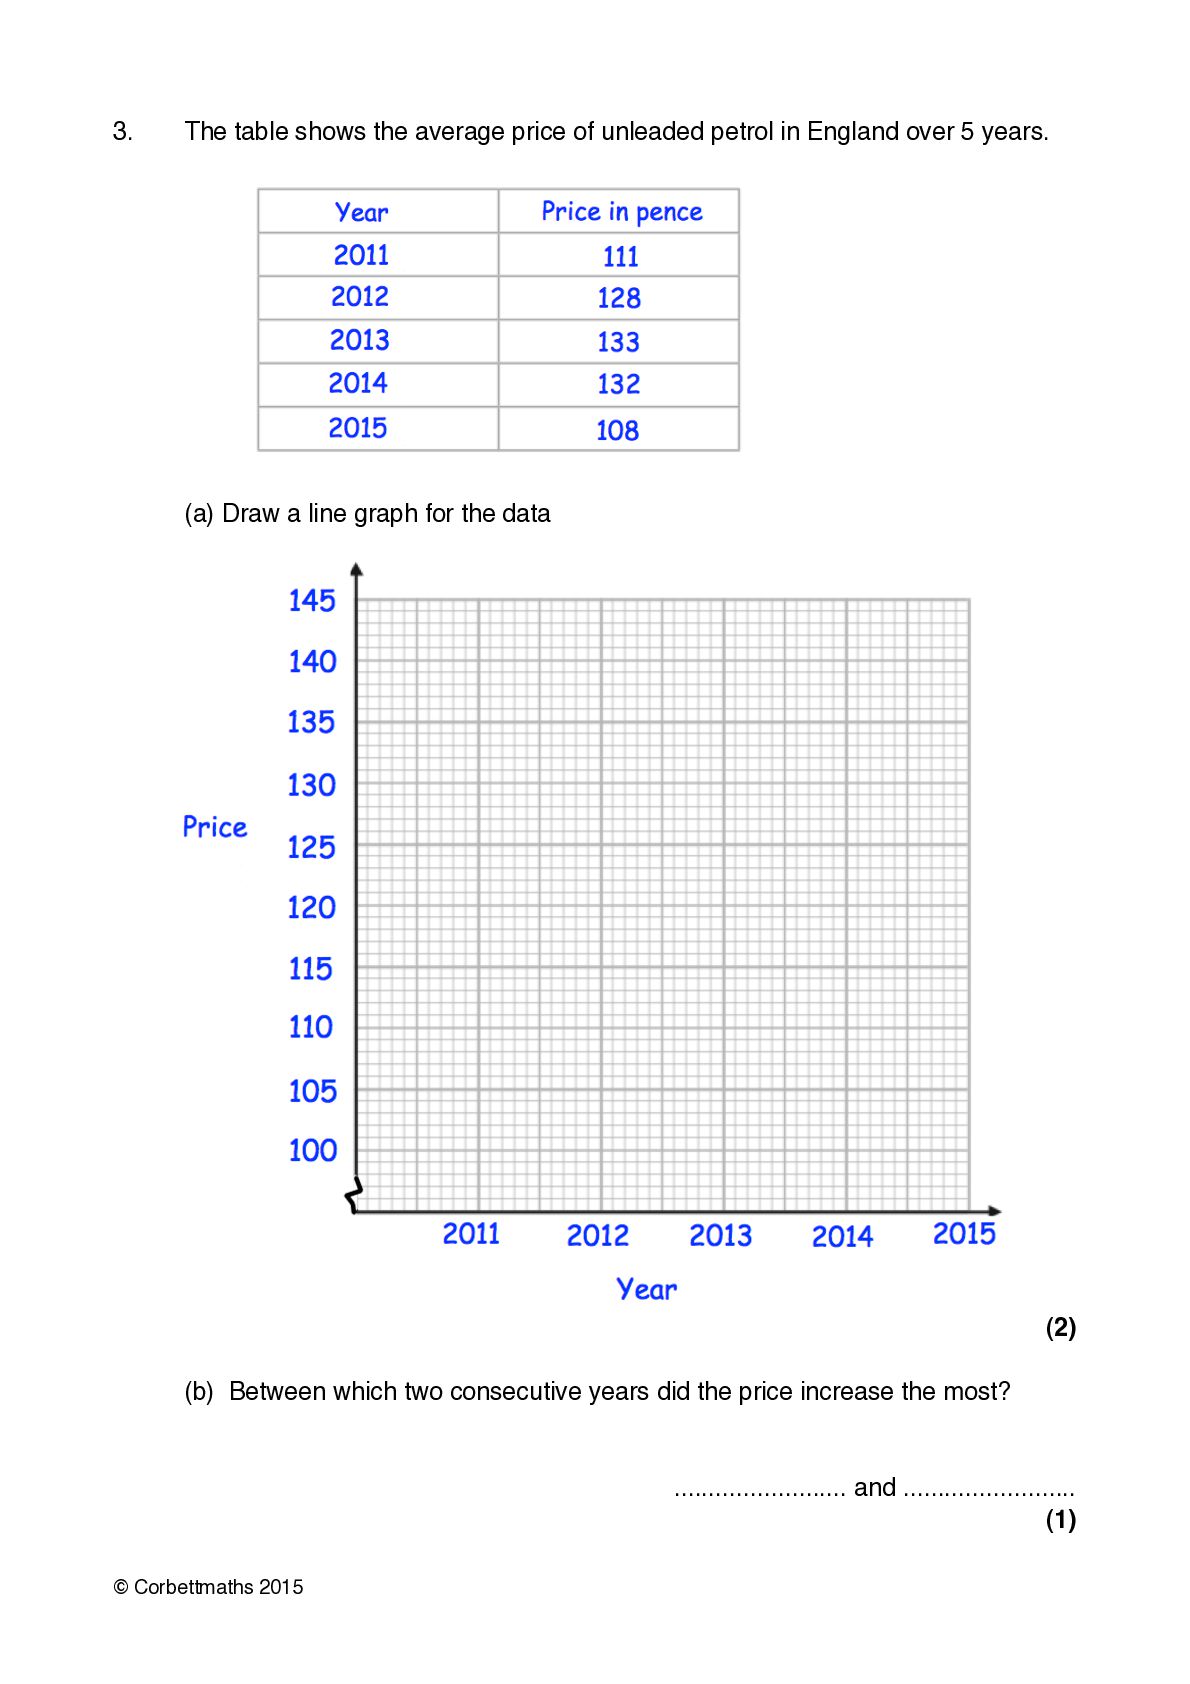
3.! The table shows the average price of unleaded petrol
in England over 5 years. ! ! ! (a) Draw a line graph for the data (2) ! (b) Between which two consecutive years did the price increase the most? ......................... and ......................... (1) © Corbettmaths 2015 -
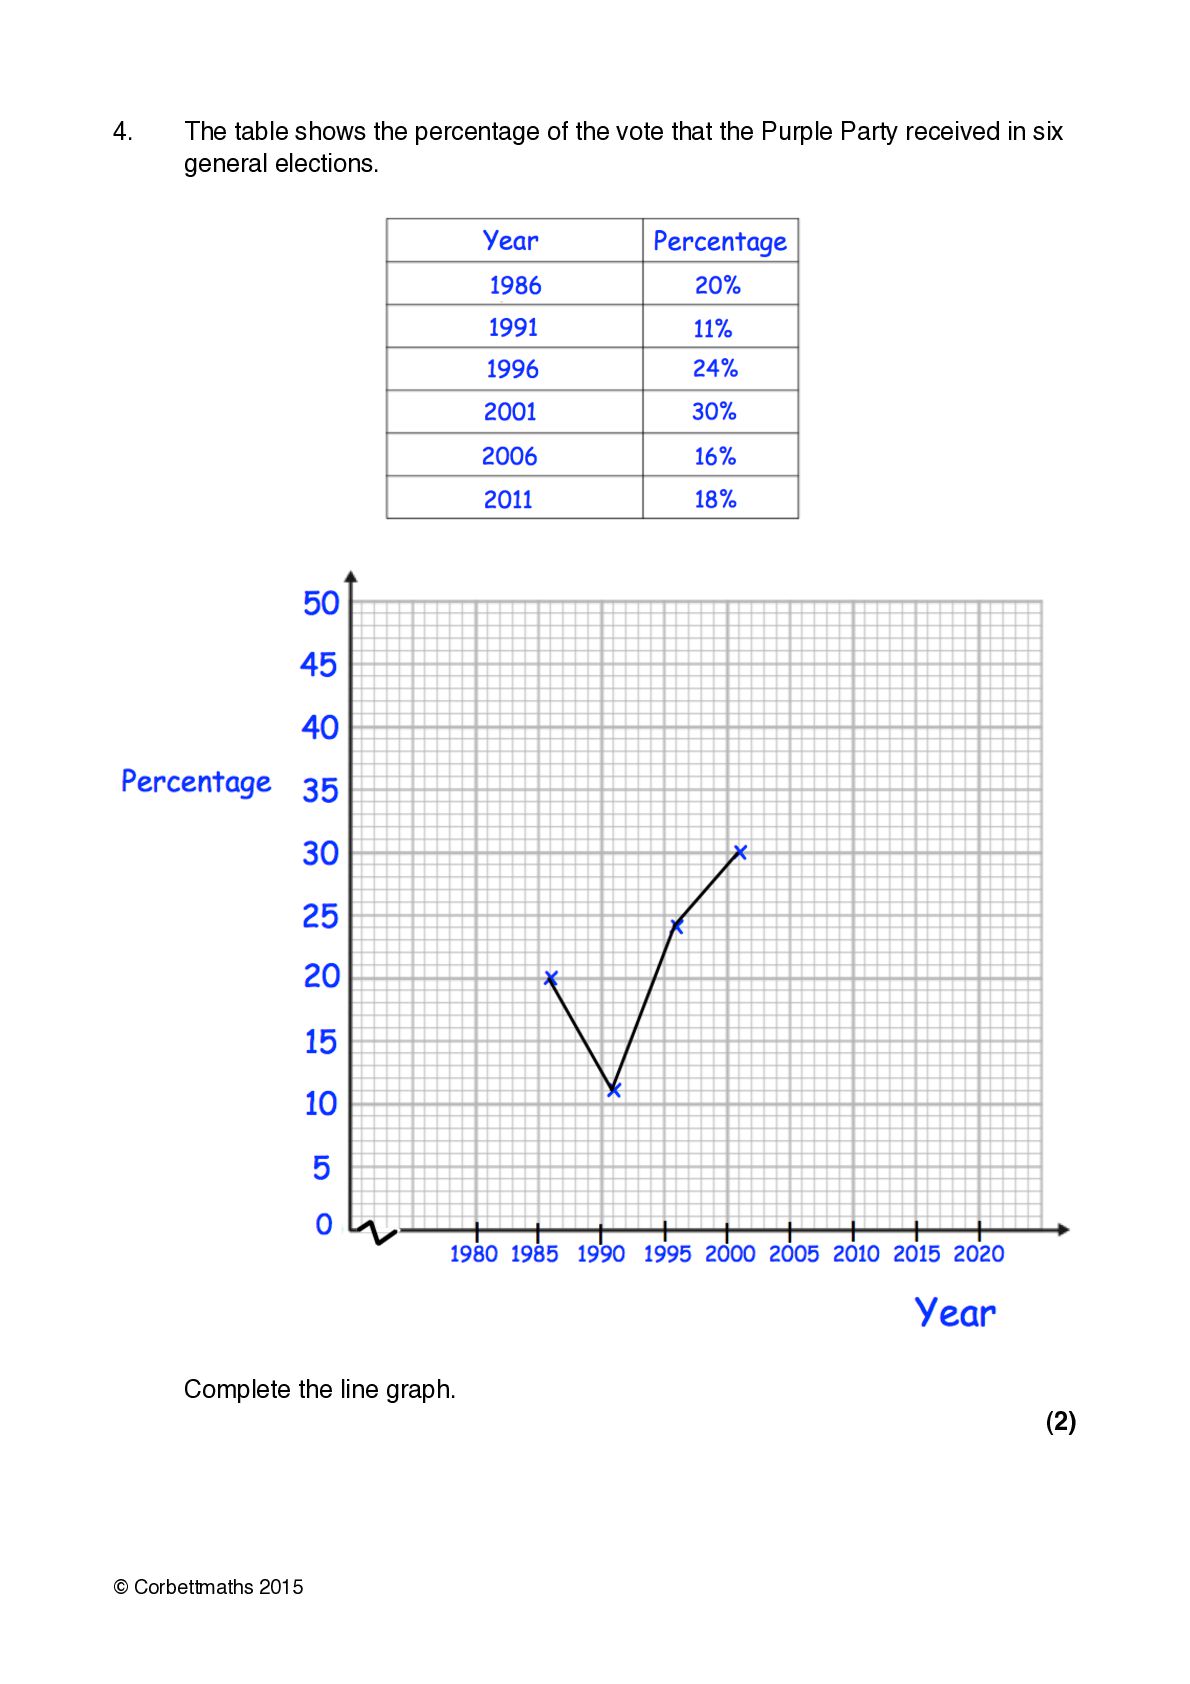
4.! ! The table shows the percentage of the vote
that the Purple Party received in six general elections. ! Complete the line graph. (2) © Corbettmaths 2015 -
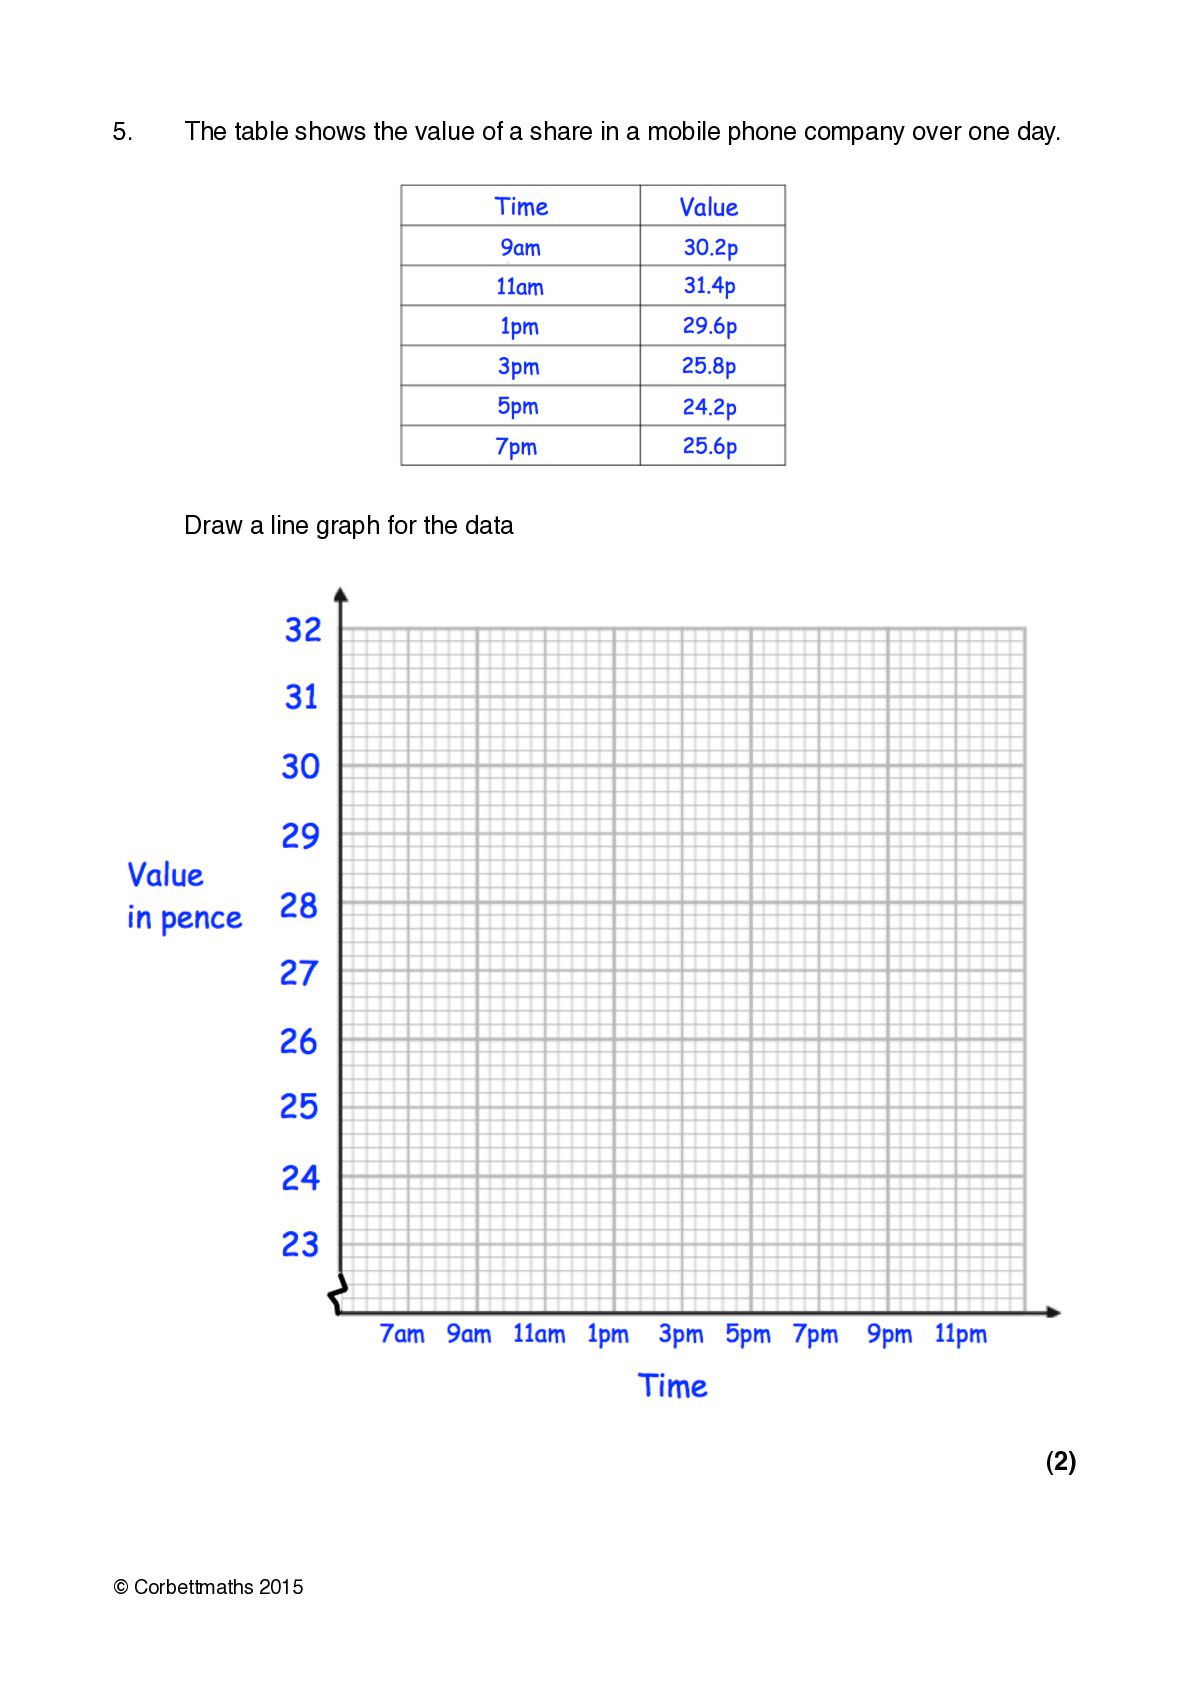
5.! The table shows the value of a share in
a mobile phone company over one day. ! Draw a line graph for the data (2) © Corbettmaths 2015 -
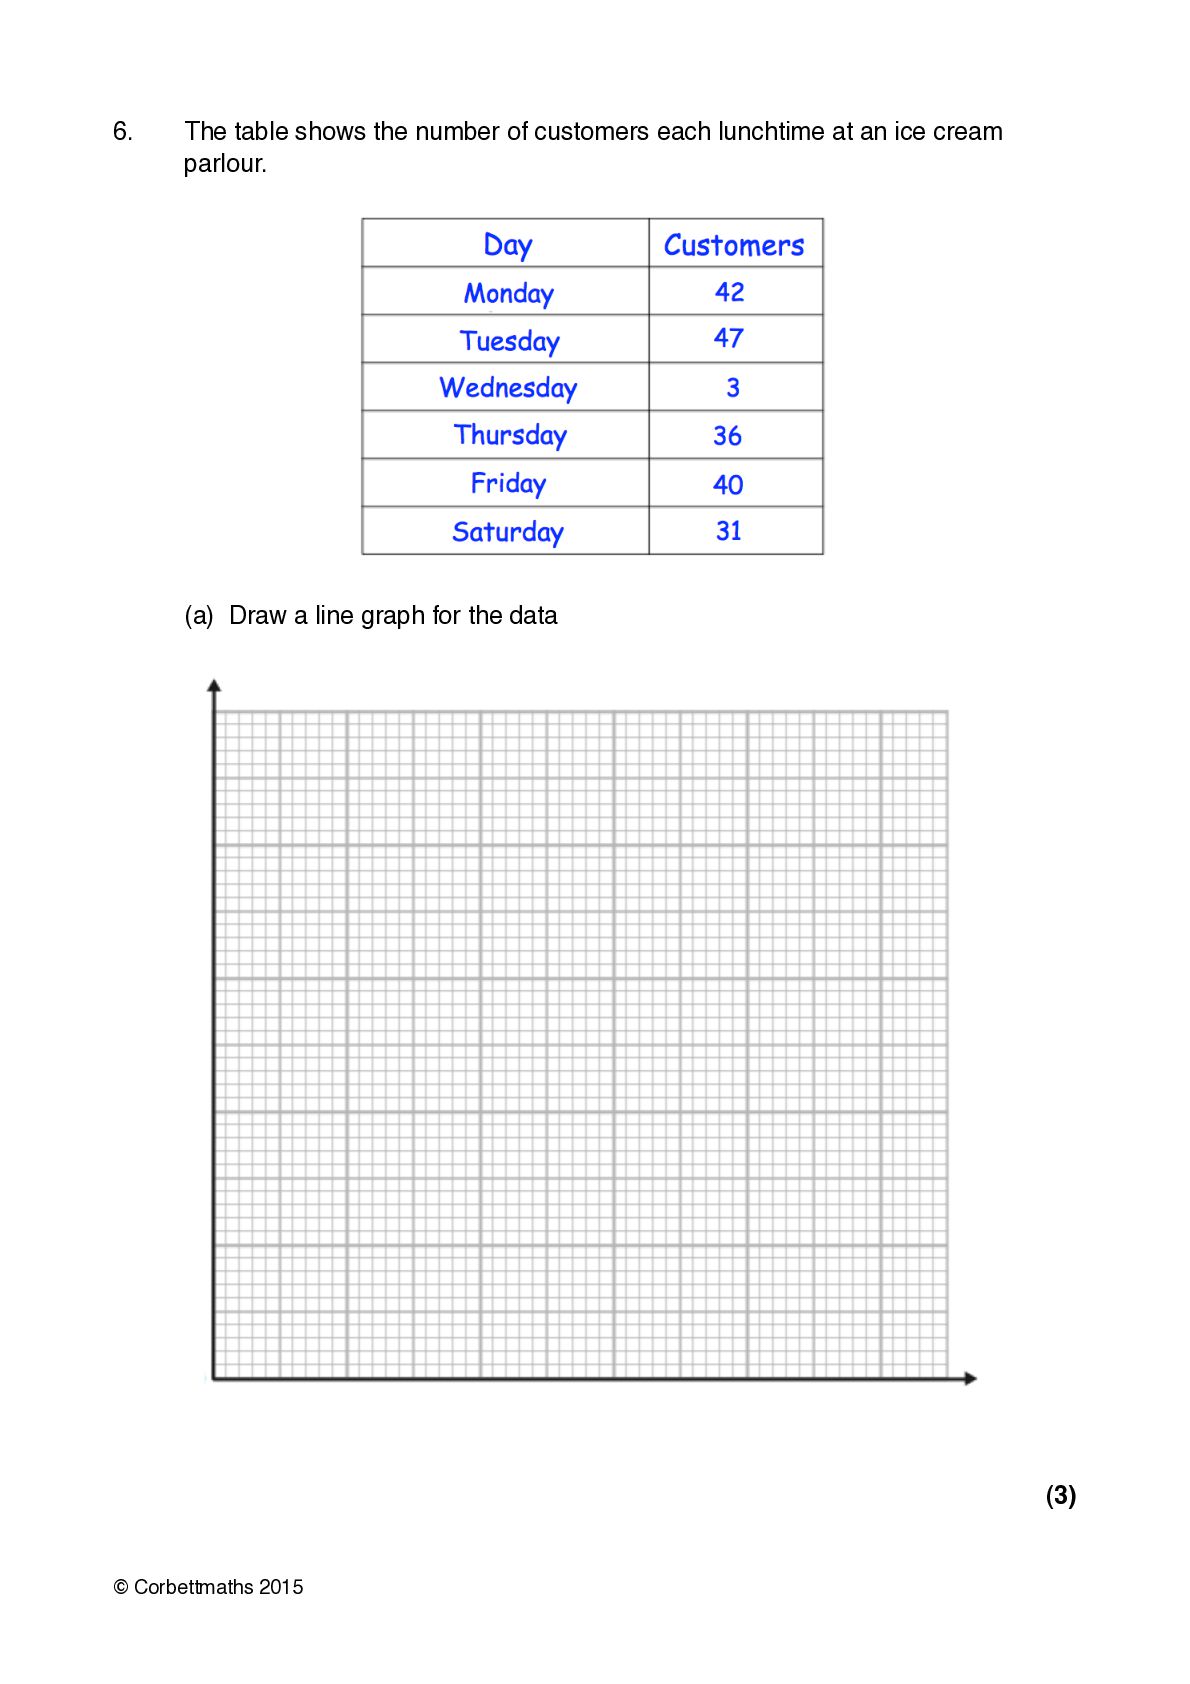
6.! ! The table shows the number of customers each
lunchtime at an ice cream parlour. ! (a) Draw a line graph for the data (3) © Corbettmaths 2015 -
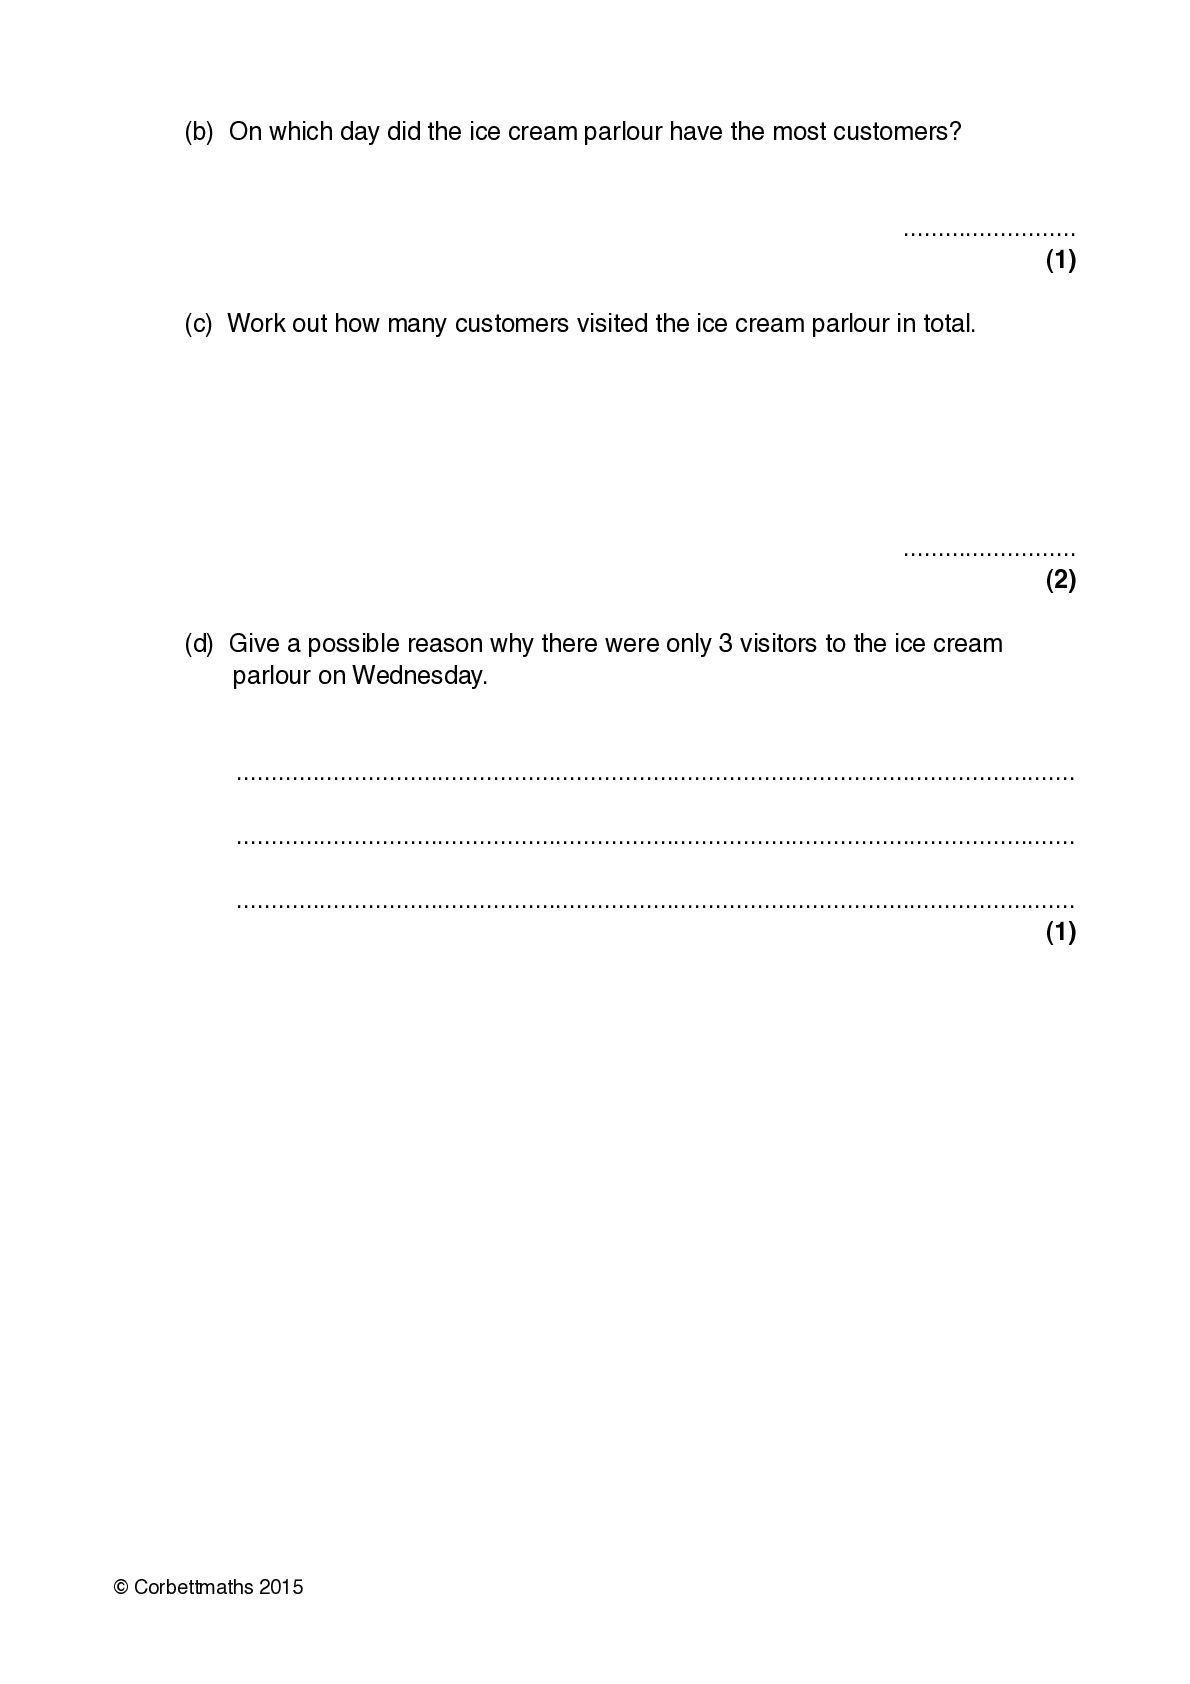
! (b) On which day did the ice cream parlour
have the most customers? ......................... (1) ! (c) Work out how many customers visited the ice cream parlour in total. ......................... (2) ! ! (d) Give a possible reason why there were only 3 visitors to the ice cream parlour on Wednesday. ......................................................................................................................... ......................................................................................................................... ......................................................................................................................... (1) © Corbettmaths 2015