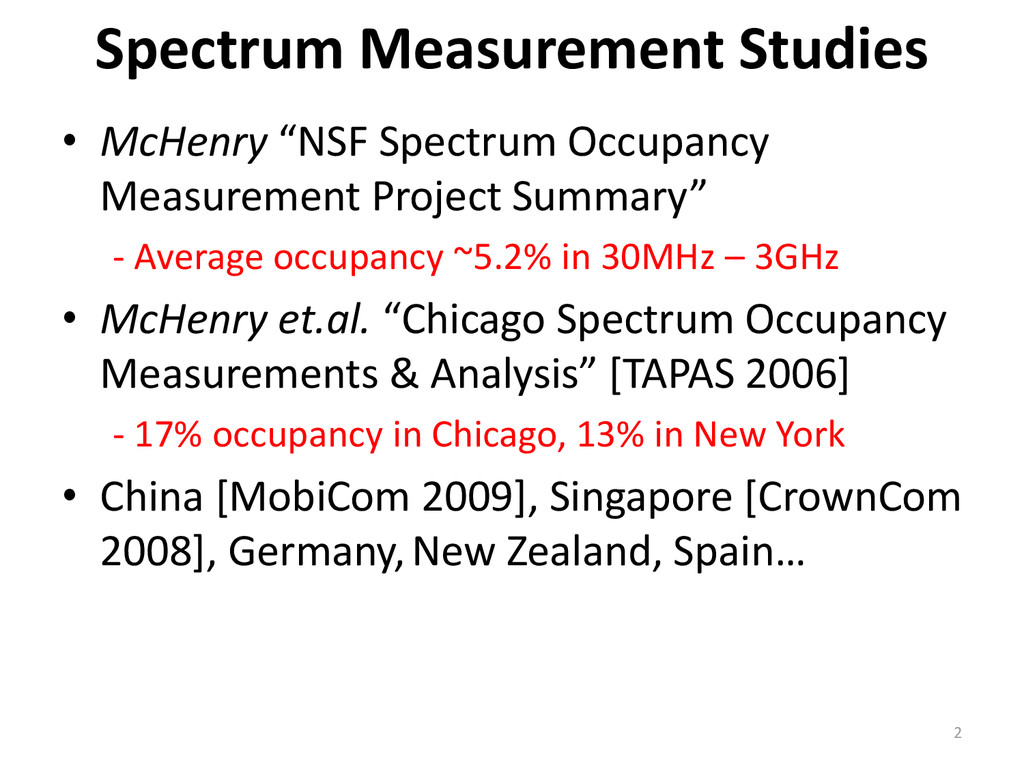
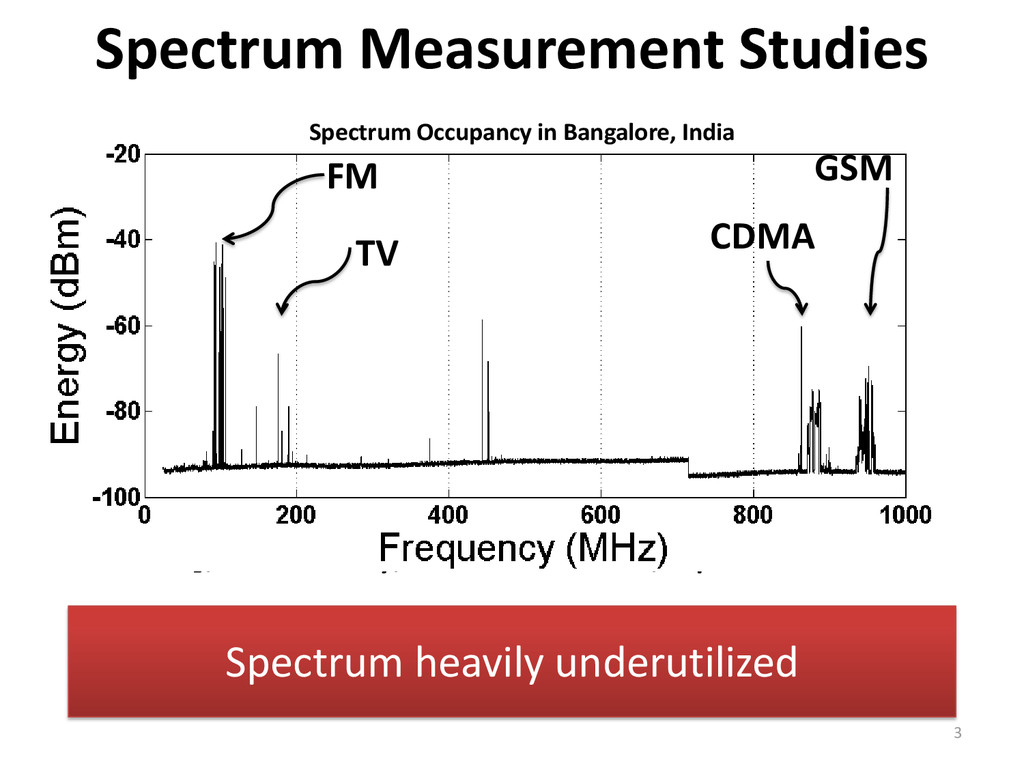
occupancy ~5.2% in 30MHz – 3GHz • McHenry et.al. “Chicago Spectrum Occupancy Measurements & Analysis” [TAPAS 2006] - 17% occupancy in Chicago, 13% in New York • China [MobiCom 2009], Singapore [CrownCom 2008], Germany, New Zealand, Spain… Spectrum Measurement Studies Spectrum heavily underutilized 3 FM TV GSM CDMA Spectrum Occupancy in Bangalore, India
Till date, only the US has allowed OSA • Represent static spectrum occupancy - Future OSA devices may require dynamic spatio-temporal occupancy information • Through evaluation of OSA proposals from the research community is hard - Little or no access to real-world data from cross-geographic locations However… 5
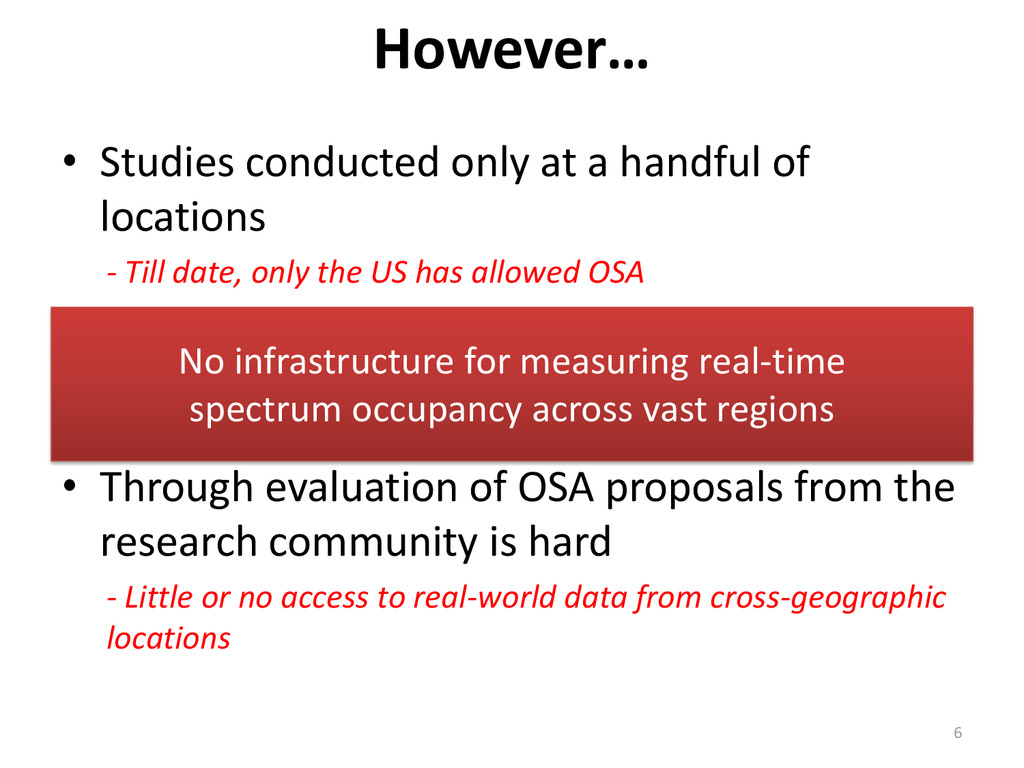
Till date, only the US has allowed OSA • Represent static spectrum occupancy - Future OSA devices may require dynamic spatio-temporal occupancy information • Through evaluation of OSA proposals from the research community is hard - Little or no access to real-world data from cross-geographic locations However… 6 No infrastructure for measuring real-time spectrum occupancy across vast regions
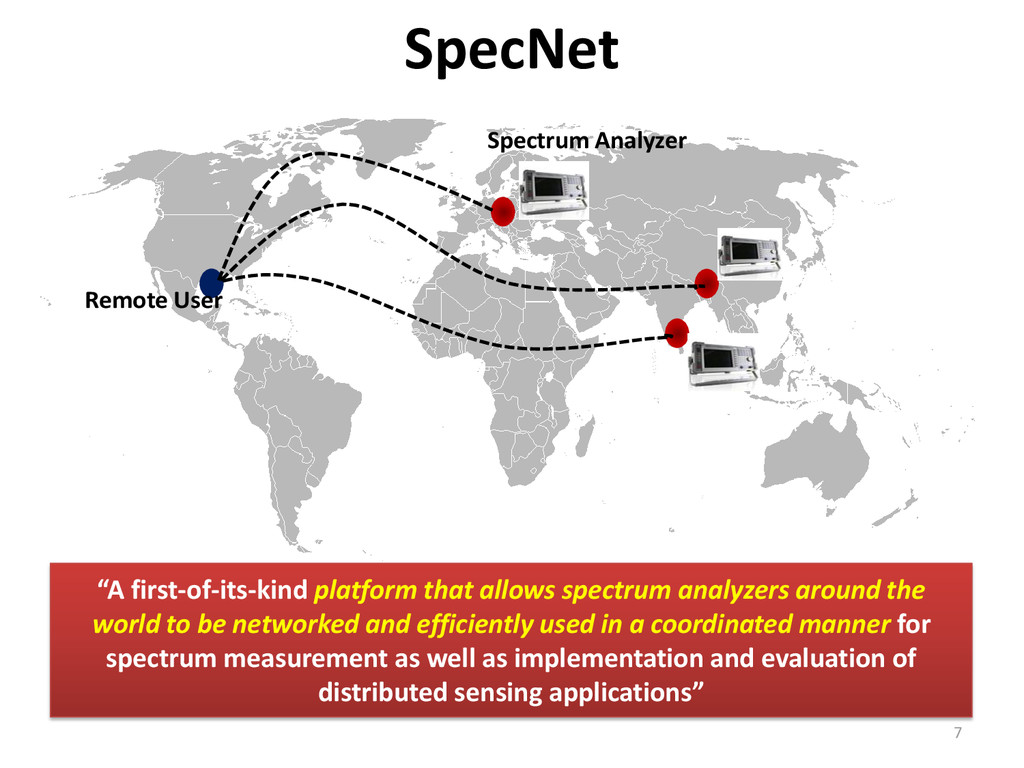
analyzers around the world to be networked and efficiently used in a coordinated manner for spectrum measurement as well as implementation and evaluation of distributed sensing applications” SpecNet 7
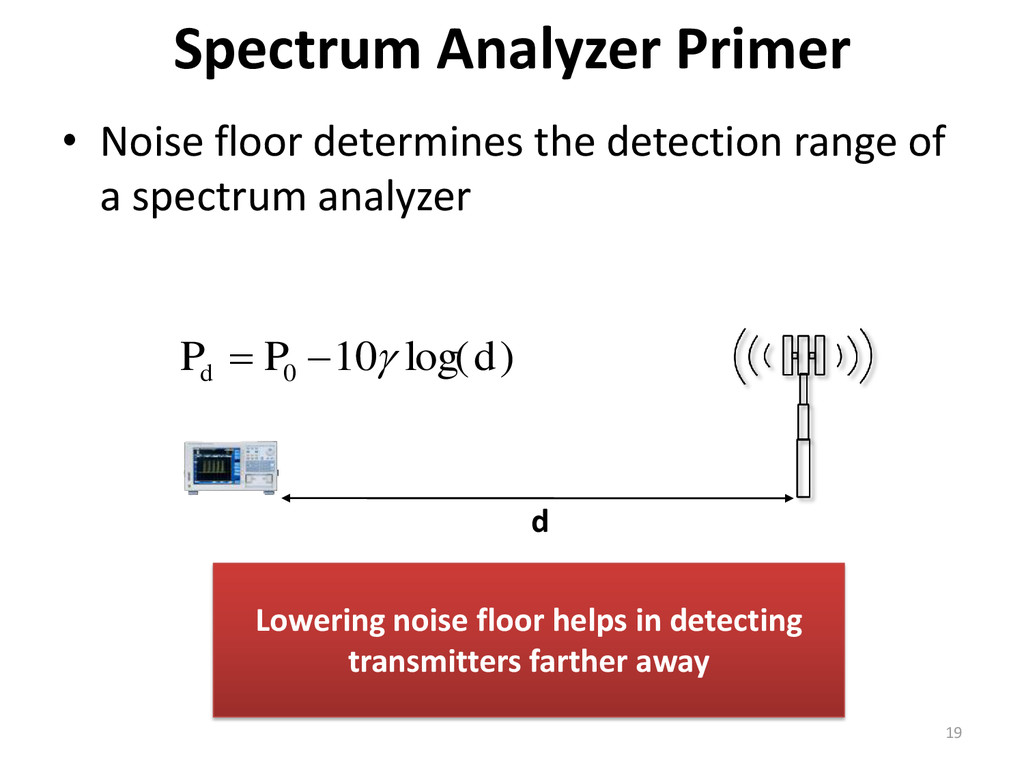
Frequency span (Q) and Resolution Bandwidth (RBW, ρ) Spectrum Analyzer Primer -120.00 -110.00 -100.00 -90.00 -80.00 -70.00 -60.00 -50.00 -40.00 702 702.1 702.2 702.3 702.4 Received Signal Power (dBm) Frequency (MHz) 1MHz 30KHz 10KHz 1KHz 16 Noise Floor Lowering RBW reveals details about the signal, and lowers noise floor
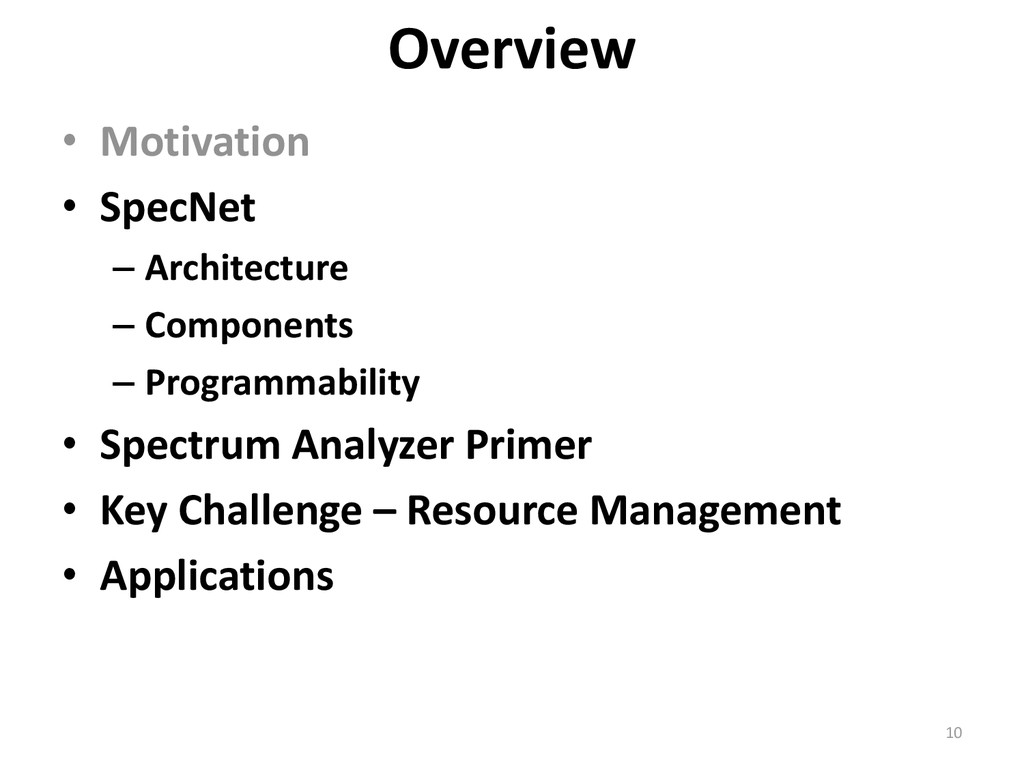
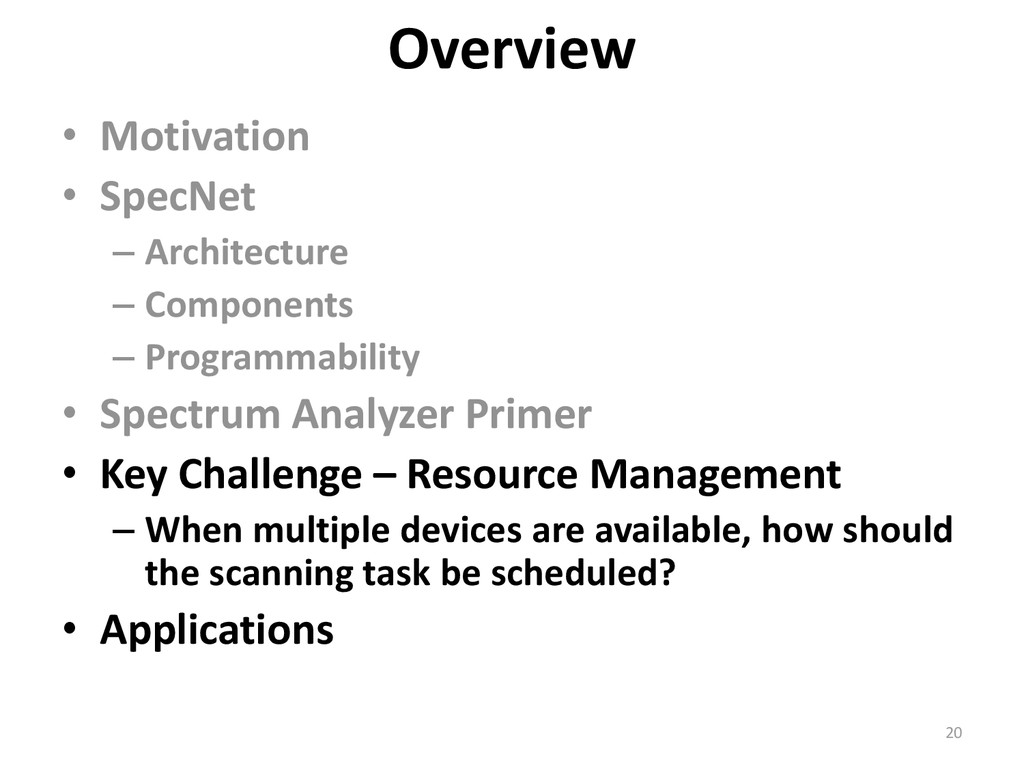
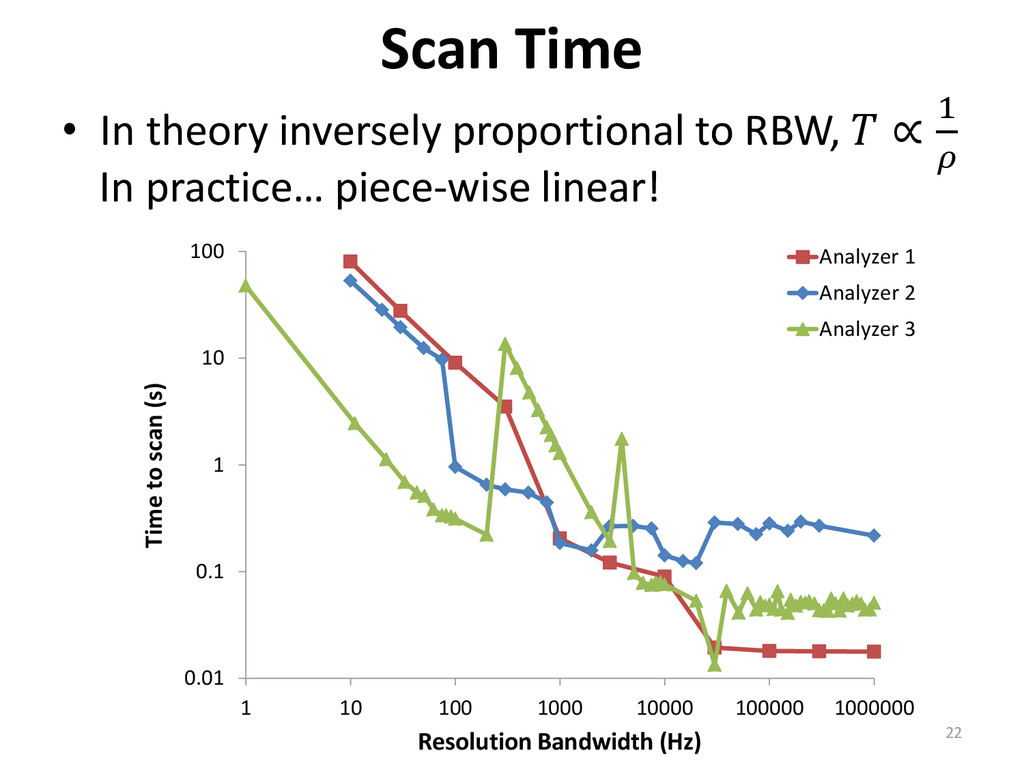
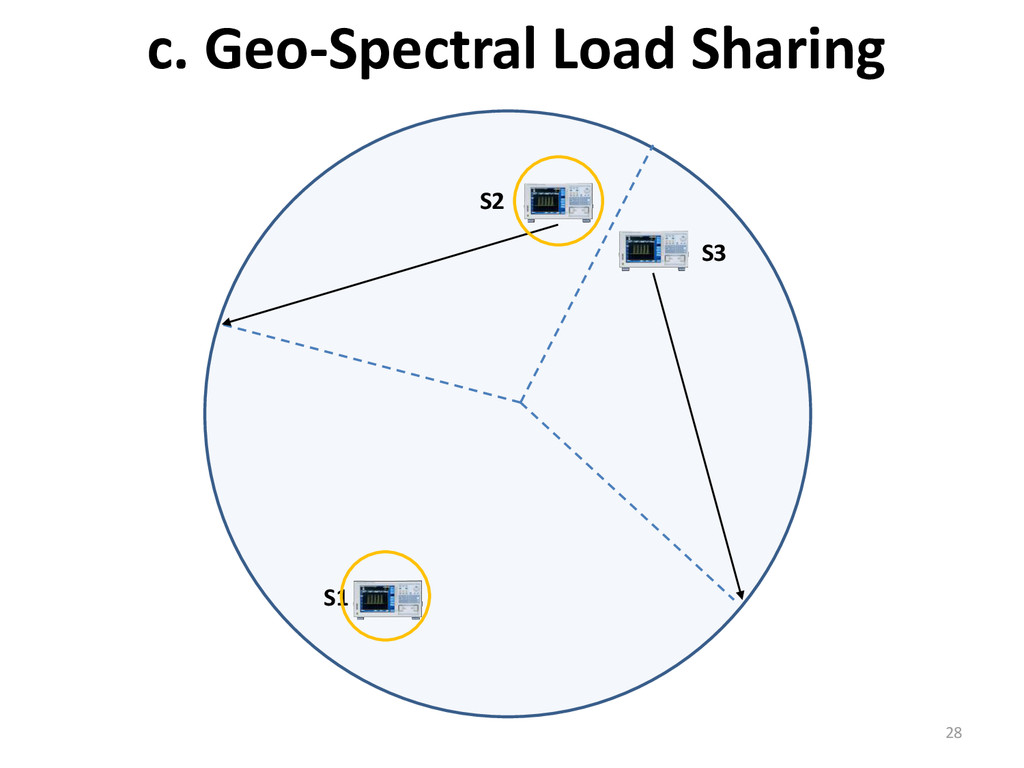
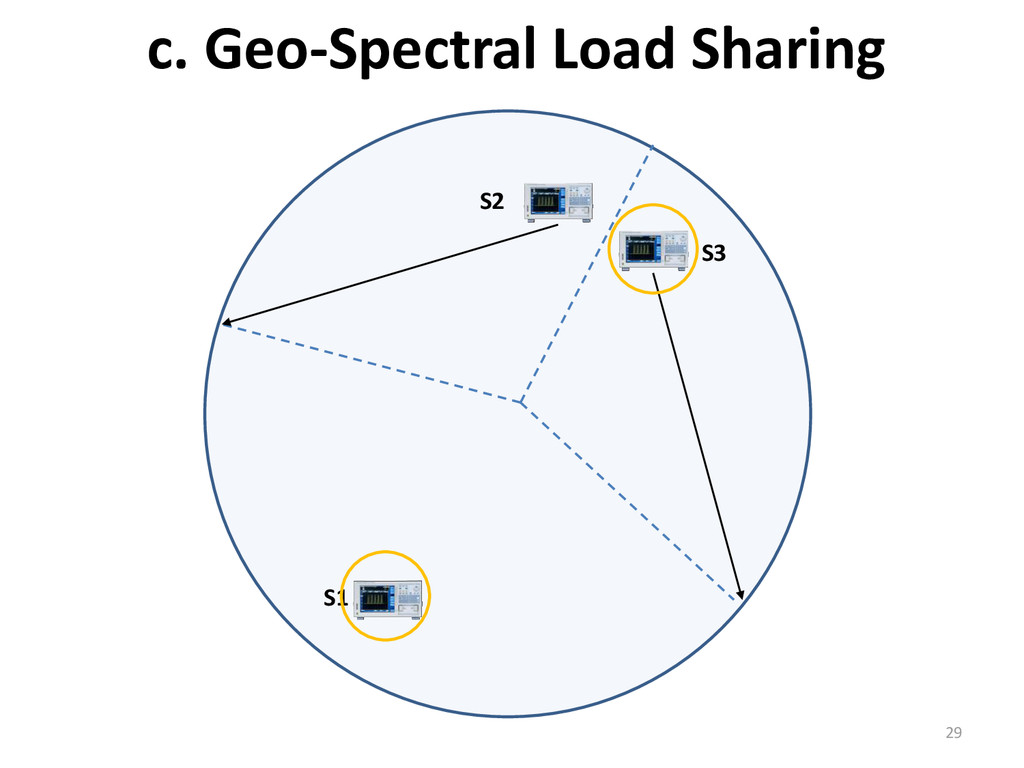
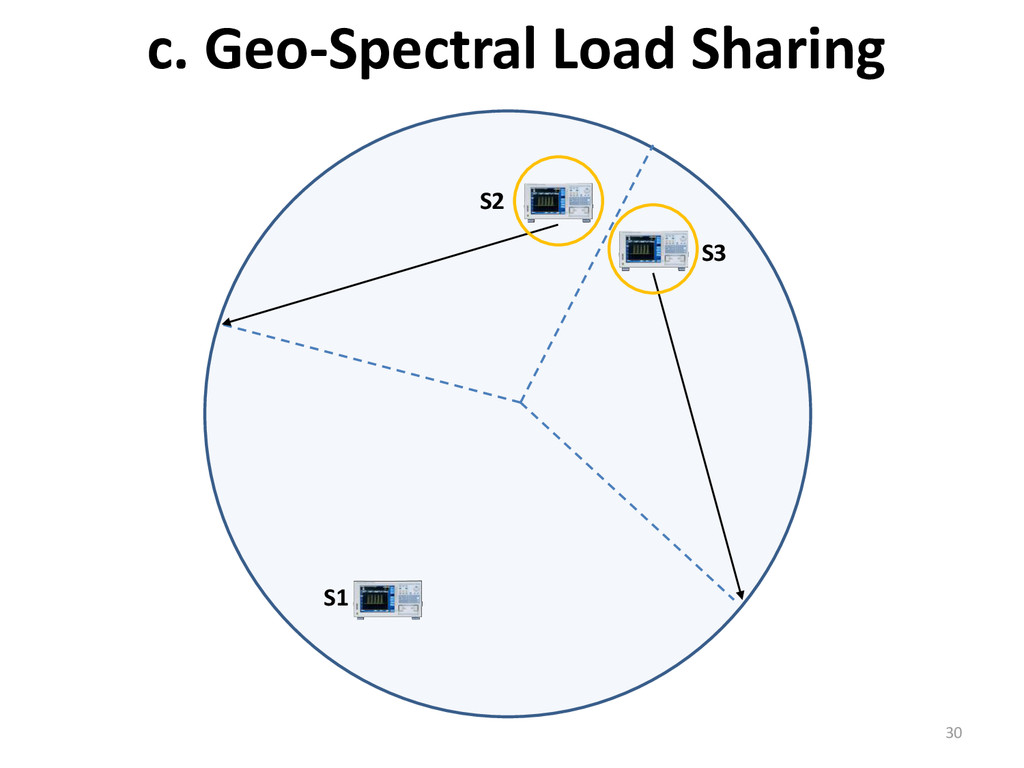
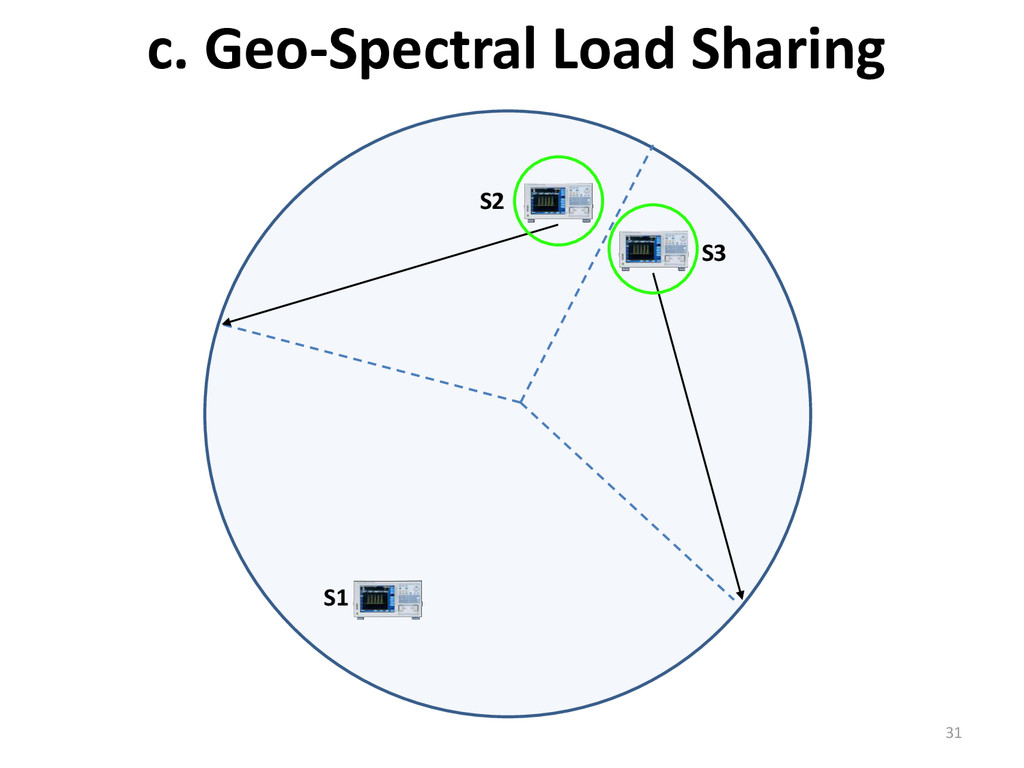
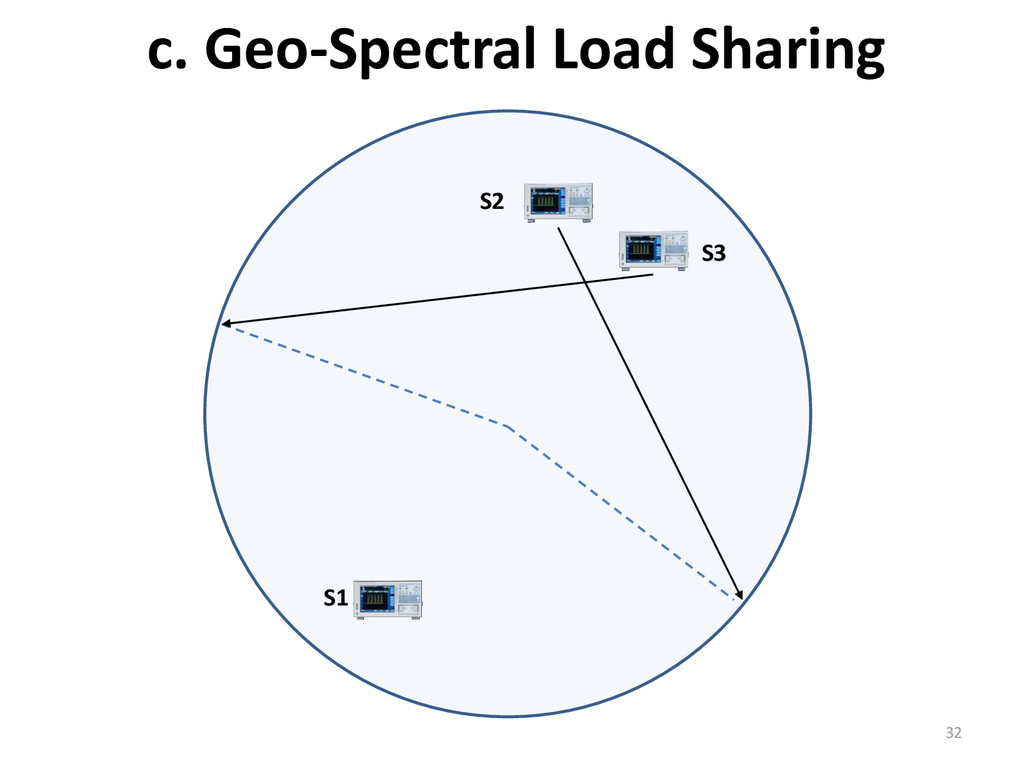
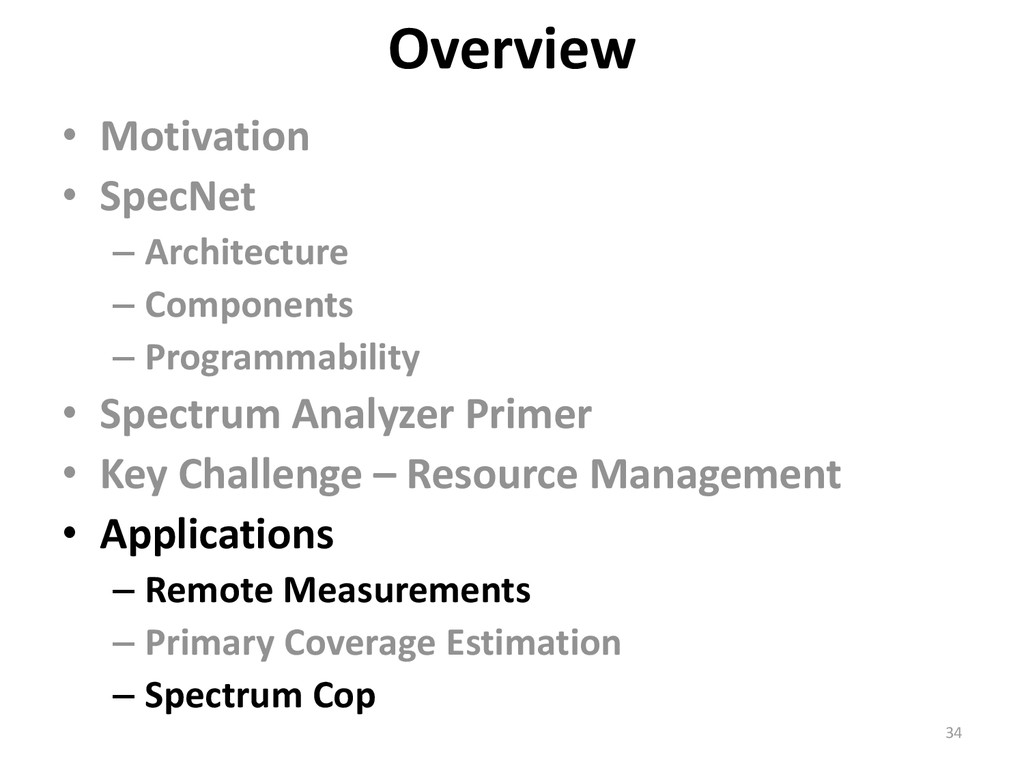
• Spectrum Analyzer Primer • Key Challenge – Resource Management – When multiple devices are available, how should the scanning task be scheduled? • Applications Overview 20
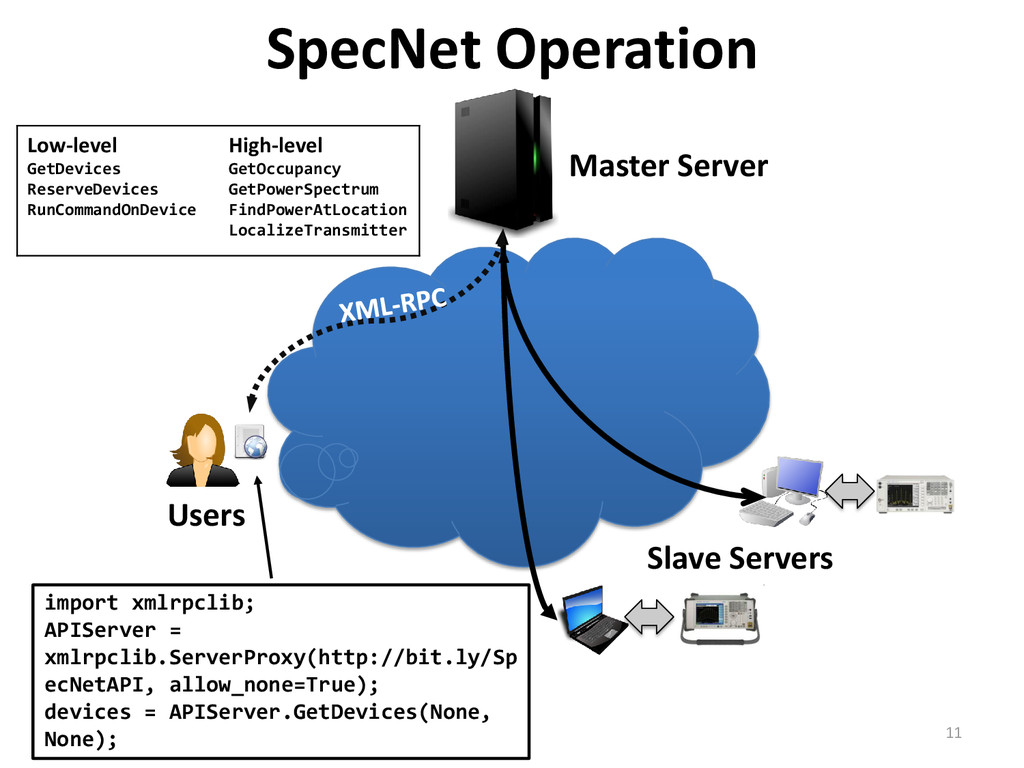
SpecNet maps the required noise floor to the resolution bandwidth • Schedules scan tasks at each analyzer • Runs the job and returns the results GetDevices([lat,lng,r]) GetPowerSpectrum(device_id,Fs,Fe,Nf) 35
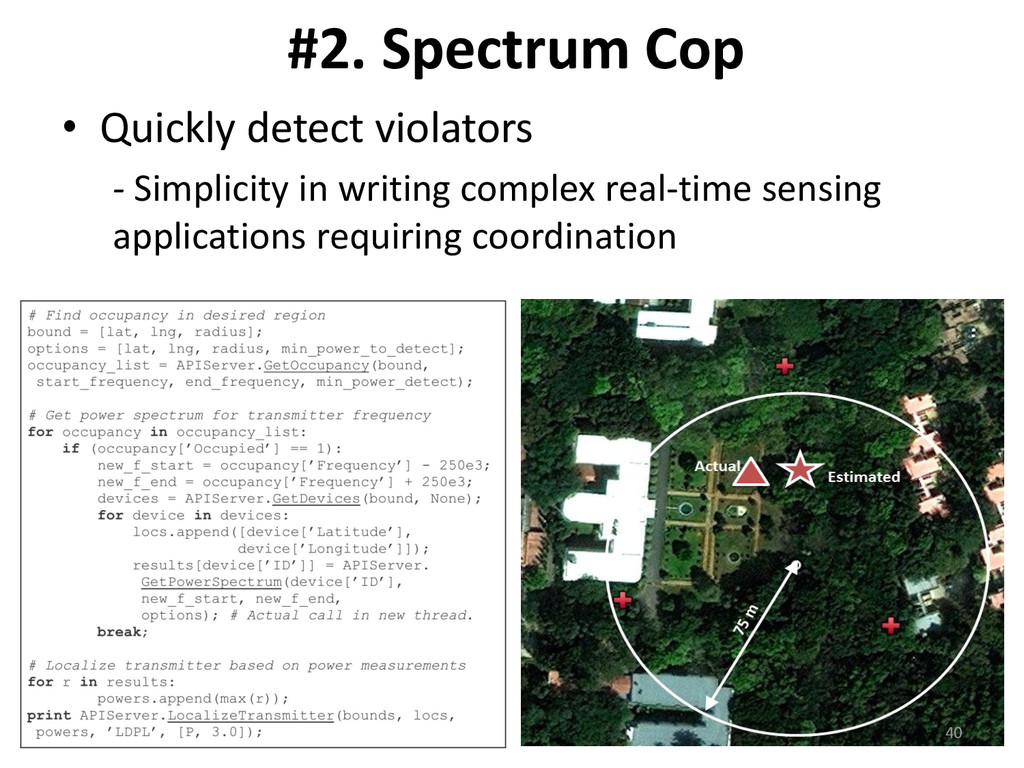
writing complex real-time sensing applications requiring coordination Use GetOccupancy to get an occupancy list in the desired frequency span For each occupied frequency band, do finer scans using GetPowerSpectrum by setting a lower RBW, Feed the results to LocalizeTransmitter to locate the transmitter. 39
academia and industry • Key requirement is a measurement infrastructure that provides real data • SpecNet fulfills this need by enabling a geographically distributed spectrum analyzer network SpecNet requests your participation! Please contact Anand Iyer ([email protected]) or Krishna Chintalapudi ([email protected]) http://bit.ly/SpecNet 42
![#1. Doing Simple Scans GetDevices([lat,lng,r]) GetPowerSpectrum(device_id,Fs,Fe,Nf) (Lat, Lng) r •](https://files.speakerdeck.com/presentations/7da521000aaf0132acd15e86903014cd/slide_34.jpg)