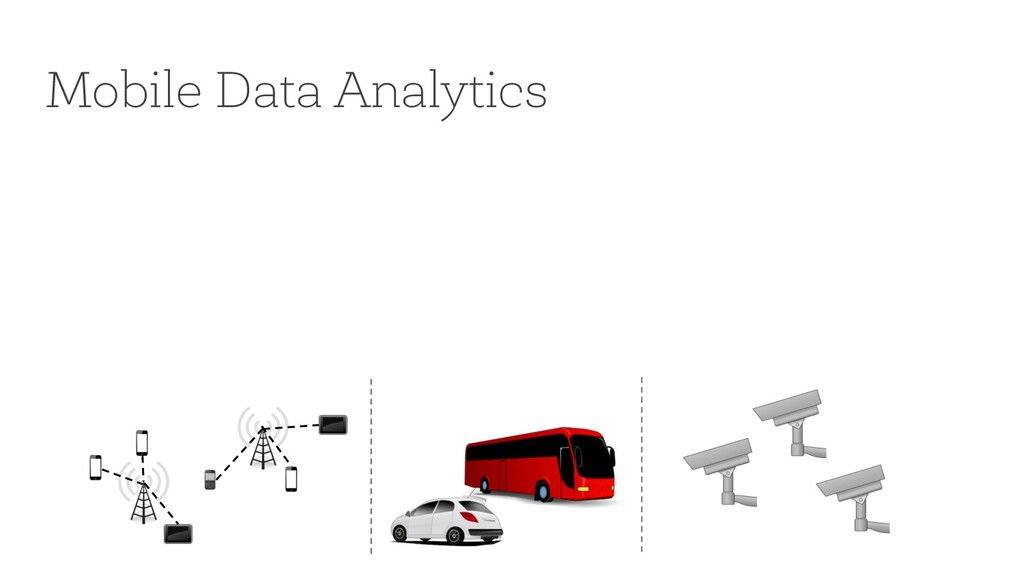
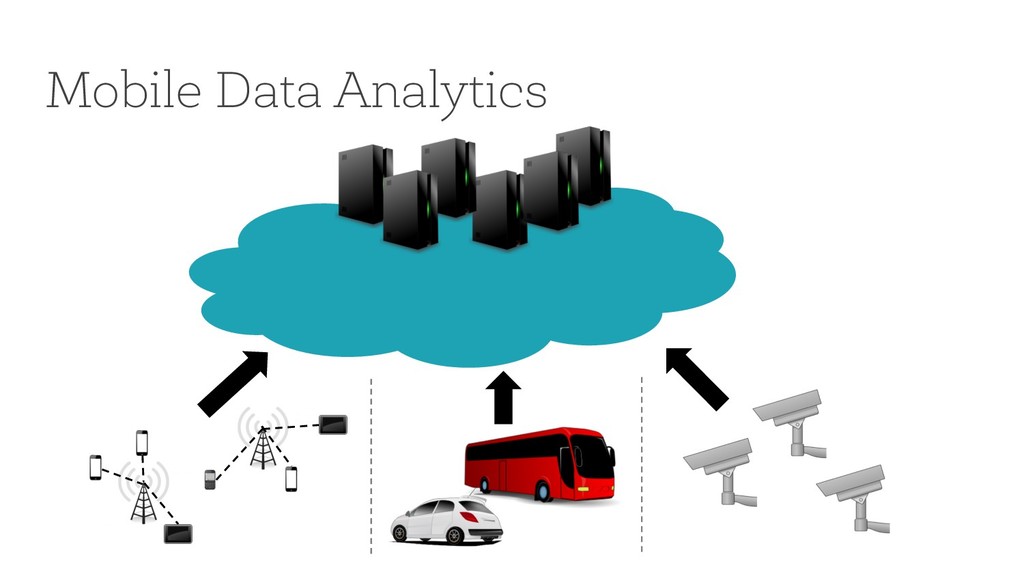
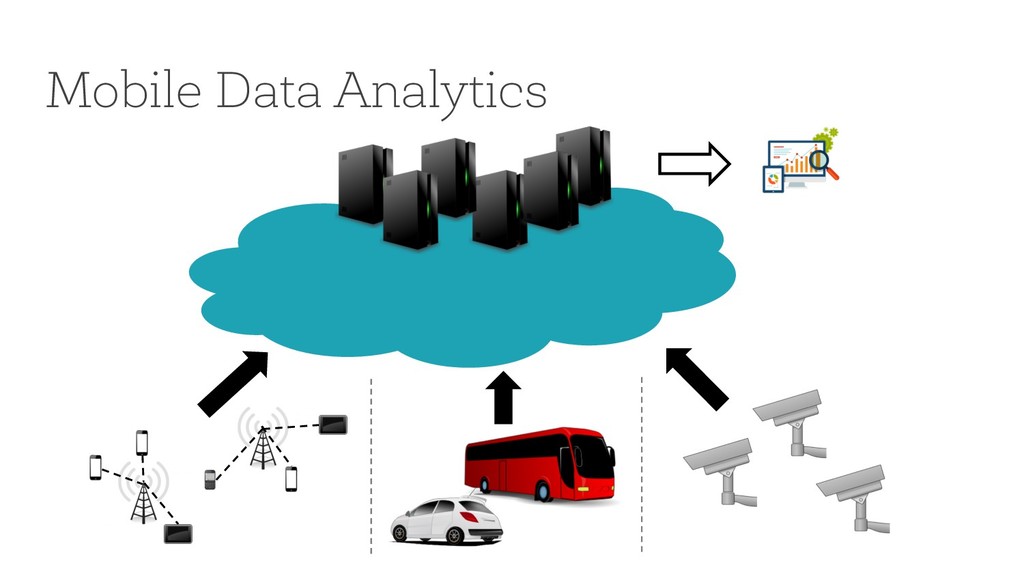
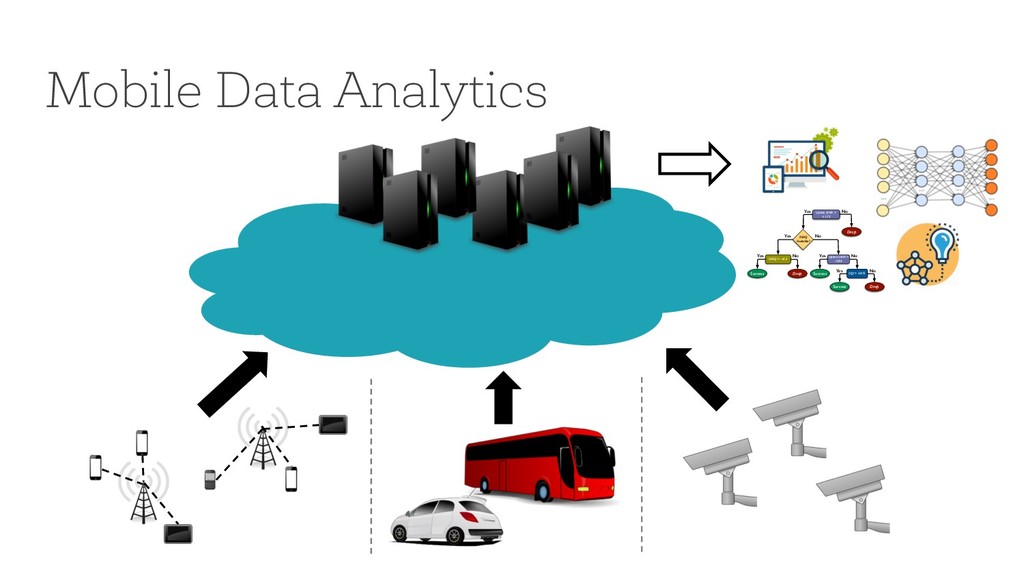
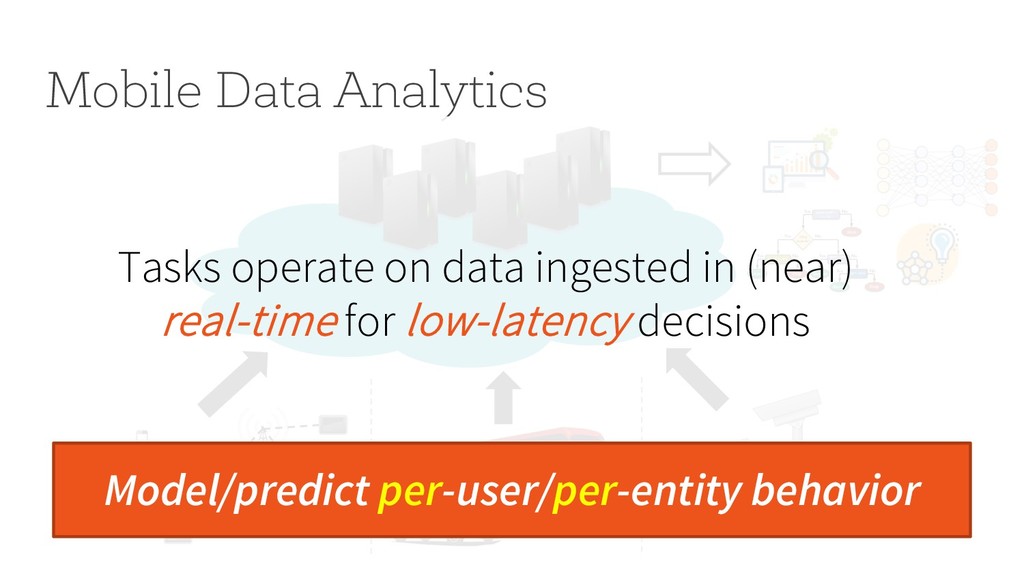
Drop Uplink SINR > -5.86 CQI > 5.875 Drop Drop Yes No Yes No No Yes Success No No Yes Yes Success Mobile Data Analytics Tasks operate on data ingested in (near) real-time for low-latency decisions
Drop Uplink SINR > -5.86 CQI > 5.875 Drop Drop Yes No Yes No No Yes Success No No Yes Yes Success Mobile Data Analytics Tasks operate on data ingested in (near) real-time for low-latency decisions Model/predict per-user/per-entity behavior
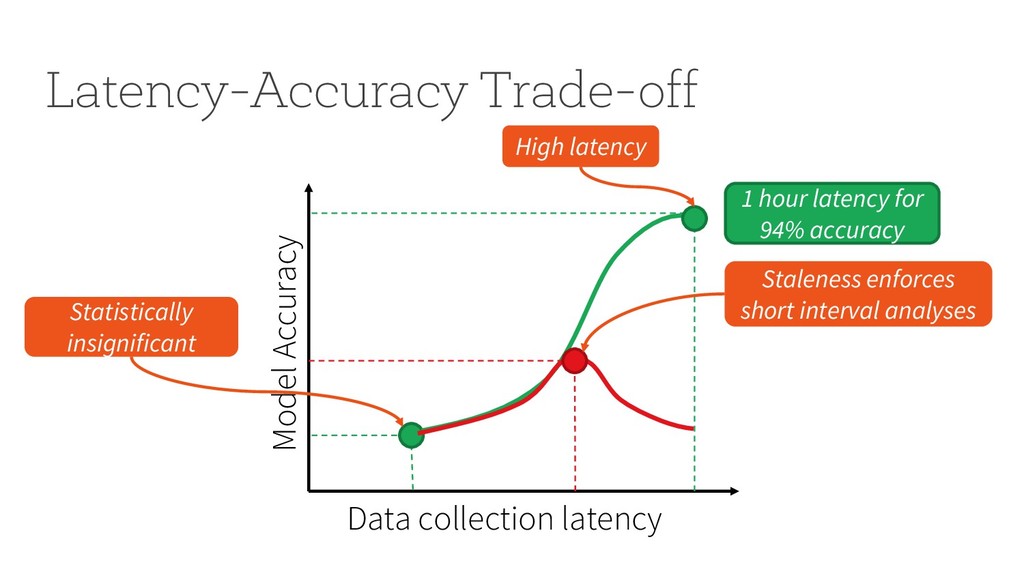
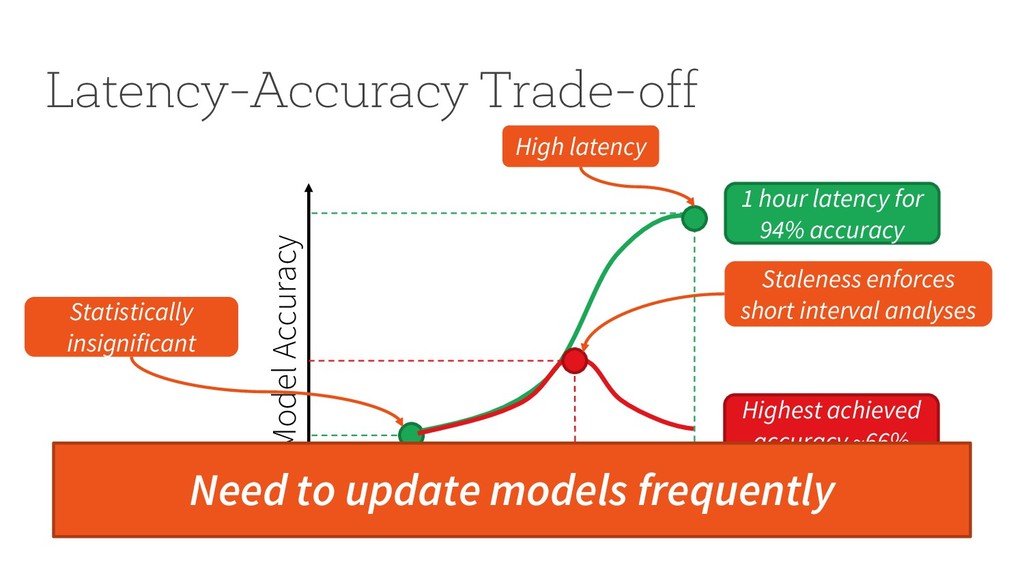
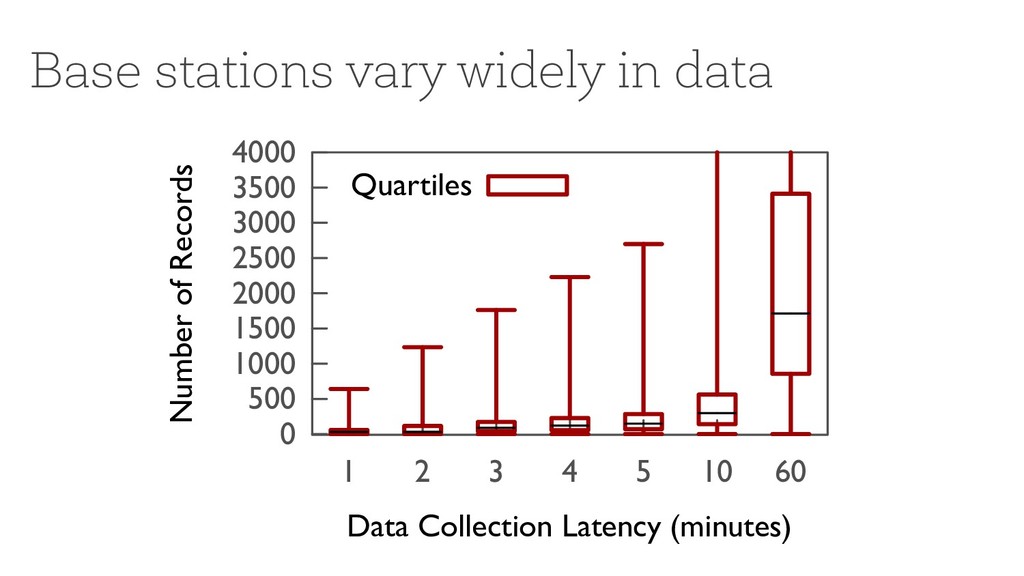
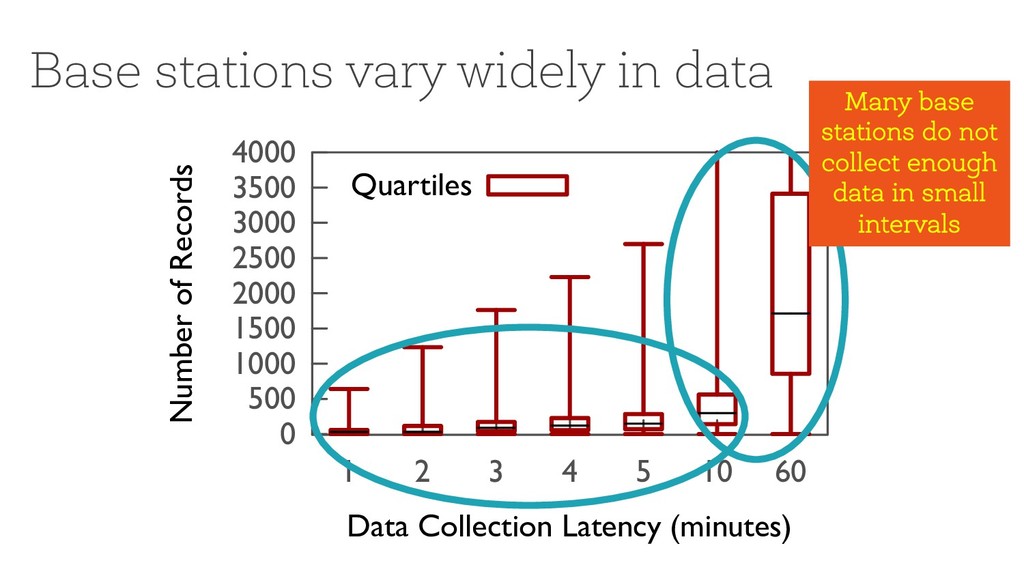
����� ����� ����� ����� ����� � � � � � �� �� ����������������� ��������������������������������� ��������� Many base stations do not collect enough data in small intervals
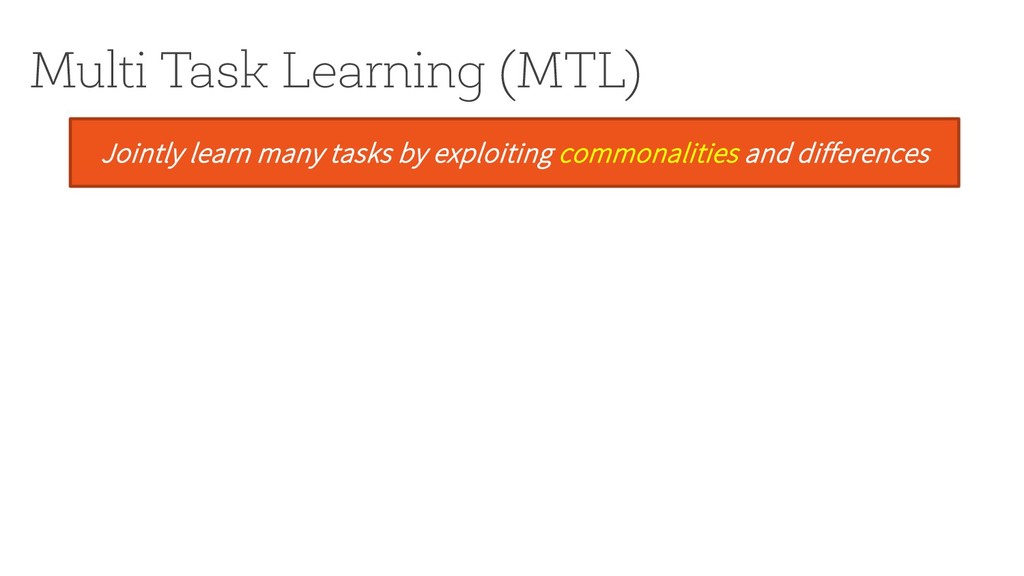
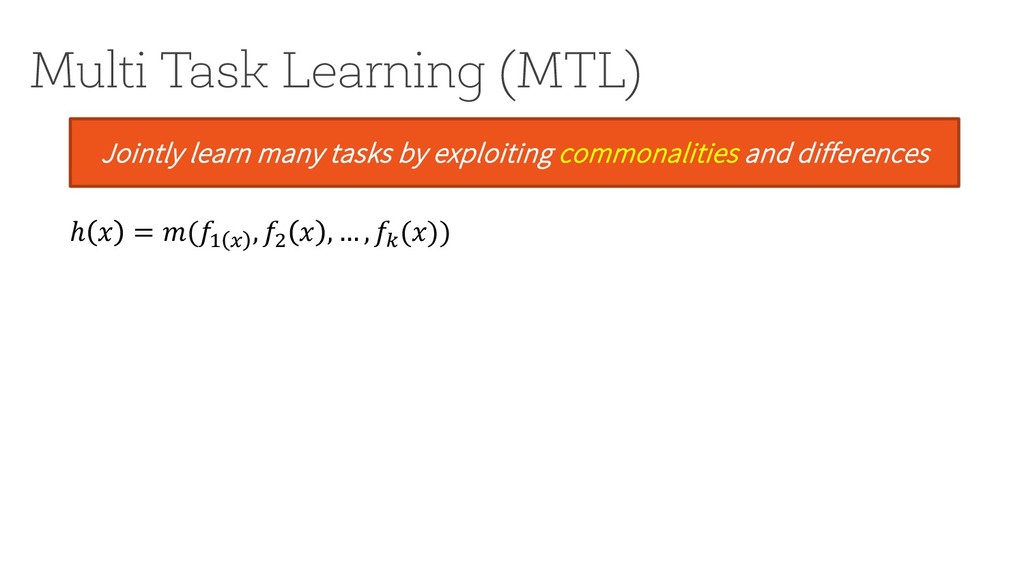
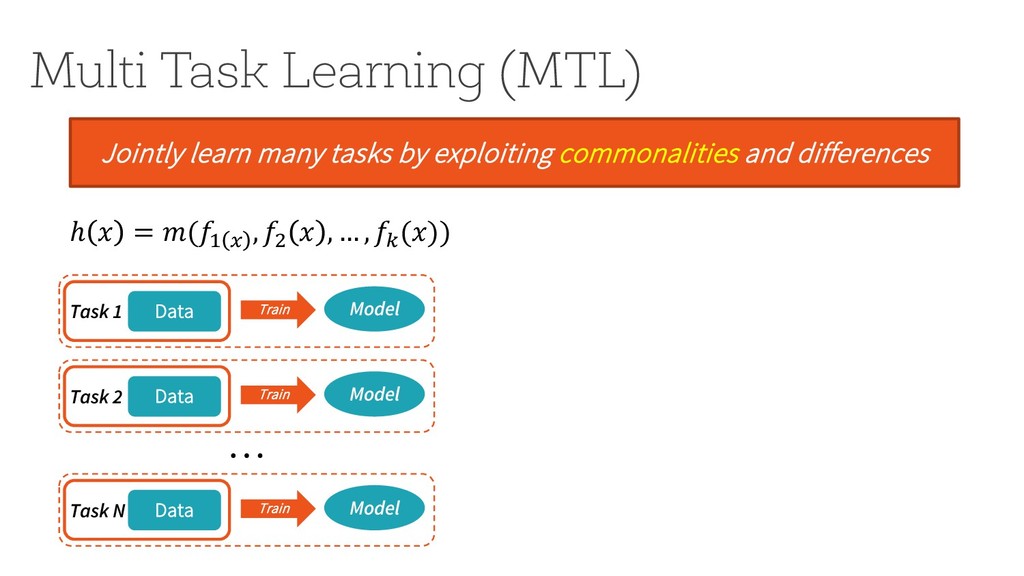
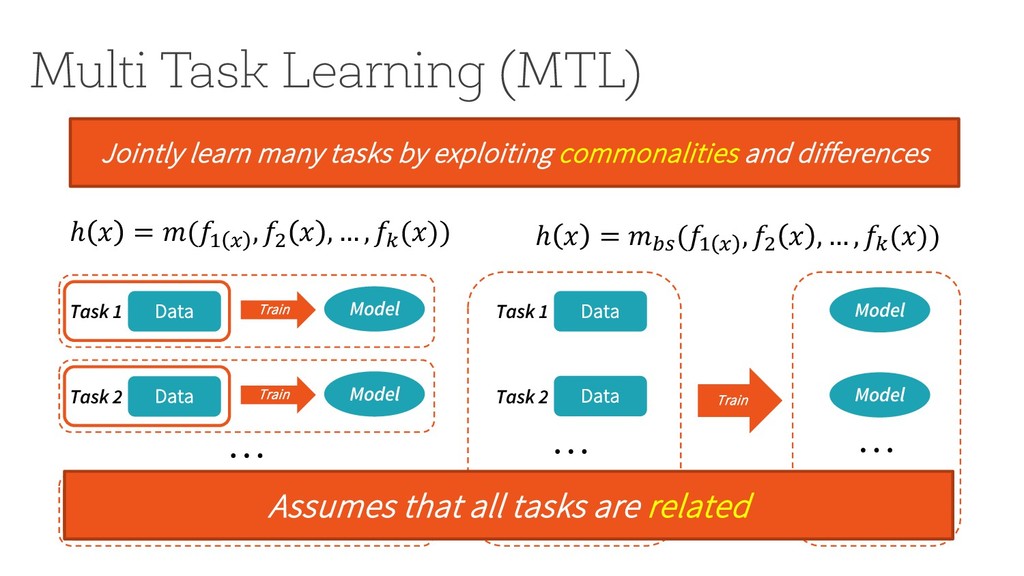
commonalities and differences Data Train Model Task 1 Data Train Model Task 2 Data Train Model Task N … ℎ " = $(&' ( , &* " , … , &, (")) Data Task 1 Data Task 2 Data Task N … Model Model Model … Train
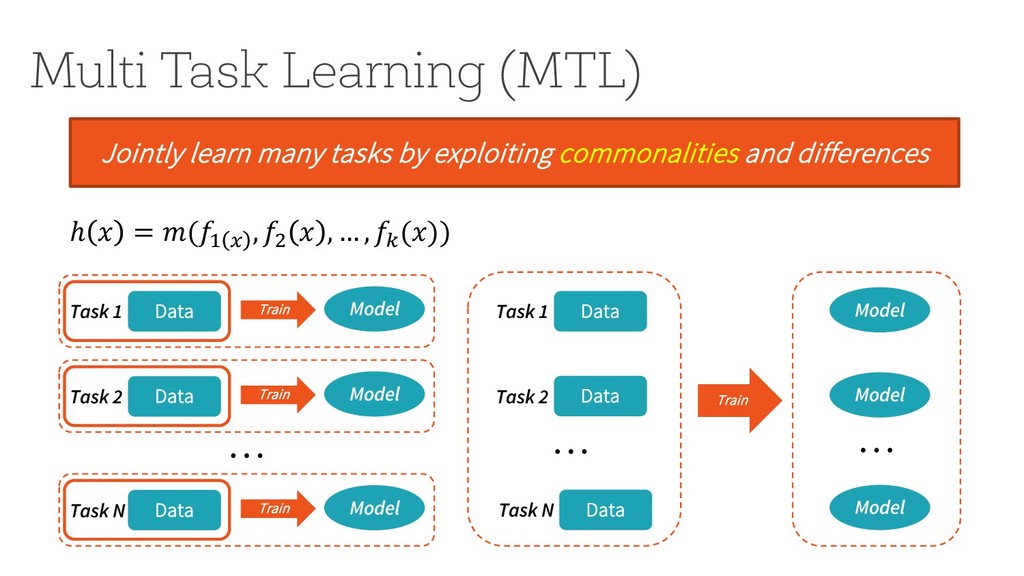
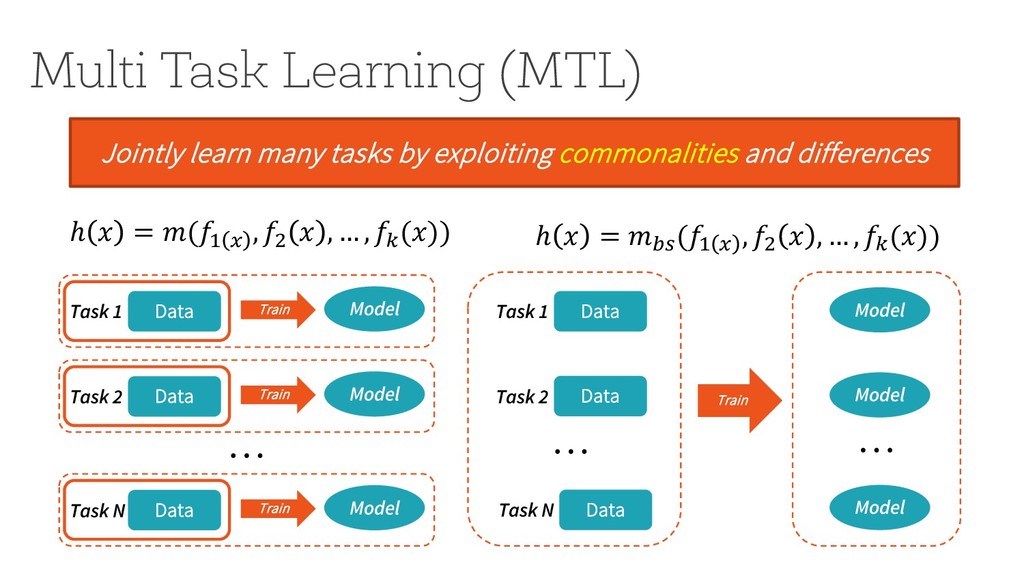
commonalities and differences Data Train Model Task 1 Data Train Model Task 2 Data Train Model Task N … ℎ " = $(&' ( , &* " , … , &, (")) Data Task 1 Data Task 2 Data Task N … Model Model Model … Train ℎ " = $./ (&' ( , &* " , … , &, ("))
commonalities and differences Data Train Model Task 1 Data Train Model Task 2 Data Train Model Task N … ℎ " = $(&' ( , &* " , … , &, (")) Data Task 1 Data Task 2 Data Task N … Model Model Model … Train ℎ " = $./ (&' ( , &* " , … , &, (")) Assumes that all tasks are related
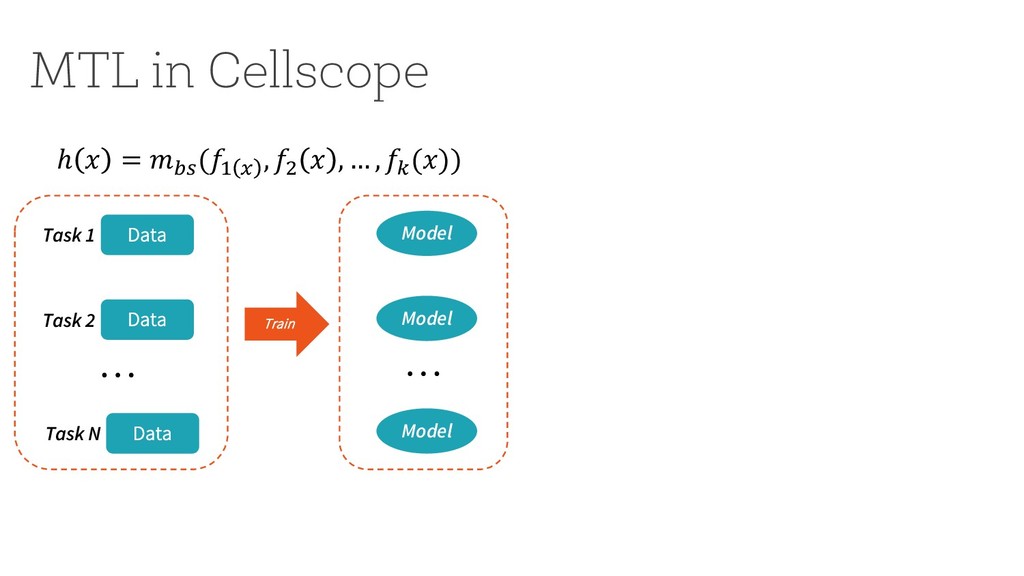
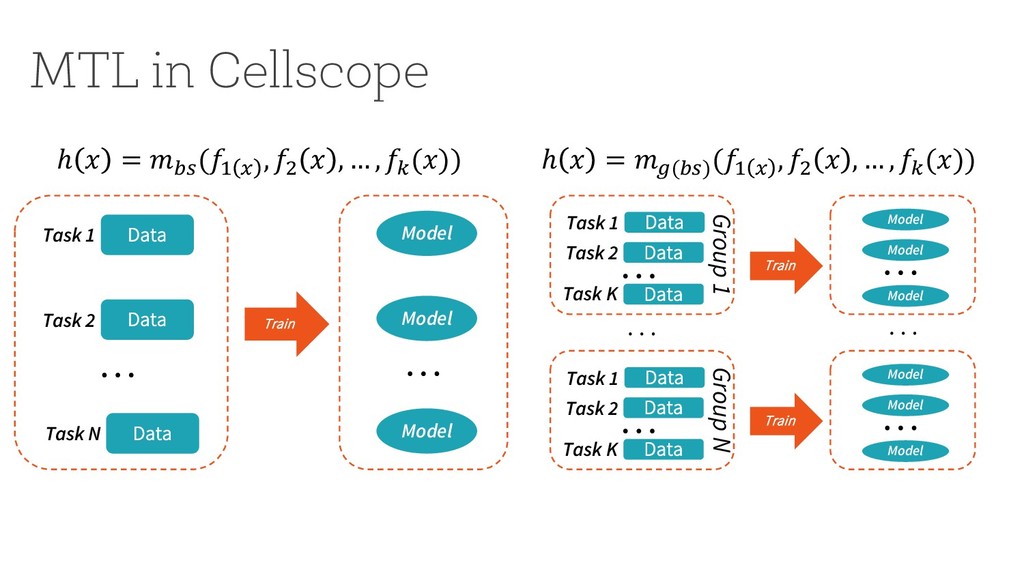
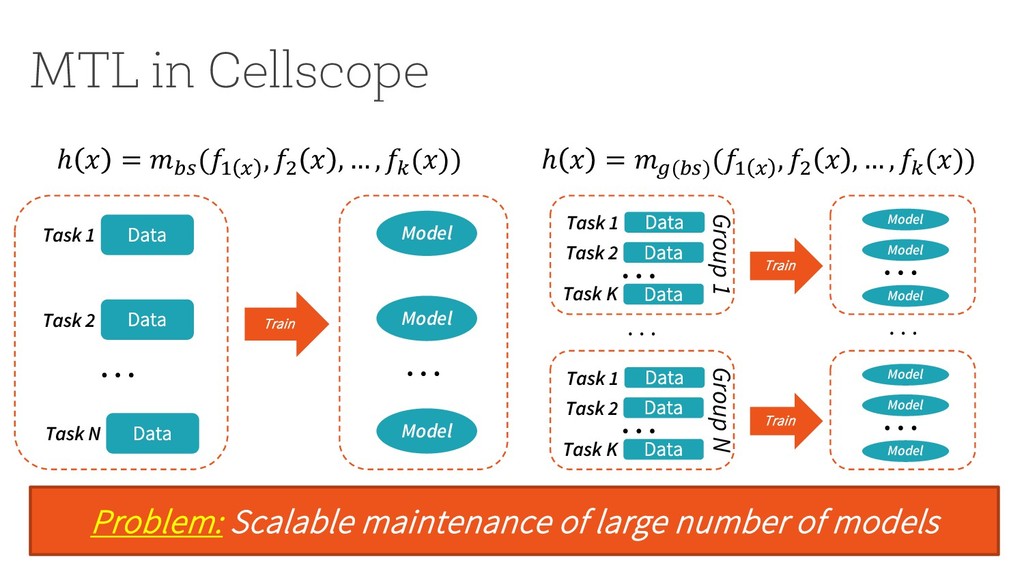
Data Task N … Model Model Model … ℎ " = $%& (() * , (, " , … , (. (")) … … Train Data Task 1 Task 2 Task K … Model … Group 1 Data Data Model Model Train Data Task 1 Task 2 Task K … Model … Group N Data Data Model Model ℎ " = $0(%&) (() * , (, " , … , (. ("))
models Train Data Task 1 Data Task 2 Data Task N … Model Model Model … ℎ " = $%& (() * , (, " , … , (. (")) … … Train Data Task 1 Task 2 Task K … Model … Group 1 Data Data Model Model Train Data Task 1 Task 2 Task K … Model … Group N Data Data Model Model ℎ " = $0(%&) (() * , (, " , … , (. ("))
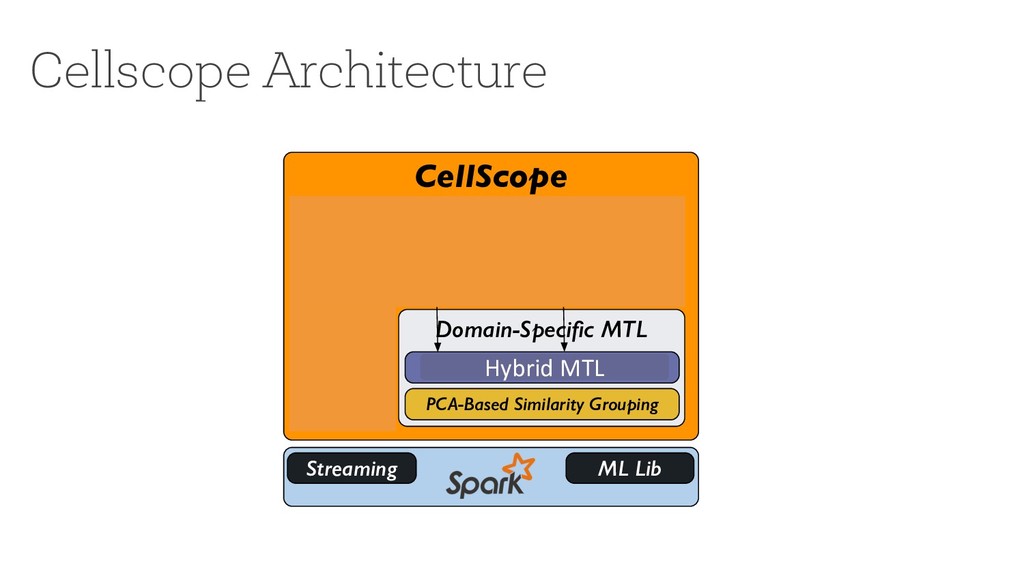
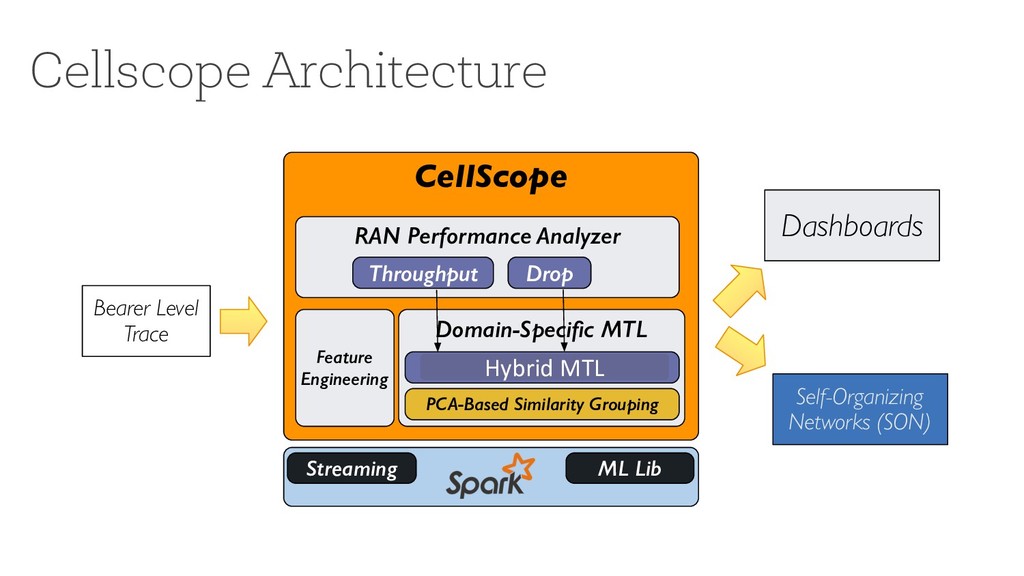
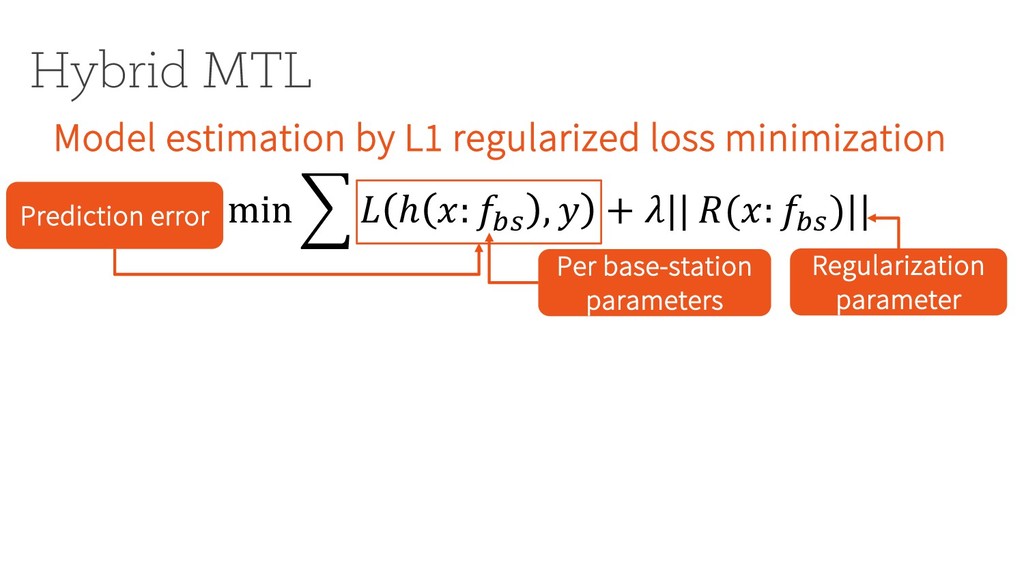
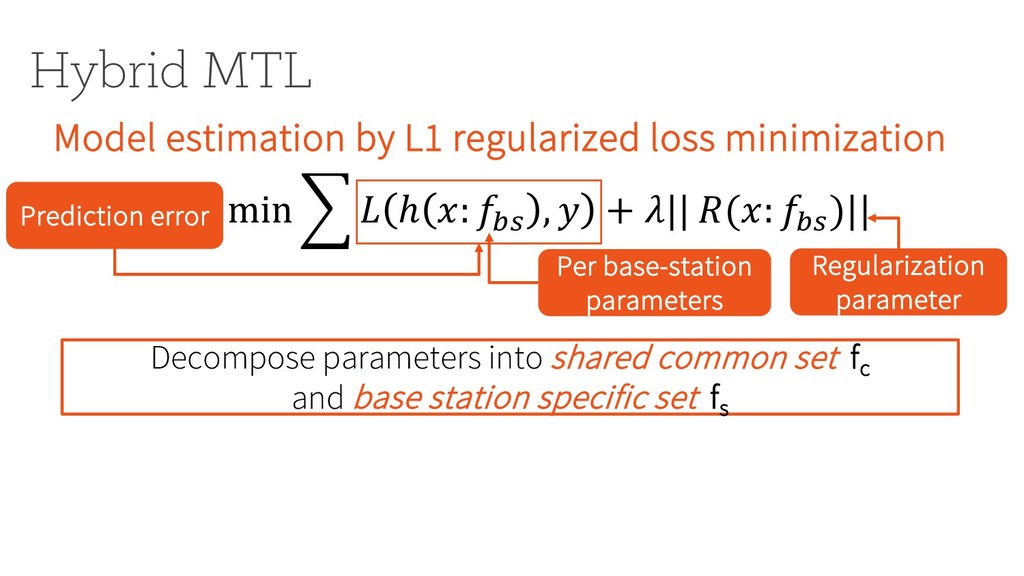
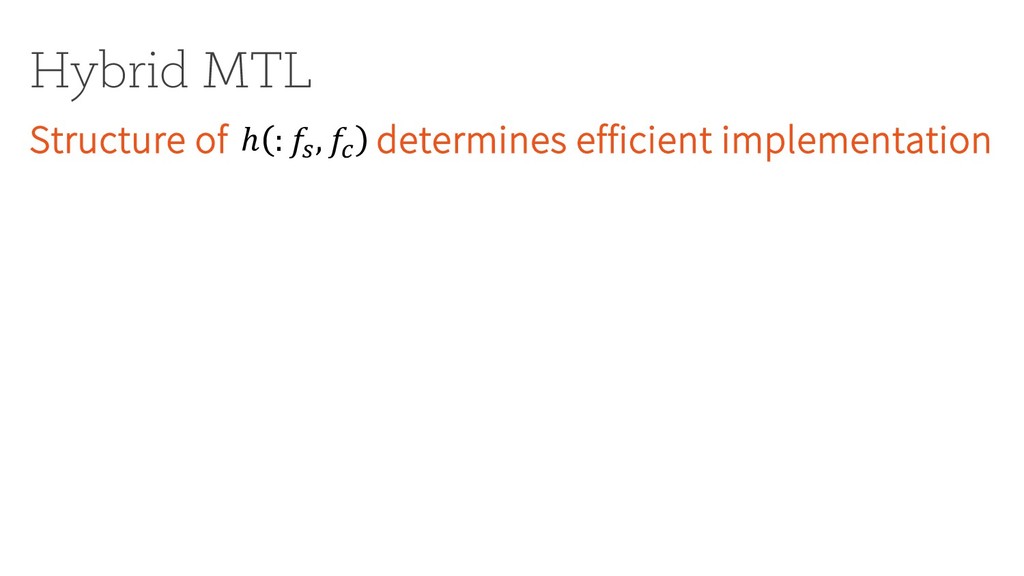
1(': )*+ )|| Hybrid MTL Model estimation by L1 regularized loss minimization Per base-station parameters Regularization parameter Prediction error Decompose parameters into shared common set fc and base station specific set fs
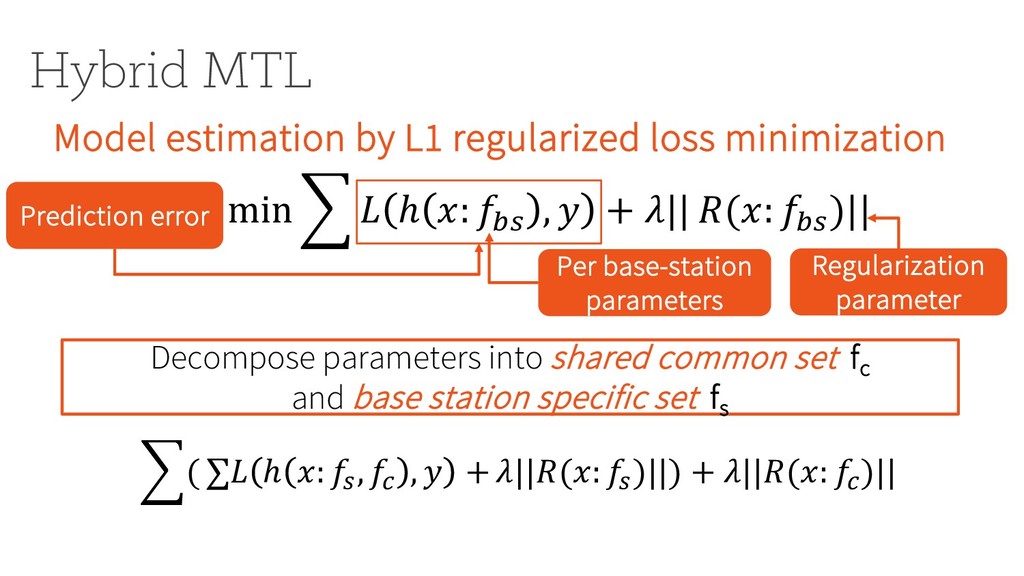
1(': )*+ )|| Hybrid MTL Model estimation by L1 regularized loss minimization Per base-station parameters Regularization parameter Prediction error Decompose parameters into shared common set fc and base station specific set fs $( ∑% ℎ ': )+ , )5 , - + /||1(': )+ )||) + /||1(': )5 )||
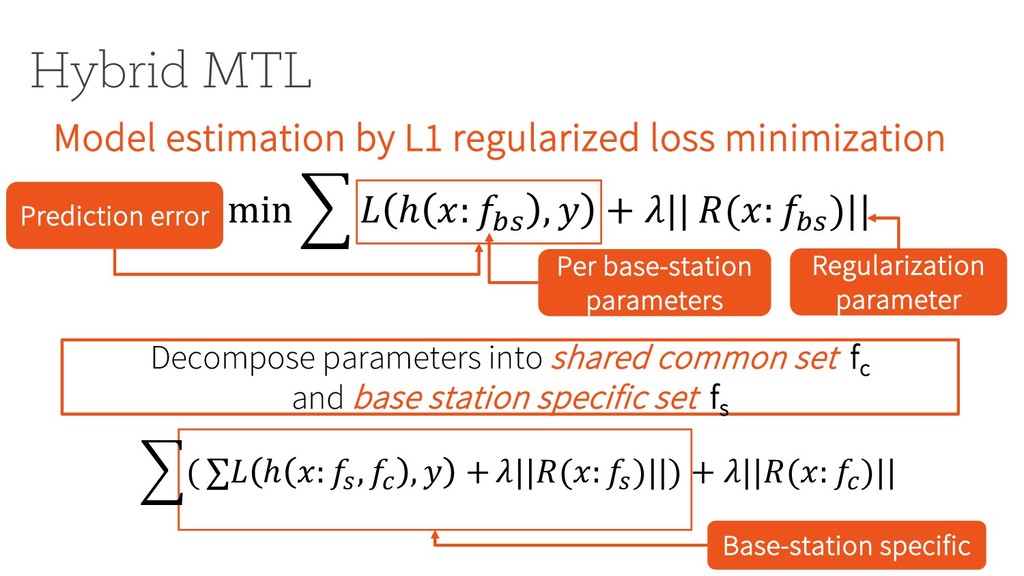
1(': )*+ )|| Hybrid MTL Model estimation by L1 regularized loss minimization Per base-station parameters Regularization parameter Prediction error Decompose parameters into shared common set fc and base station specific set fs Base-station specific $( ∑% ℎ ': )+ , )5 , - + /||1(': )+ )||) + /||1(': )5 )||
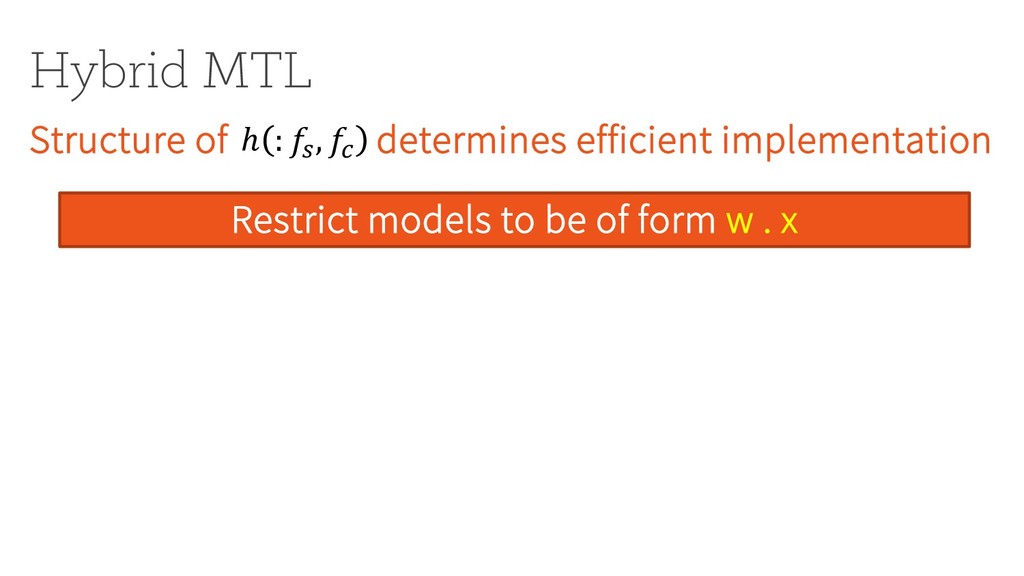
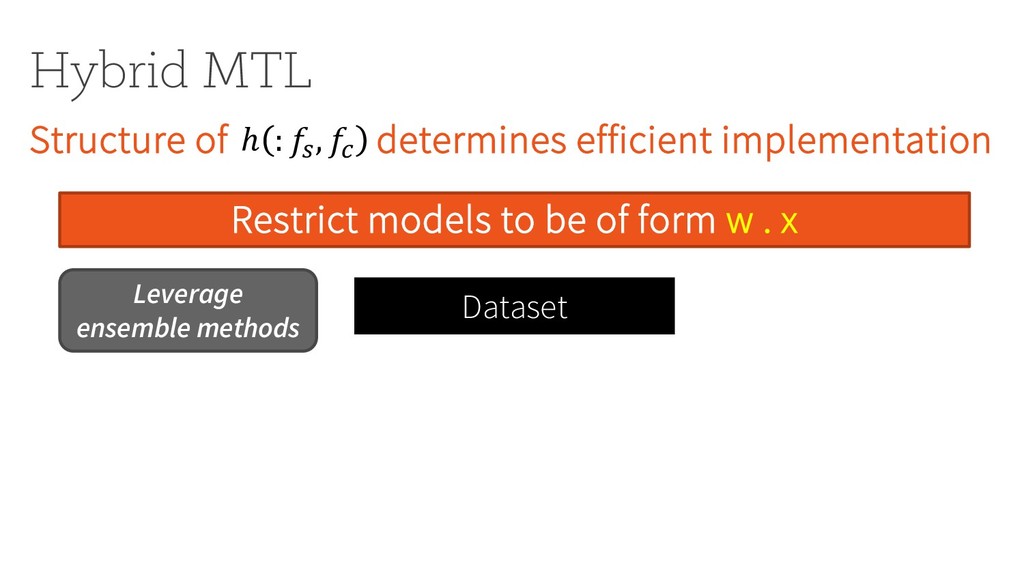
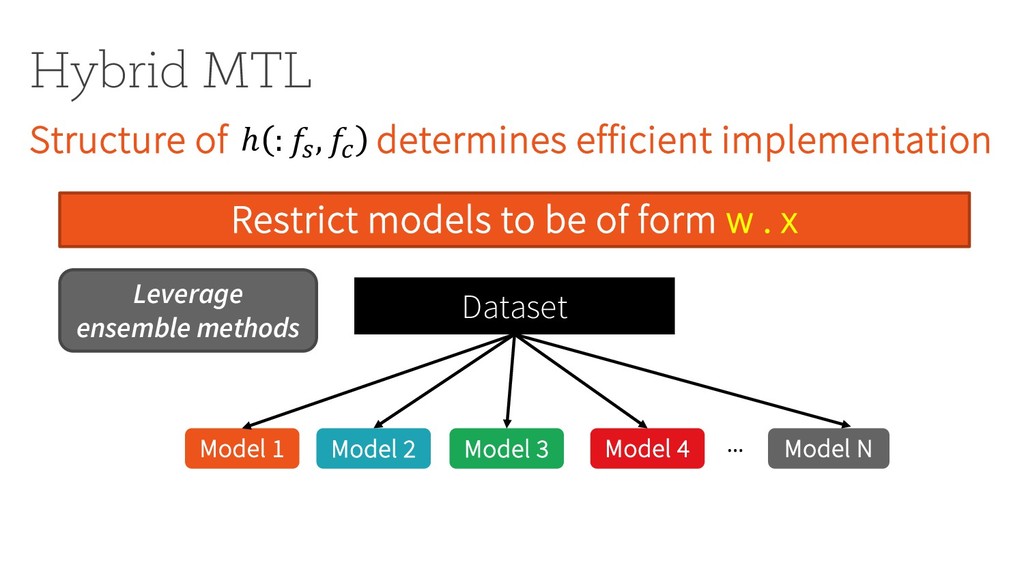
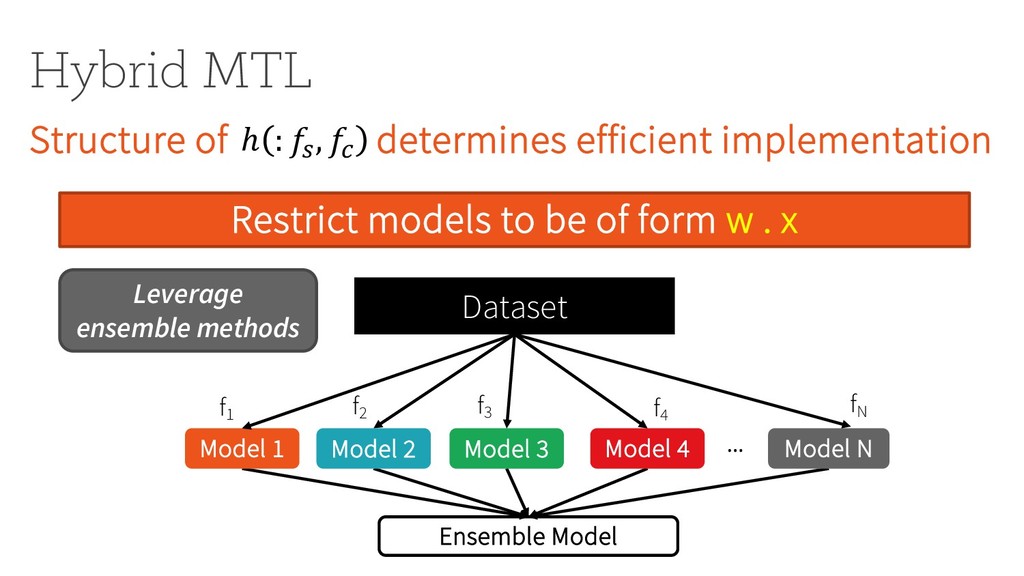
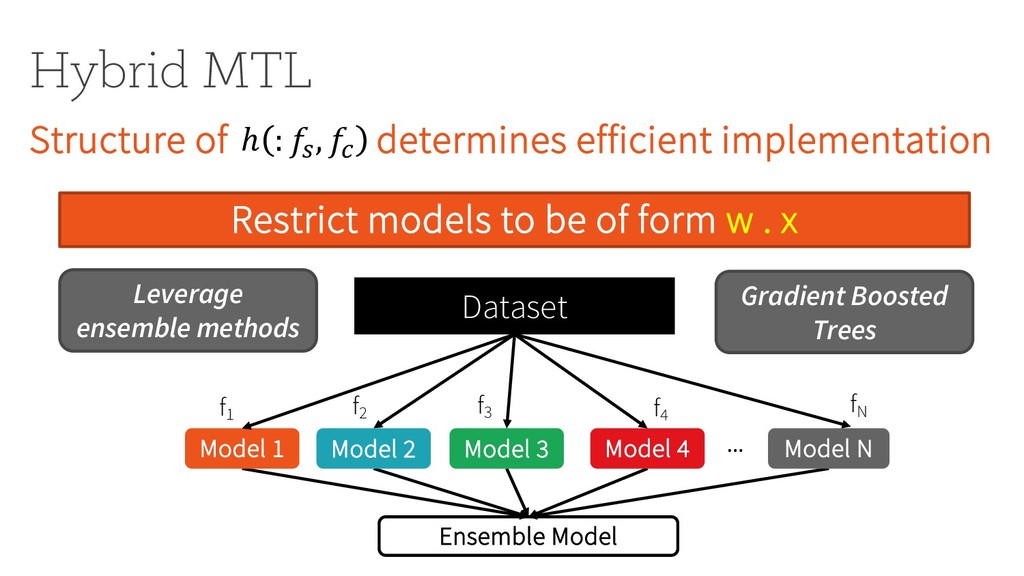
Model 2 Model 3 Model 4 Model N Model 1 … Restrict models to be of form w . x Leverage ensemble methods Gradient Boosted Trees ℎ : #$ , #& f1 f2 f3 f4 fN
efficient implementation Dataset Ensemble Model Model 2 Model 3 Model 4 Model N Model 1 … Restrict models to be of form w . x Leverage ensemble methods Gradient Boosted Trees ℎ : #$ , #& f1 f2 f3 f4 fN
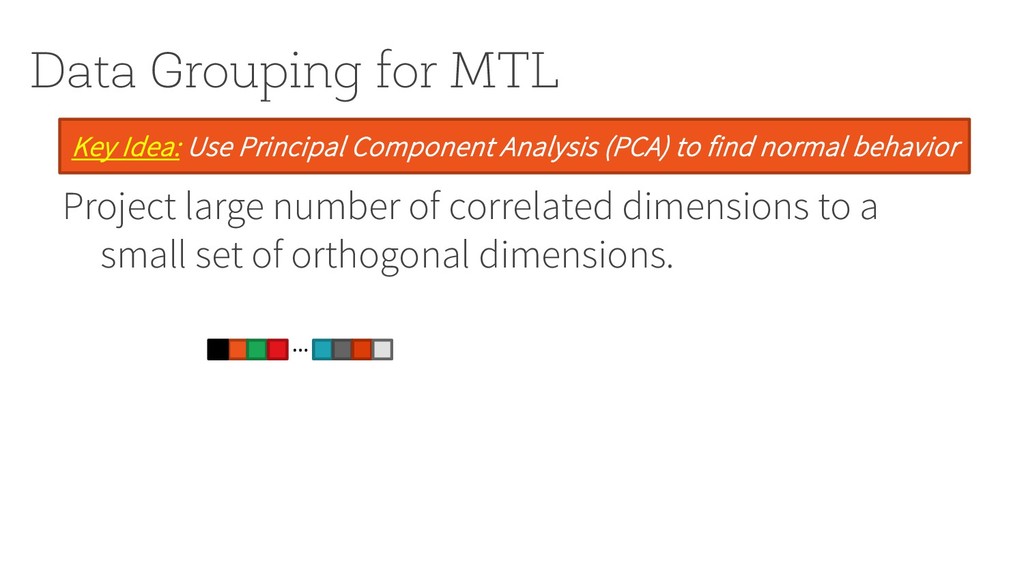
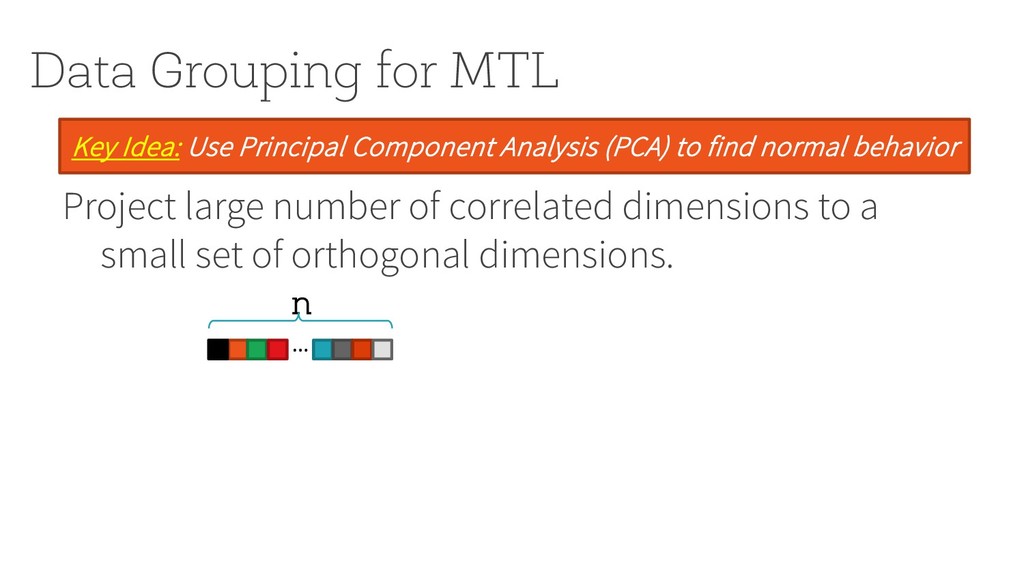
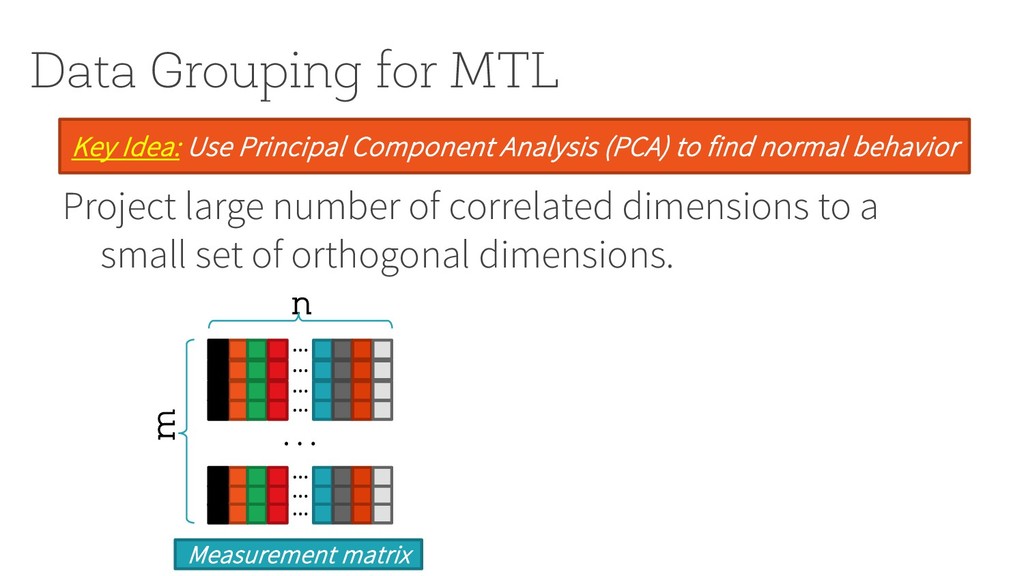
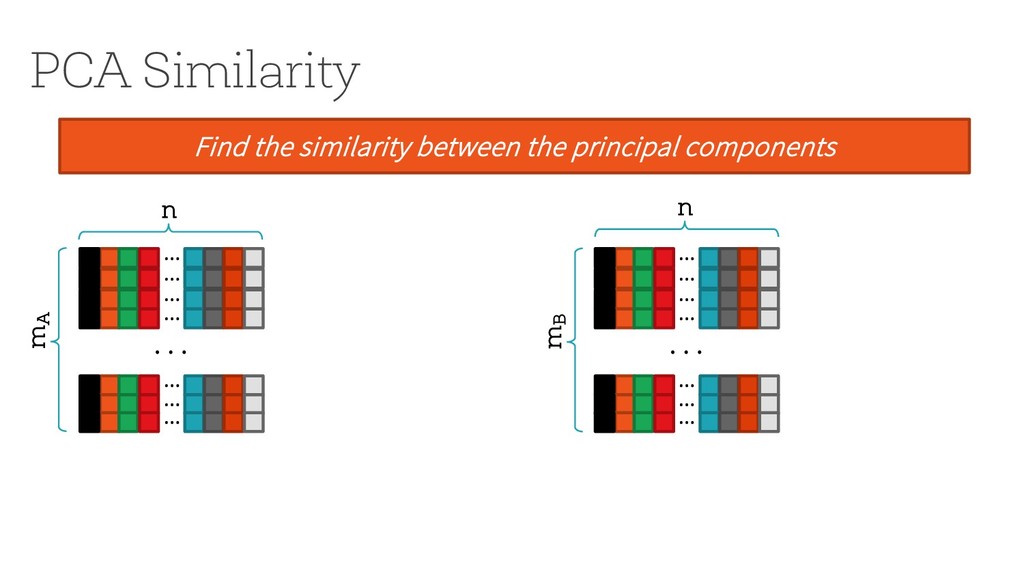
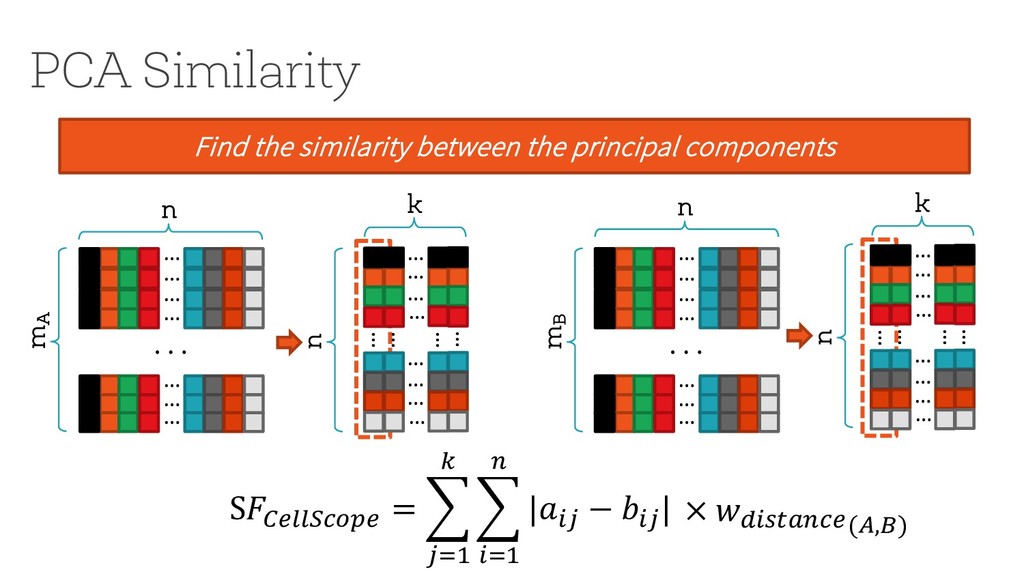
to a small set of orthogonal dimensions. Key Idea: Use Principal Component Analysis (PCA) to find normal behavior … … … … … … … … n m Measurement matrix
to a small set of orthogonal dimensions. Key Idea: Use Principal Component Analysis (PCA) to find normal behavior … … … … … … … … n m Measurement matrix
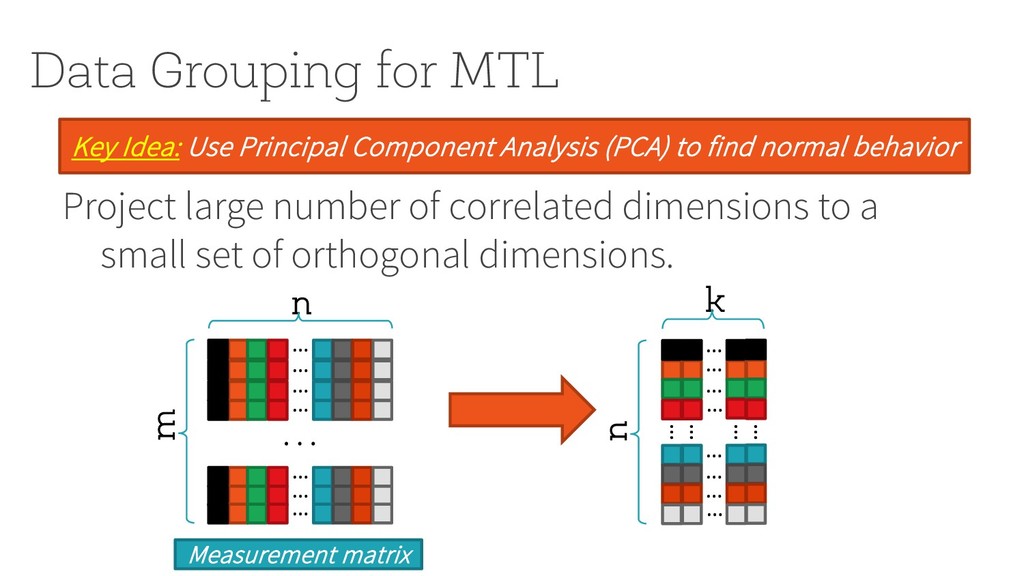
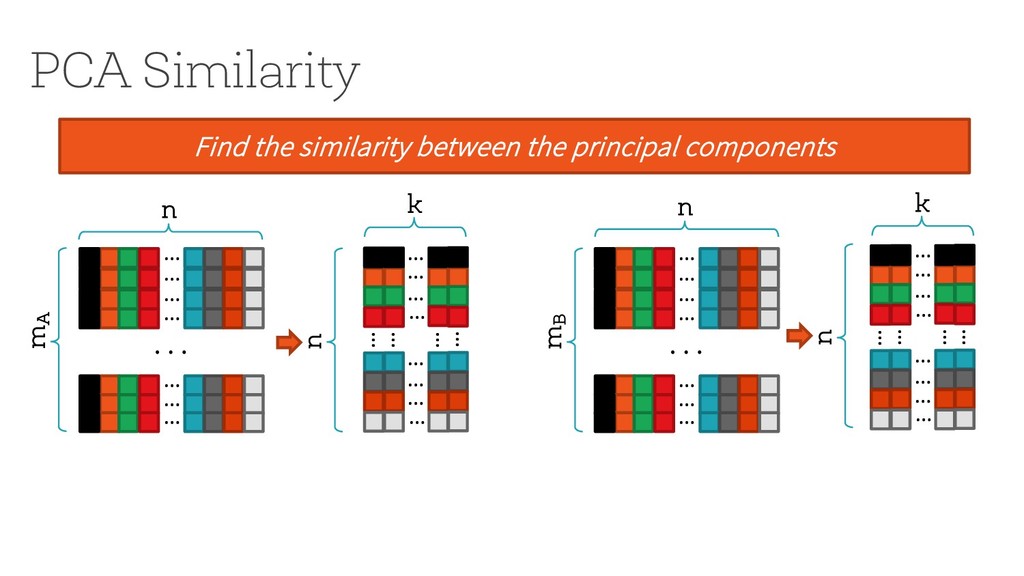
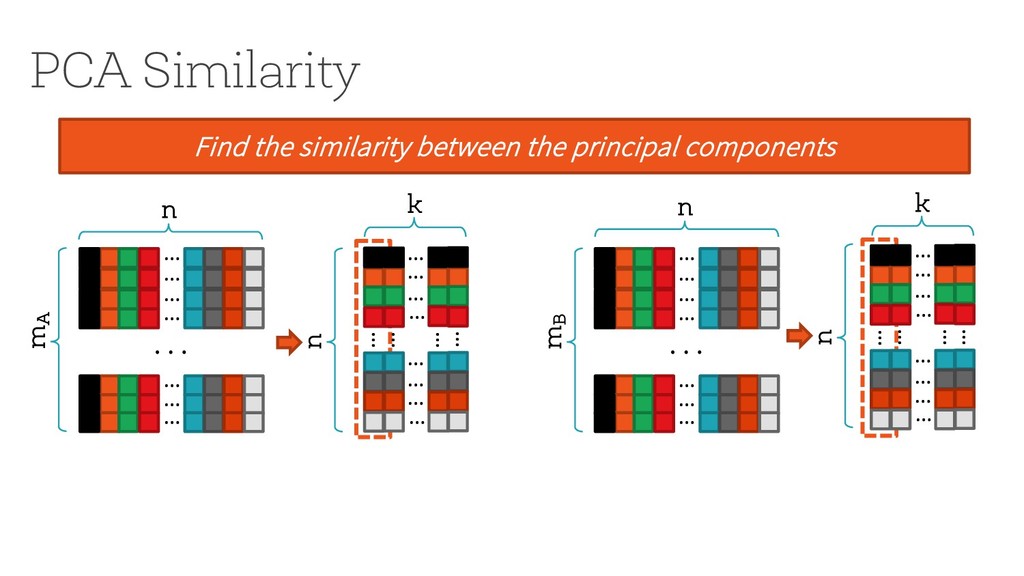
to a small set of orthogonal dimensions. Key Idea: Use Principal Component Analysis (PCA) to find normal behavior … … … … … … … … … … … … … … … … … … … … n m n k Measurement matrix
to a small set of orthogonal dimensions. Key Idea: Use Principal Component Analysis (PCA) to find normal behavior … … … … … … … … … … … … … … … … … … … … n m n k Measurement matrix
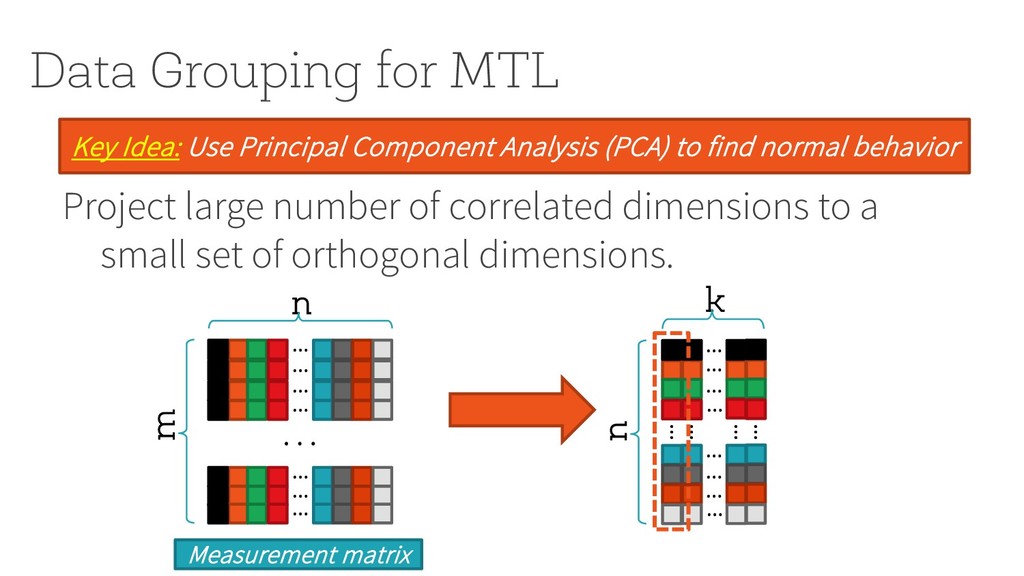
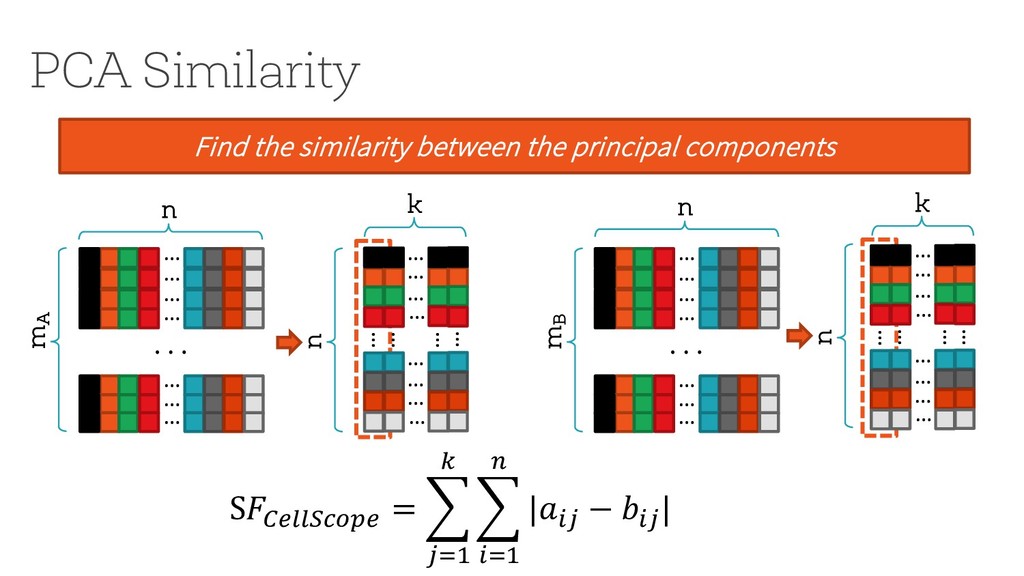
to a small set of orthogonal dimensions. Key Idea: Use Principal Component Analysis (PCA) to find normal behavior … … … … … … … … … … … … … … … … … … … … n m n k loadings Measurement matrix
Mllib and provides a simple API for grouping § Evaluated using data from a live RAN § Data over several months § Models for two metrics: drops and throughput prediction § Also analyzed several issues in the wild
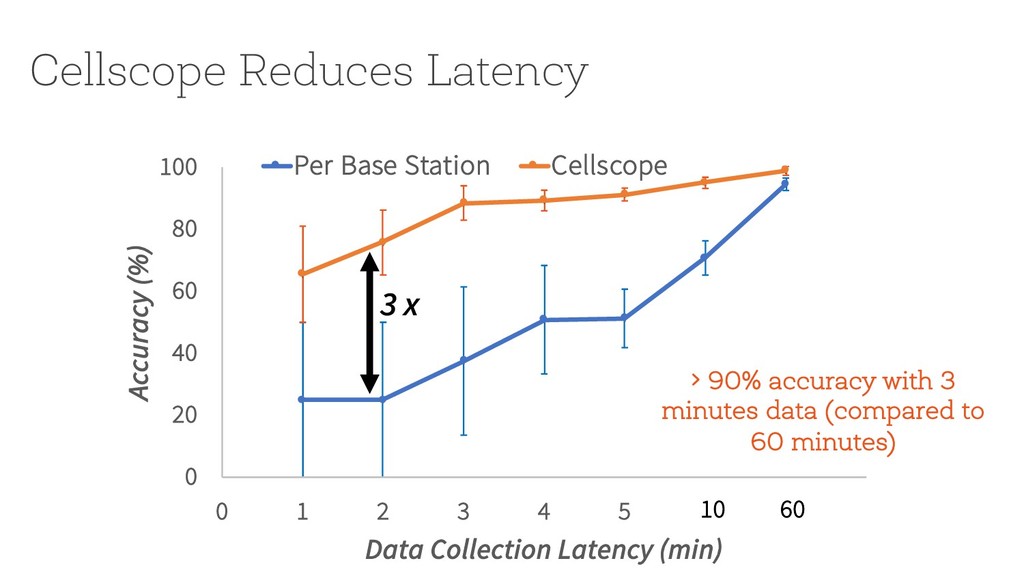
1 2 3 4 5 6 7 8 Accuracy (%) Data Collection Latency (min) Per Base Station Cellscope 10 60 > 90% accuracy with 3 minutes data (compared to 60 minutes) 3 x
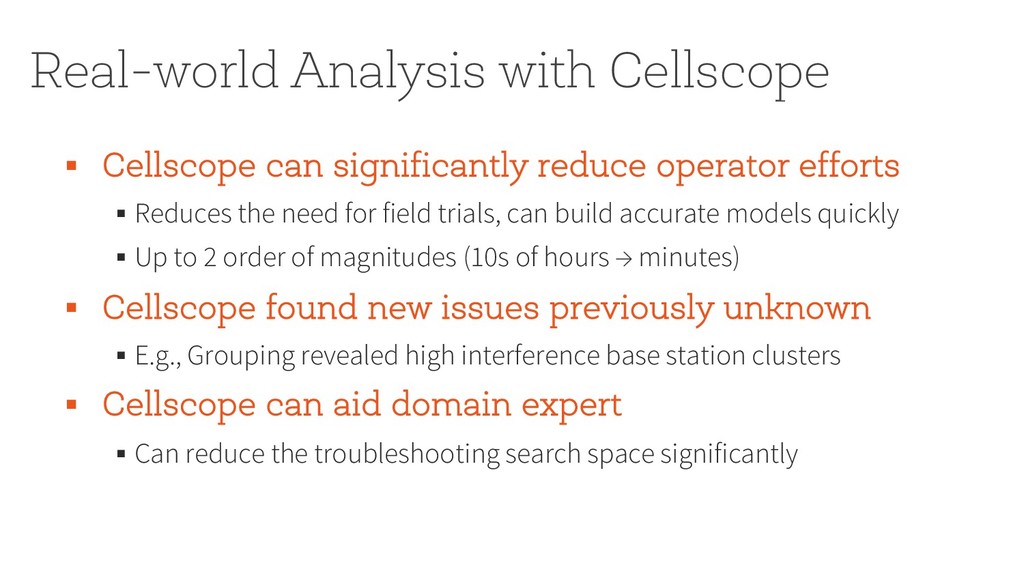
efforts § Reduces the need for field trials, can build accurate models quickly § Up to 2 order of magnitudes (10s of hours → minutes) § Cellscope found new issues previously unknown § E.g., Grouping revealed high interference base station clusters § Cellscope can aid domain expert § Can reduce the troubleshooting search space significantly
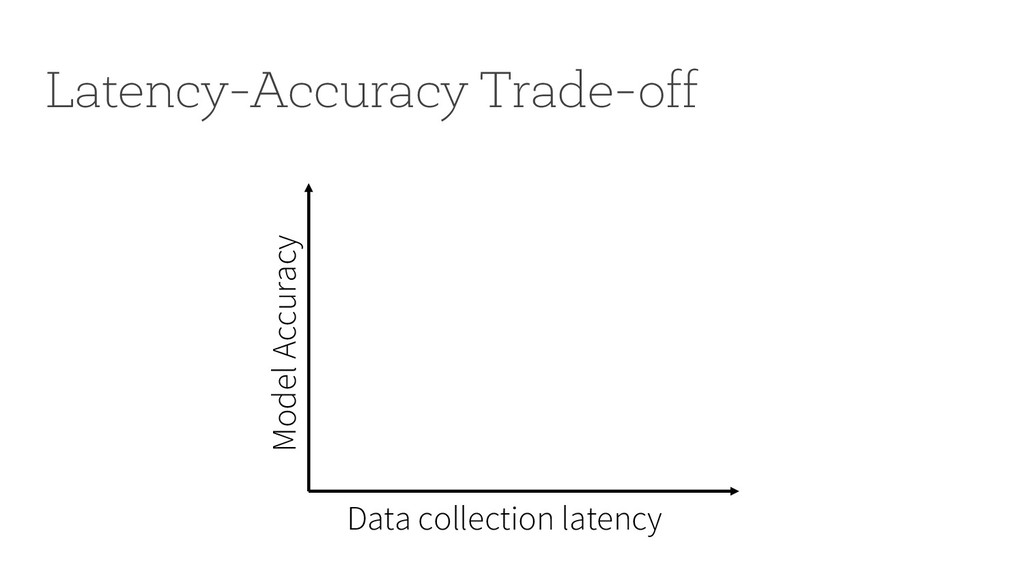
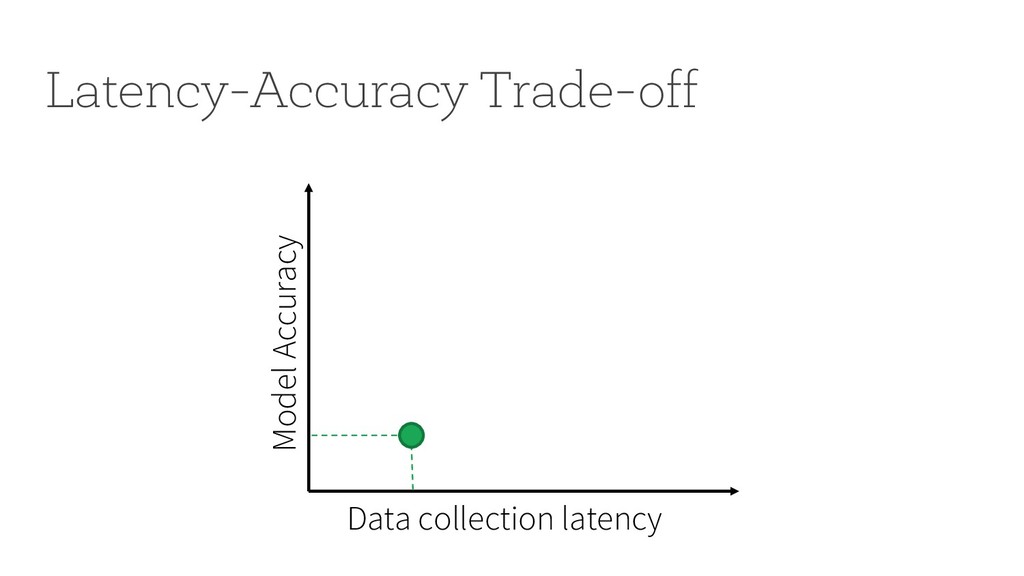
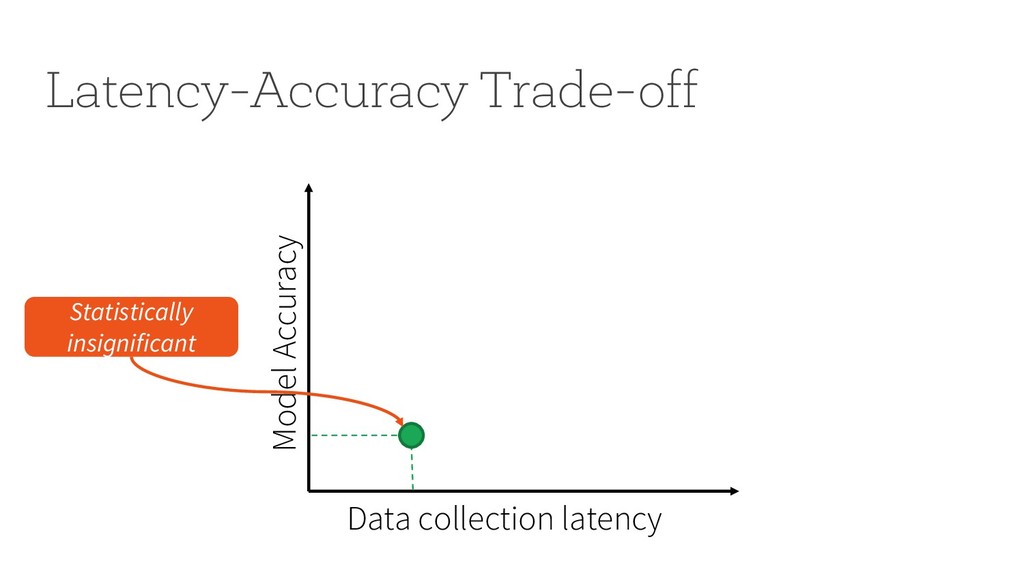
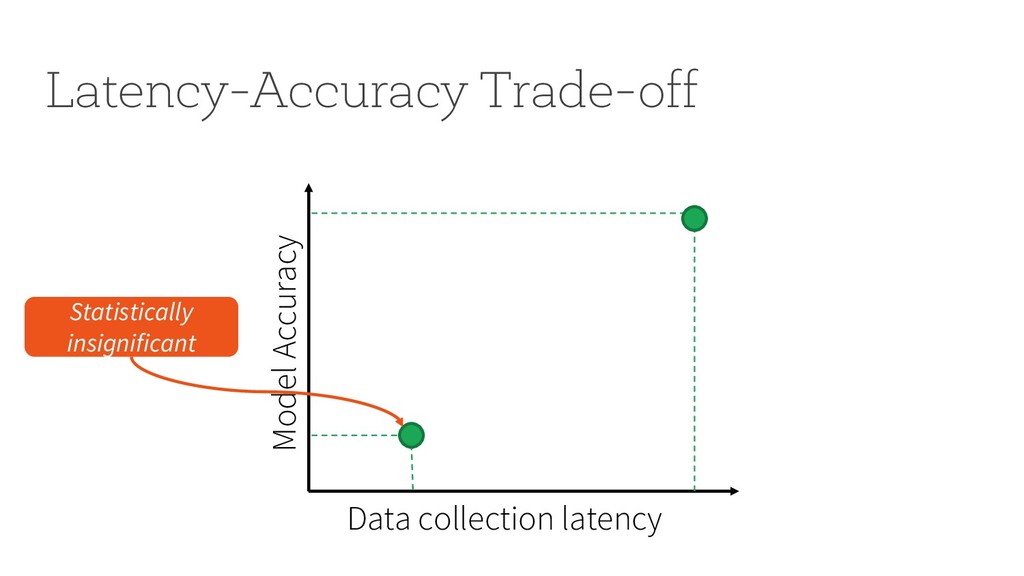
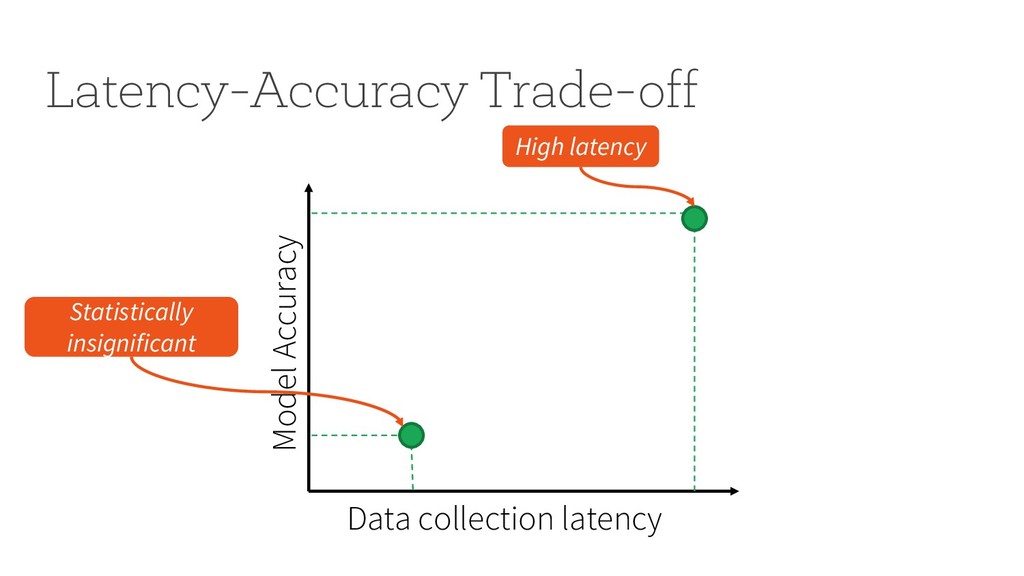
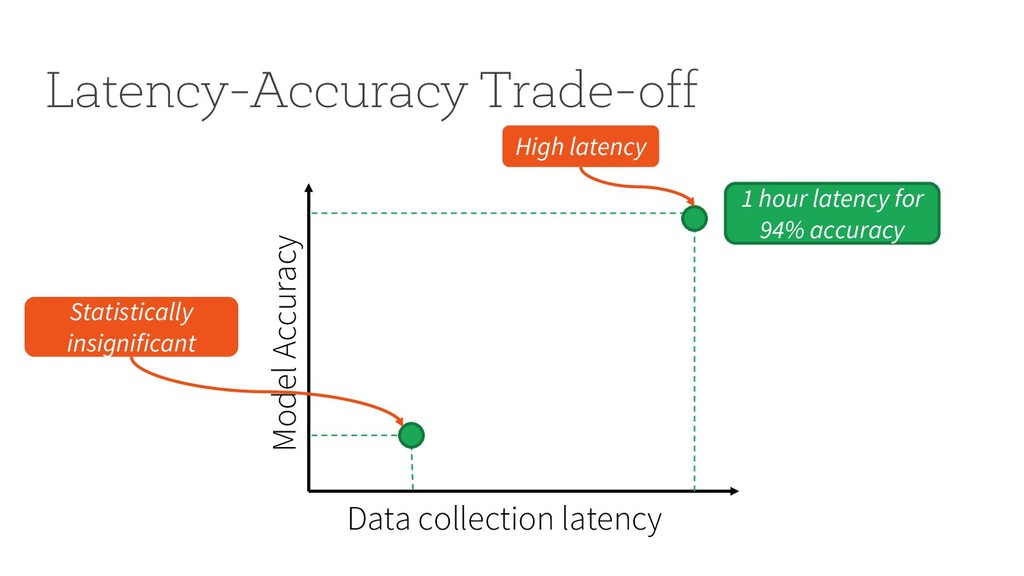
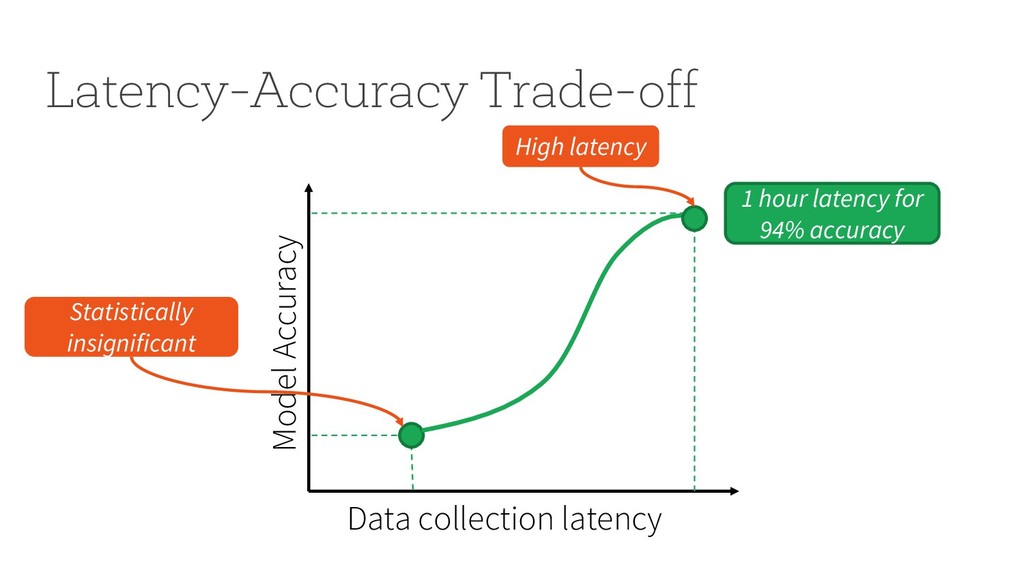
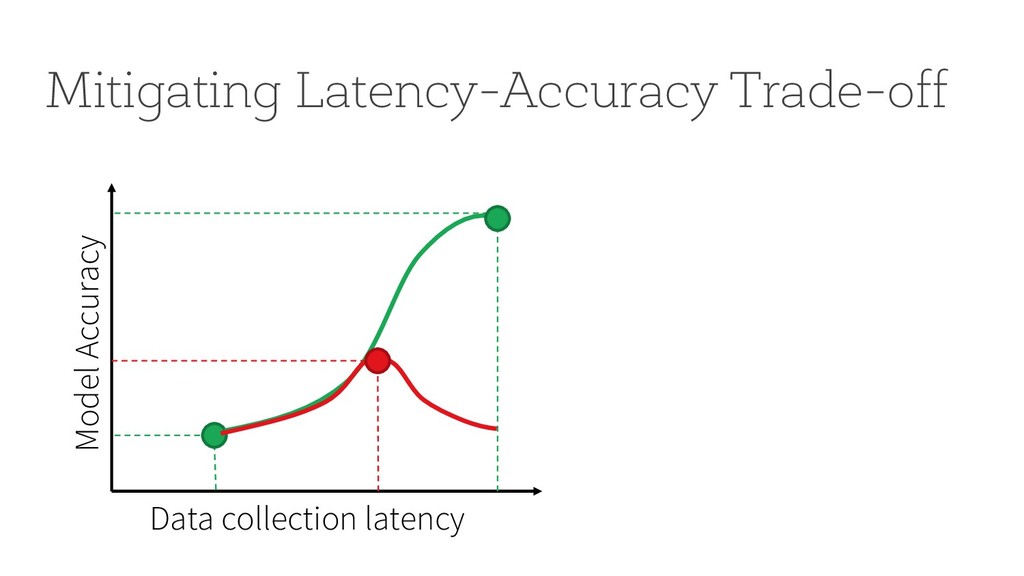
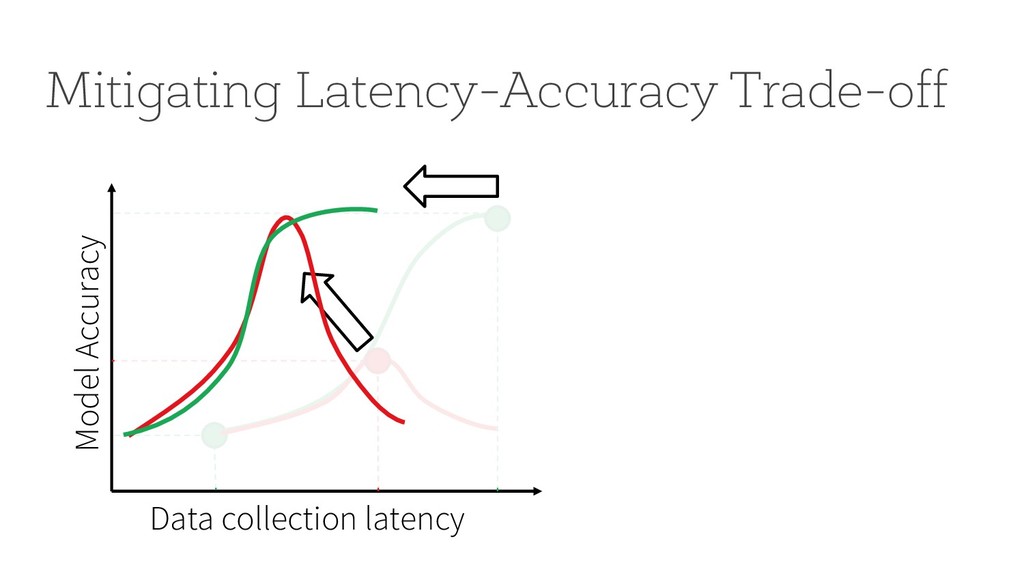
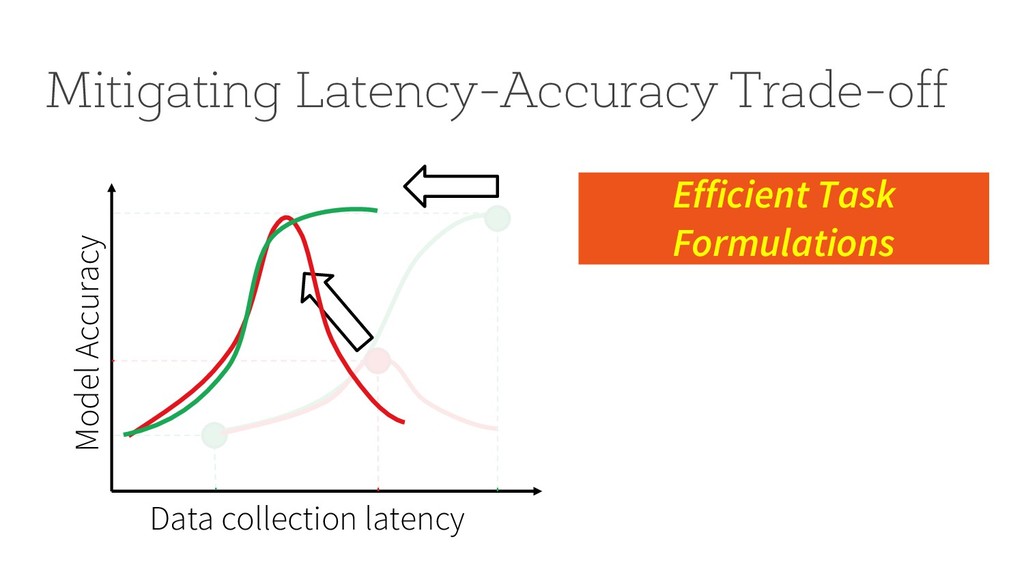
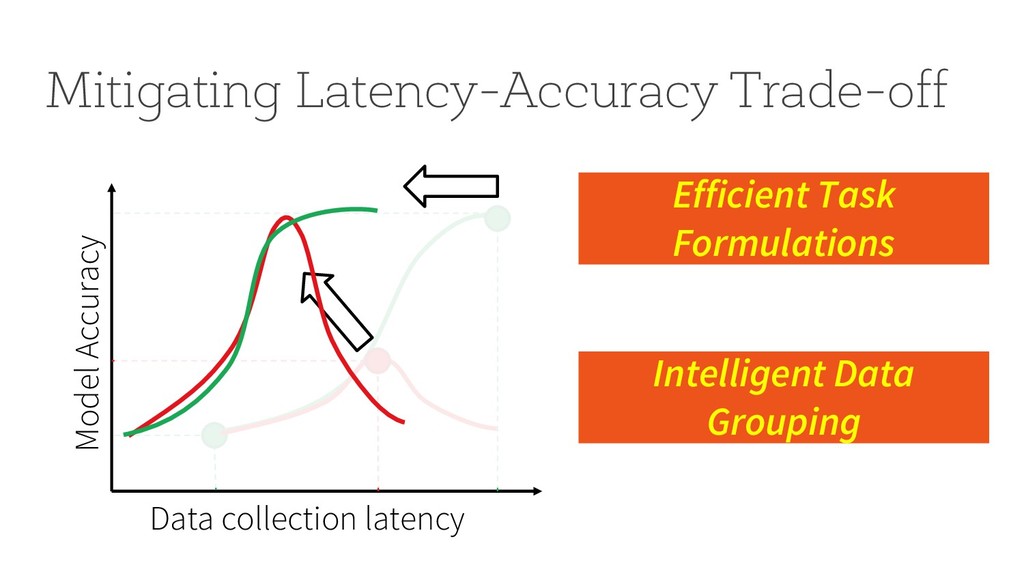
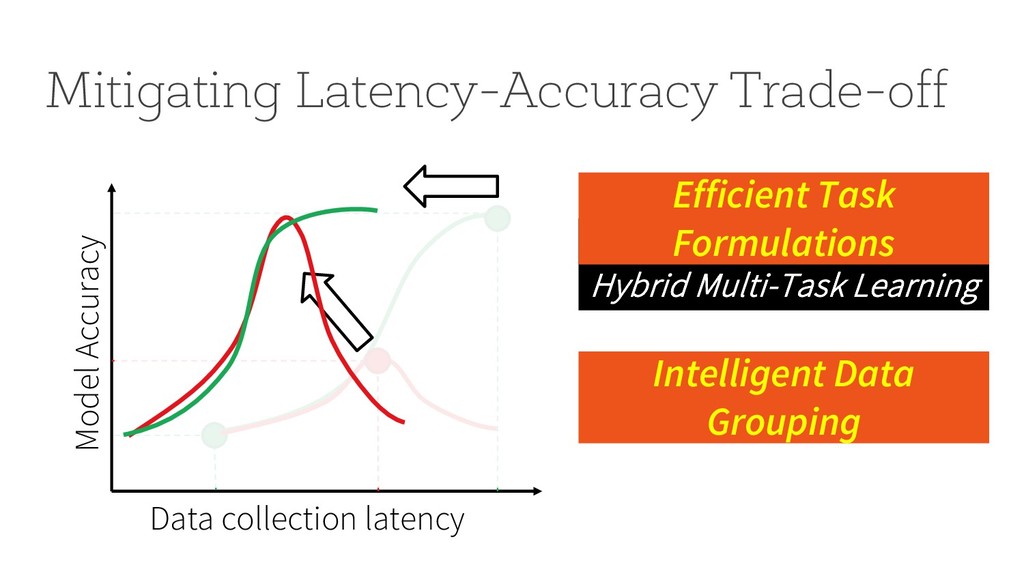
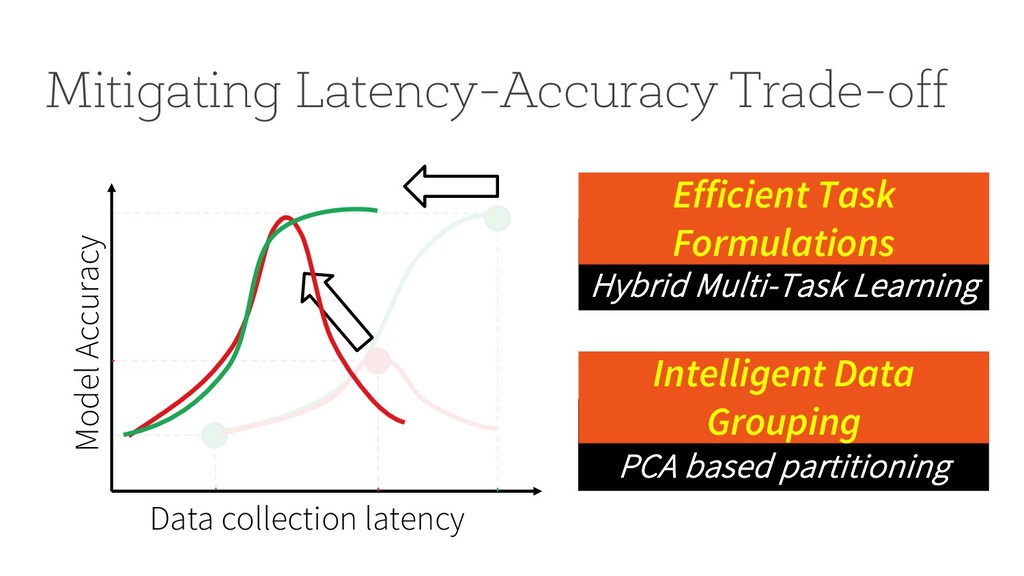
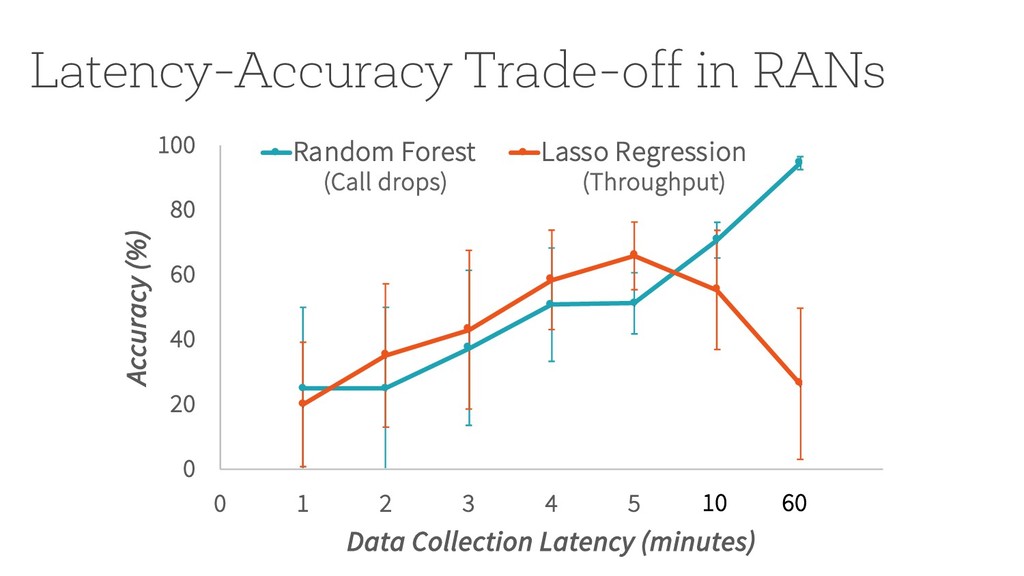
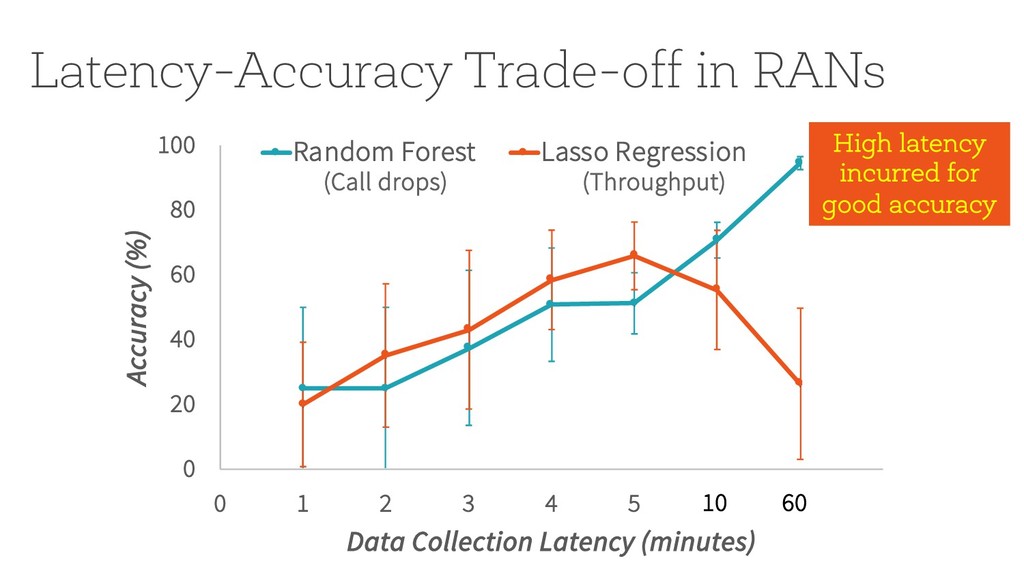
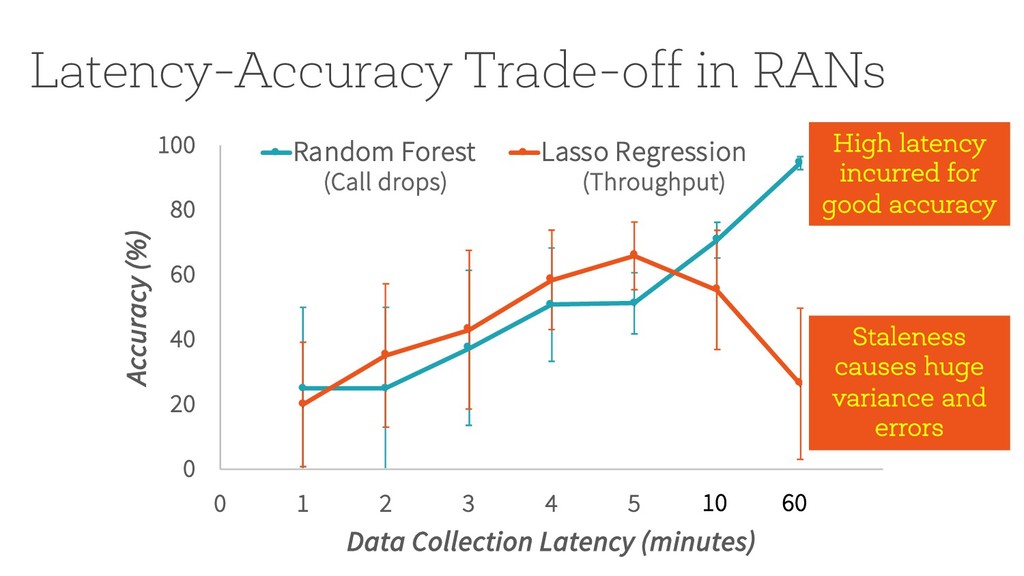
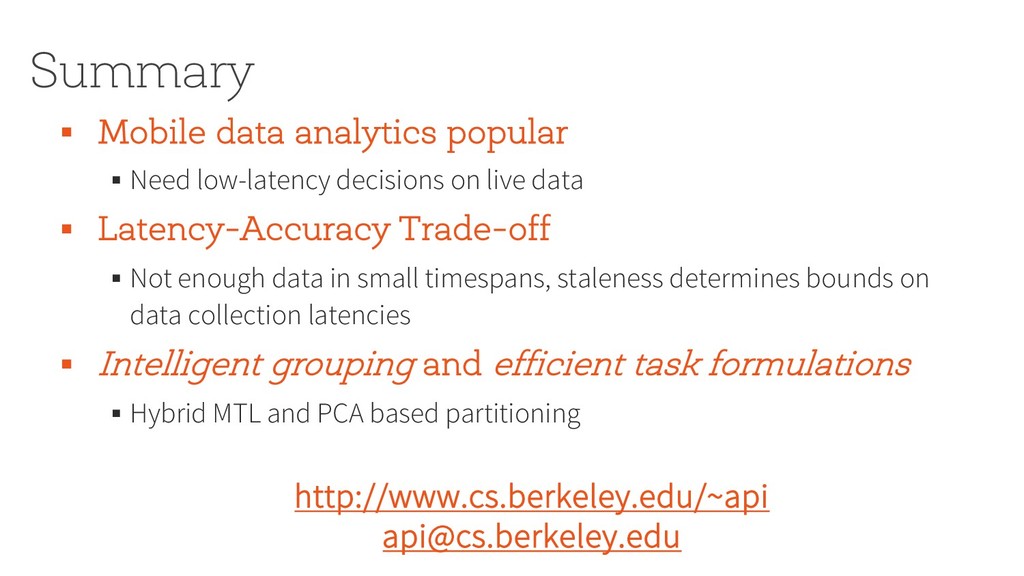
on live data § Latency-Accuracy Trade-off § Not enough data in small timespans, staleness determines bounds on data collection latencies § Intelligent grouping and efficient task formulations § Hybrid MTL and PCA based partitioning http://www.cs.berkeley.edu/~api [email protected]