Zaoxing Liu ⬩, Xin Jin⬩, Shivaram Venkataraman▴, Vladimir Braverman⬩, Ion Stoica ⋆ ⋆ UC Berkeley ⬩ Johns Hopkins University ▴ Microsoft Research / University of Wisconsin HotCloud, July 09, 2018
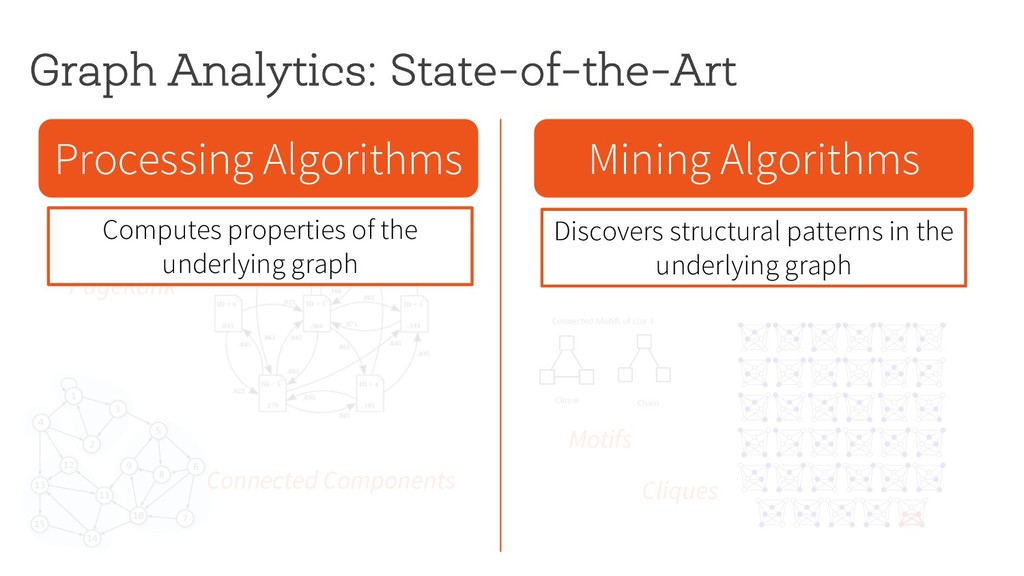
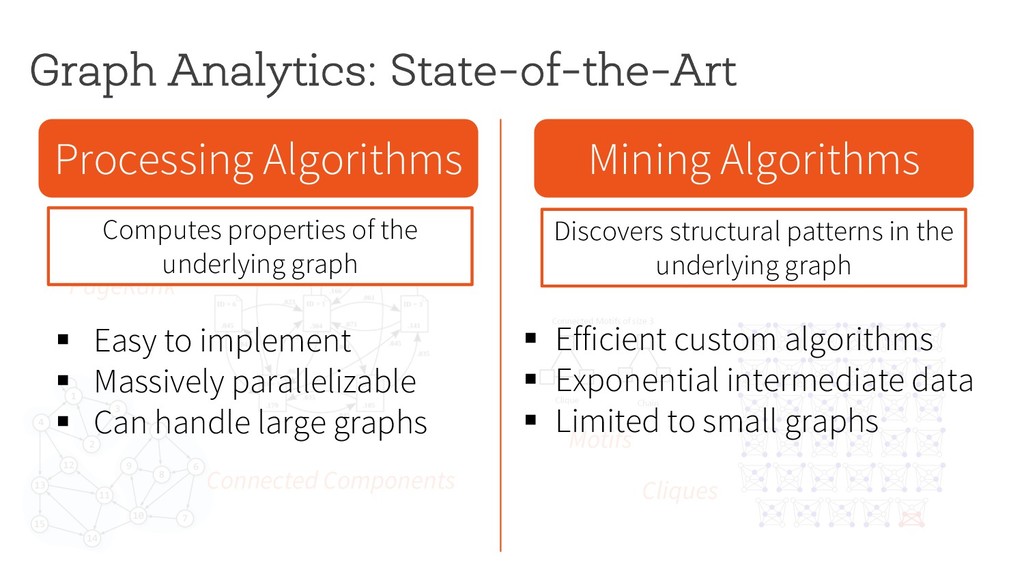
Motifs Cliques § Easy to implement § Massively parallelizable § Can handle large graphs Computes properties of the underlying graph Discovers structural patterns in the underlying graph
Motifs Cliques § Easy to implement § Massively parallelizable § Can handle large graphs § Efficient custom algorithms § Exponential intermediate data § Limited to small graphs Computes properties of the underlying graph Discovers structural patterns in the underlying graph
Motifs Cliques § Easy to implement § Massively parallelizable § Can handle large graphs § Efficient custom algorithms § Exponential intermediate data § Limited to small graphs Challenging to mine patterns in large graphs Computes properties of the underlying graph Discovers structural patterns in the underlying graph
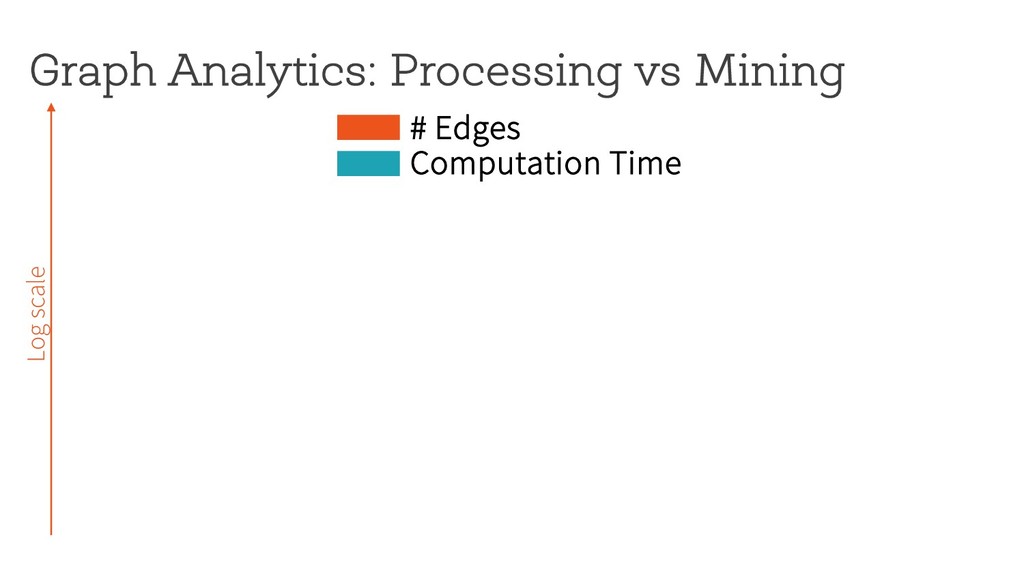
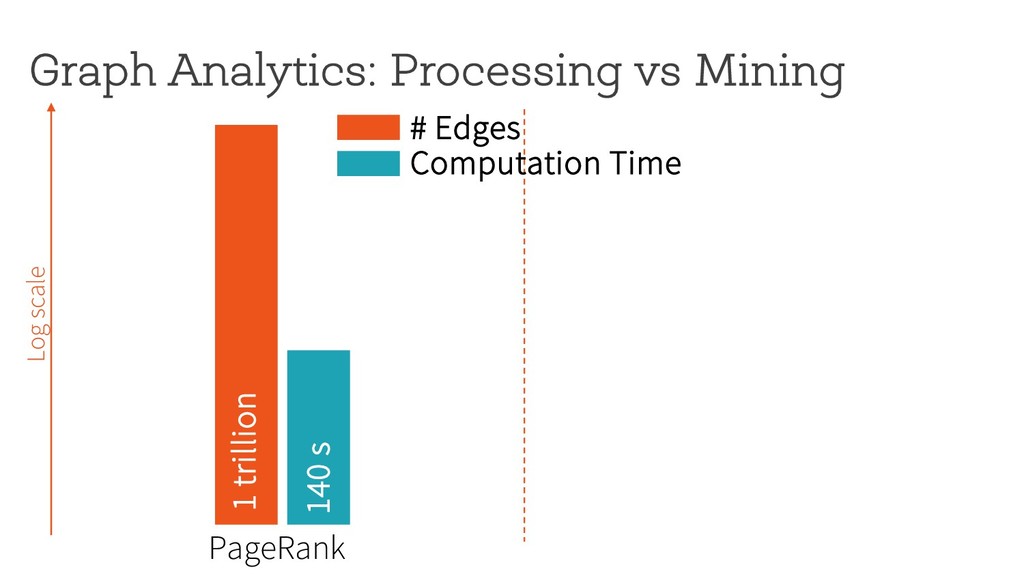
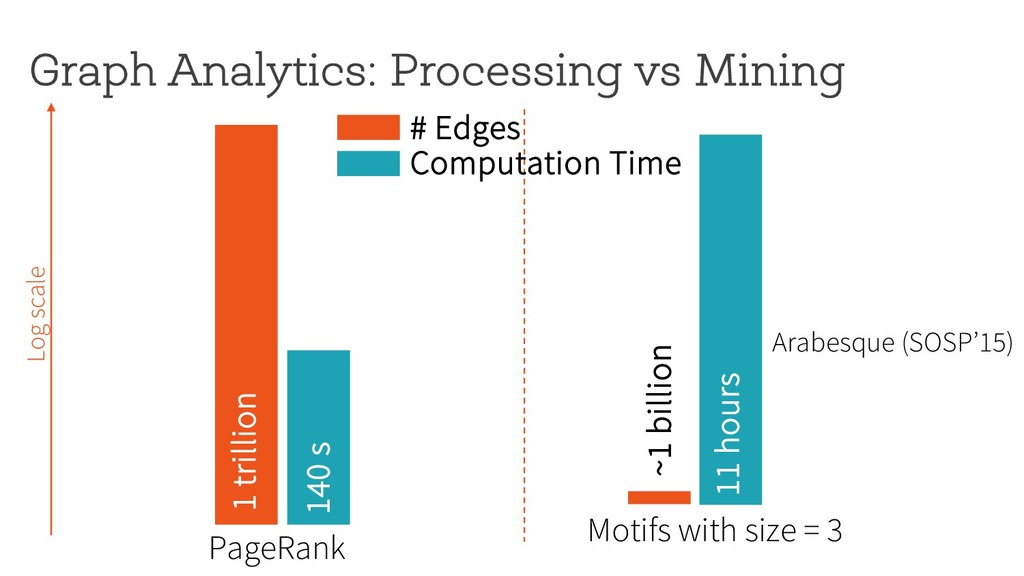
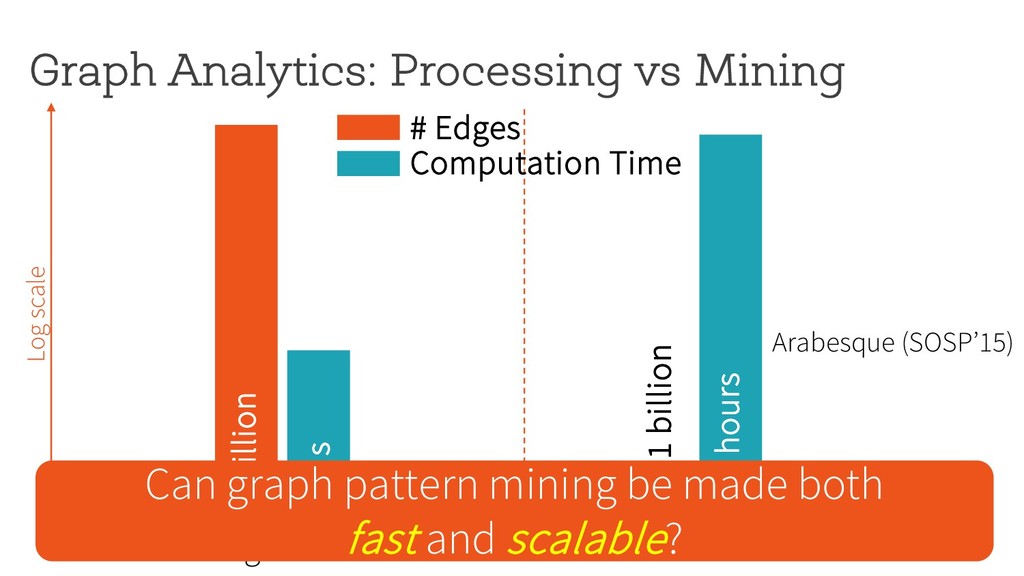
~1 billion 11 hours Motifs with size = 3 Log scale # Edges Computation Time Can graph pattern mining be made both fast and scalable? Arabesque (SOSP’15)
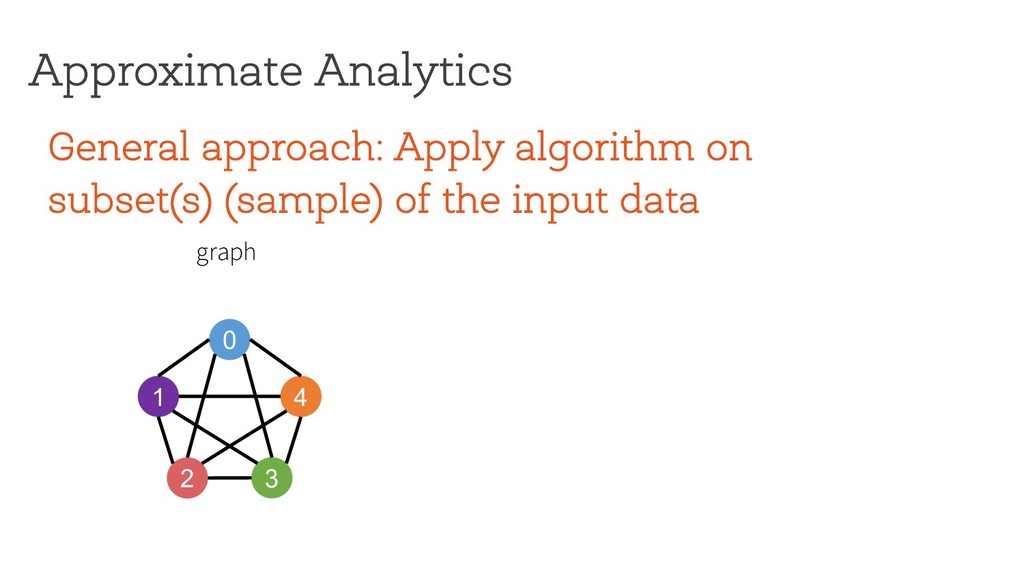
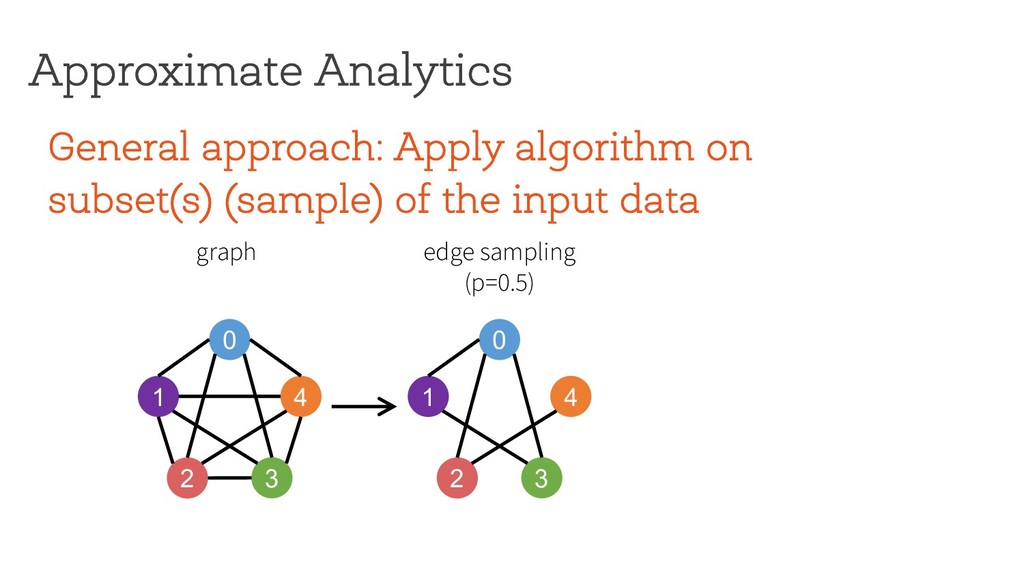
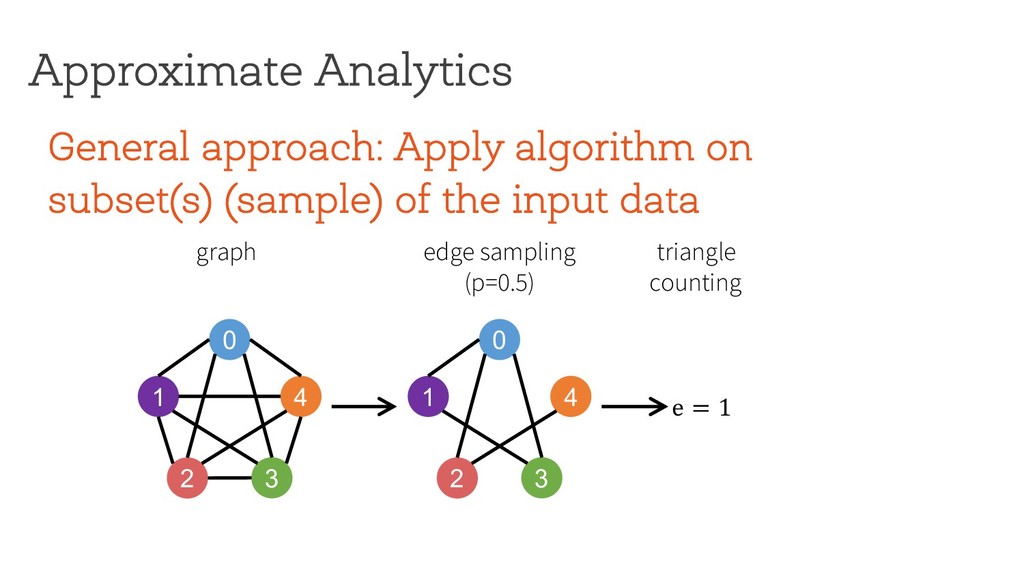
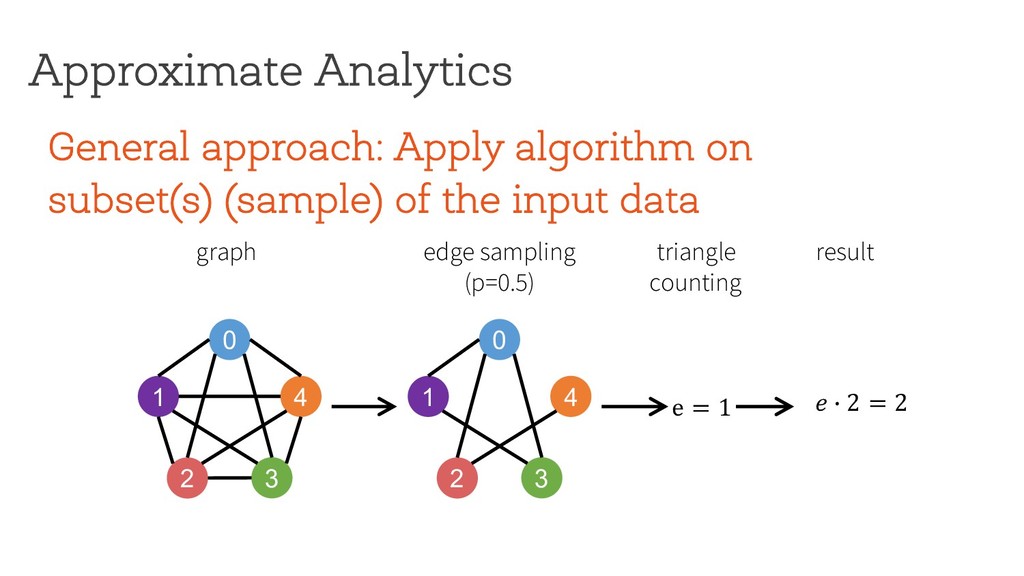
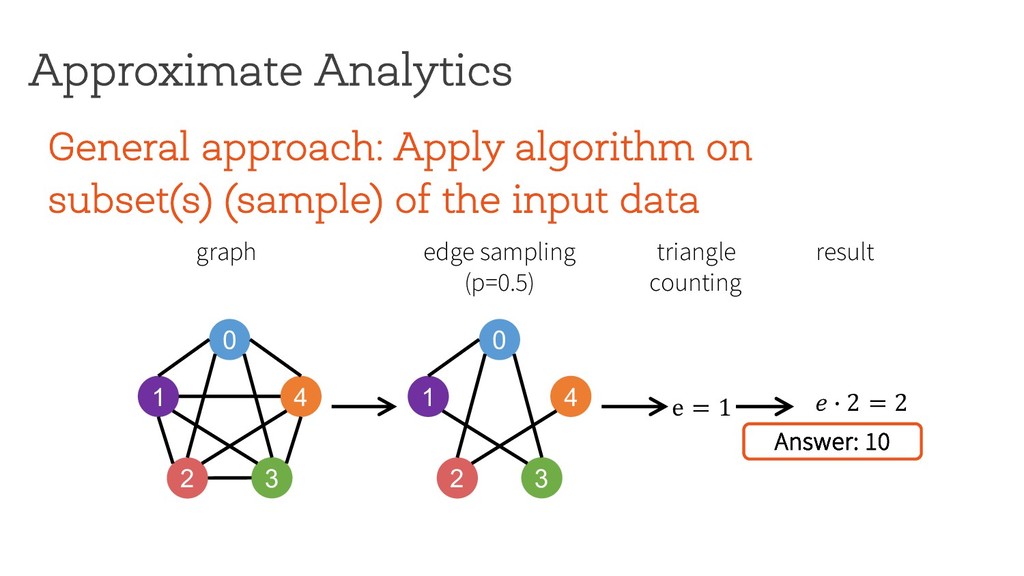
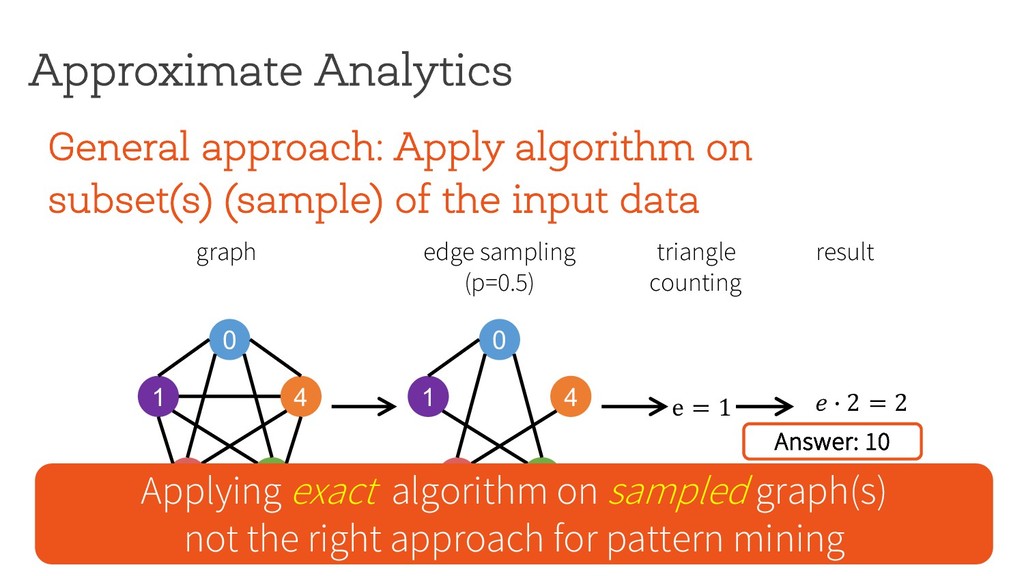
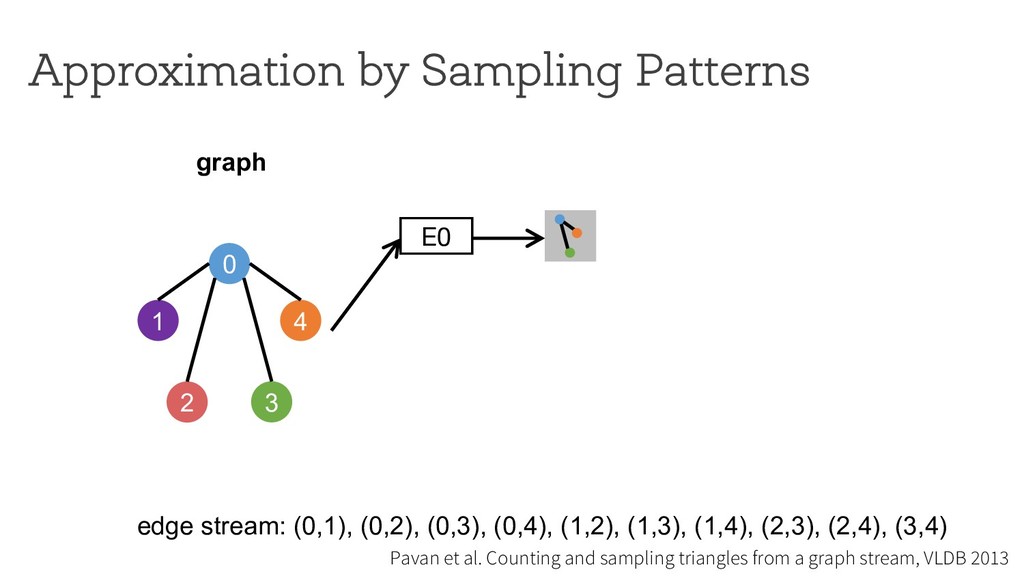
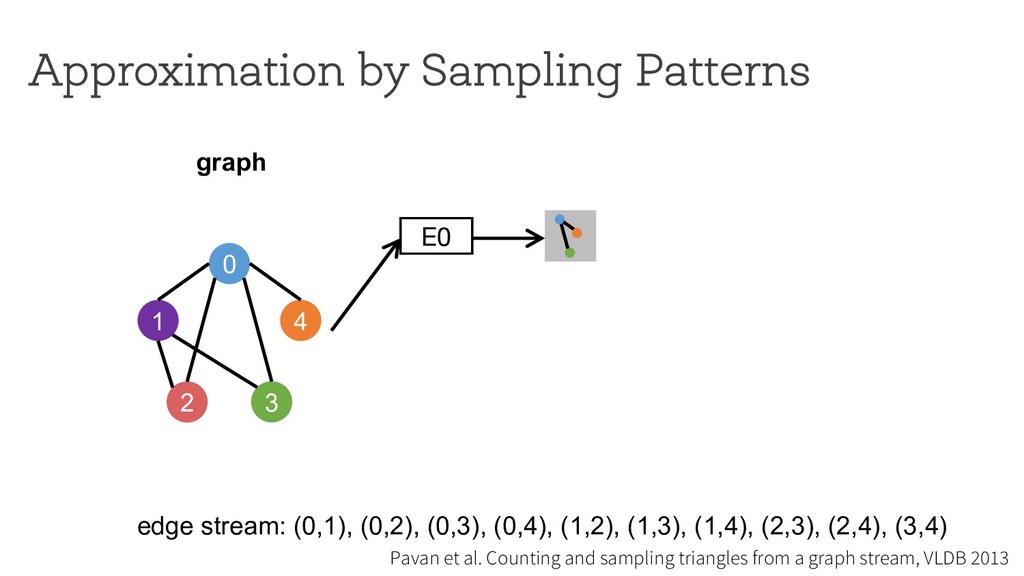
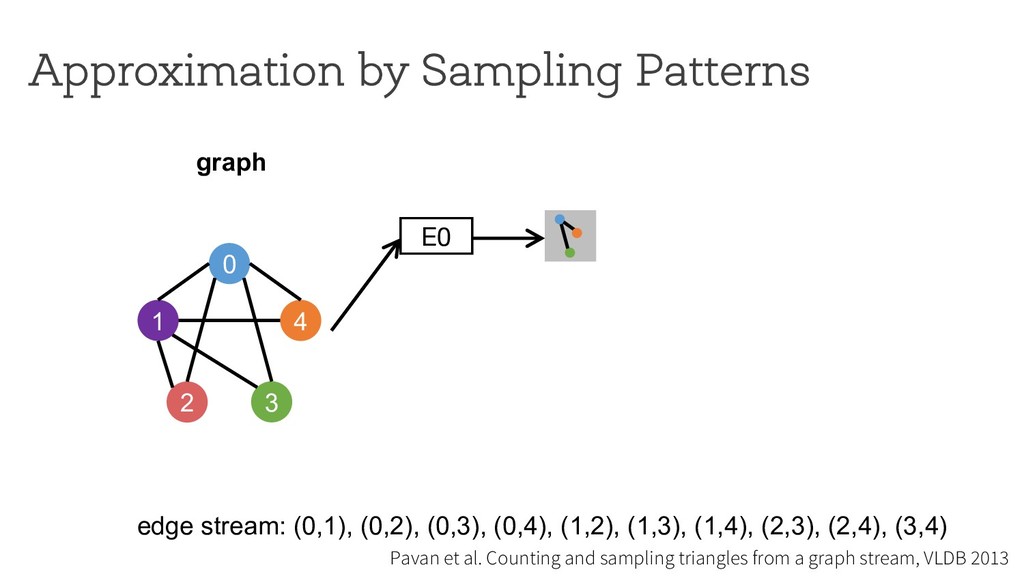
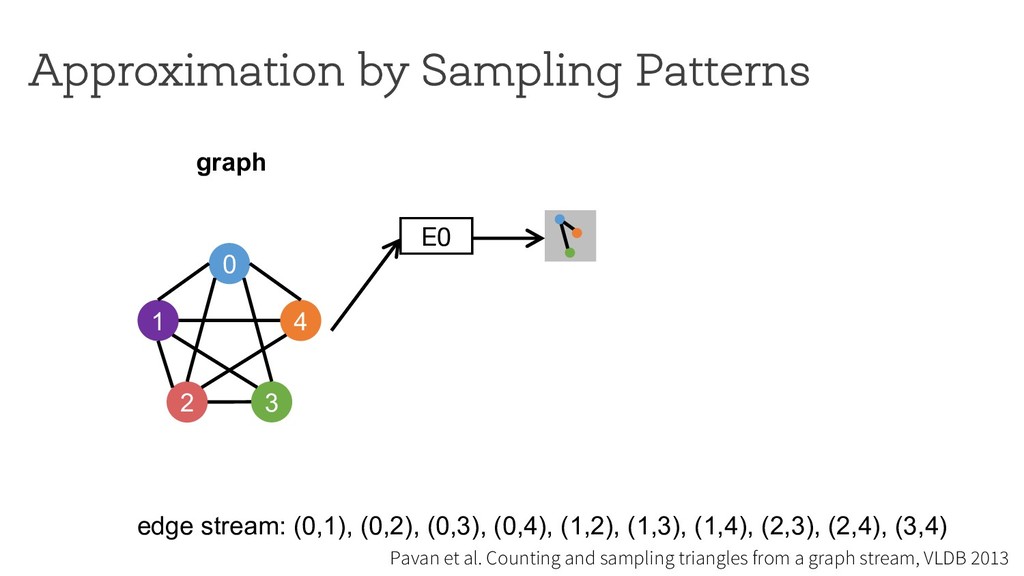
the input data Approximate Analytics 0 1 4 2 3 edge sampling (p=0.5) graph e = 1 0 1 4 2 3 triangle counting result $ % 2 = 2 Applying exact algorithm on sampled graph(s) not the right approach for pattern mining
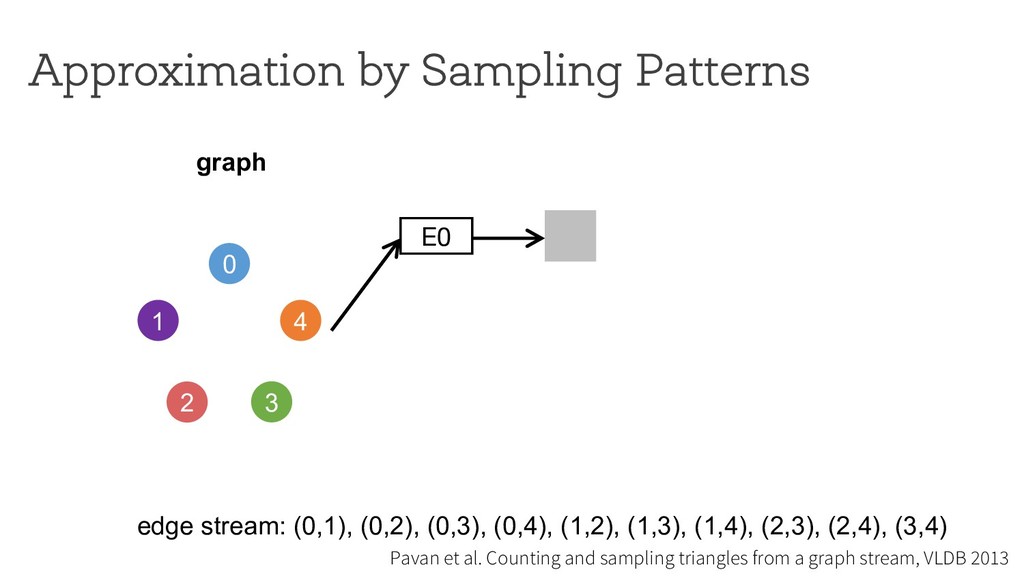
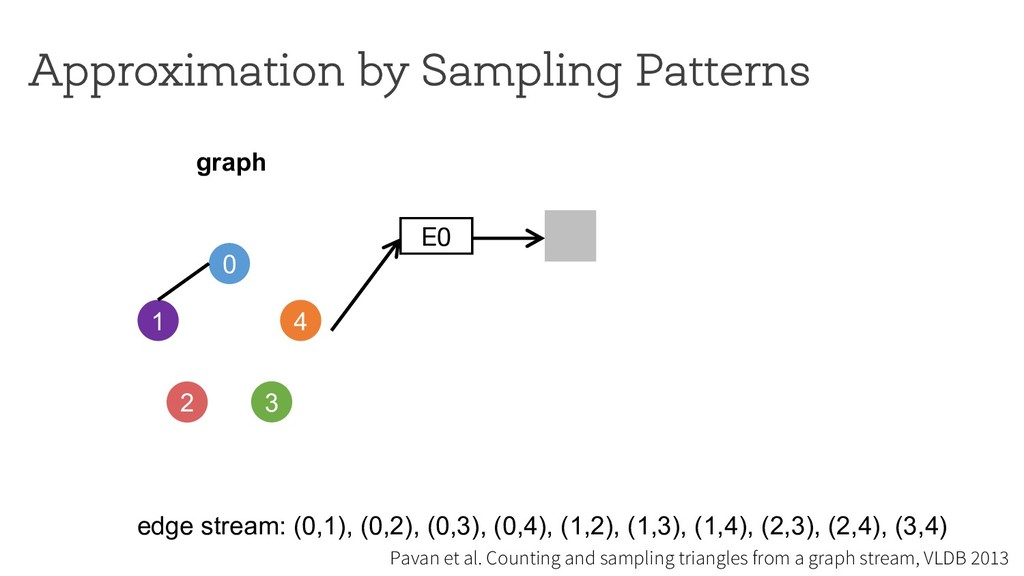
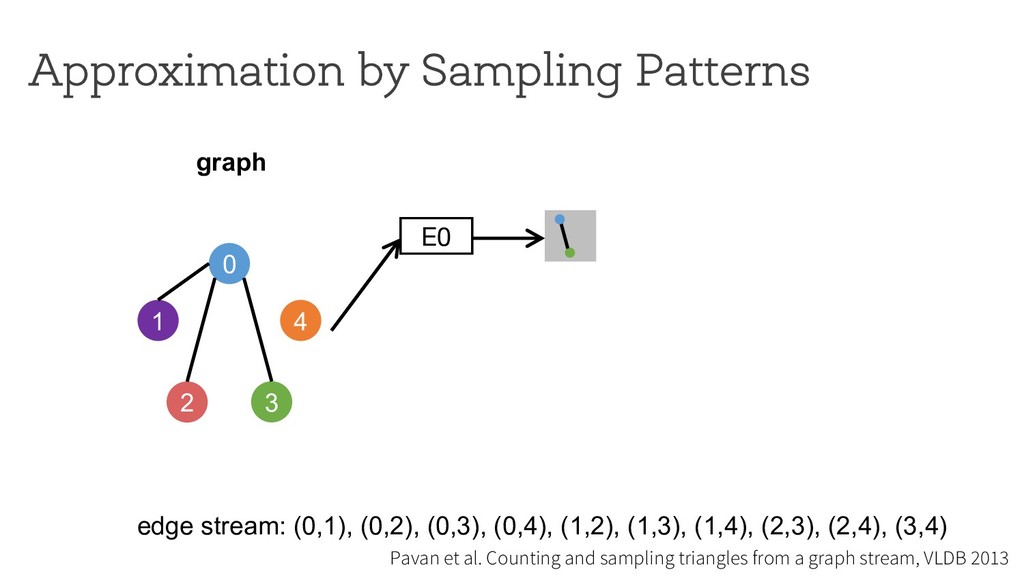
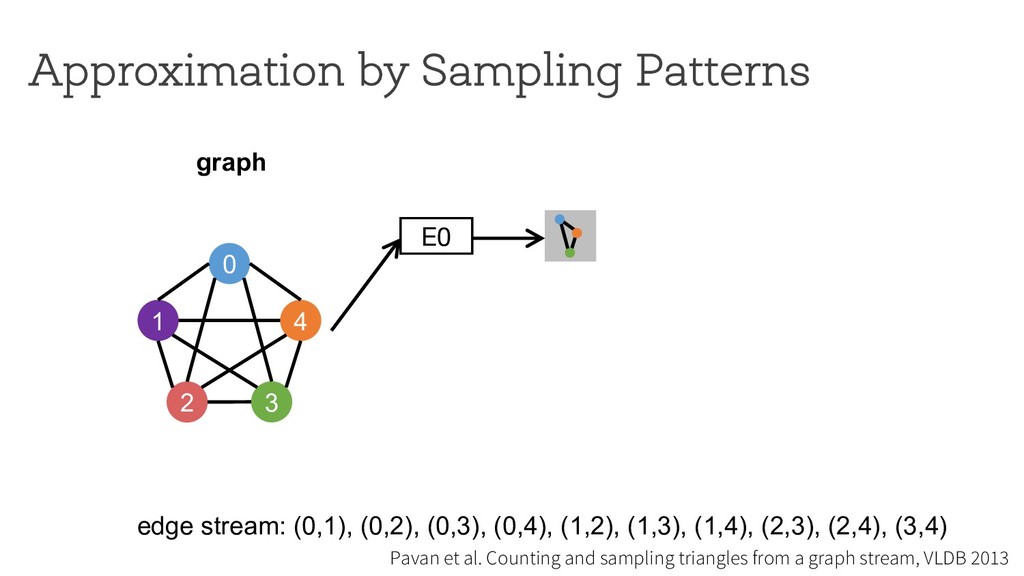
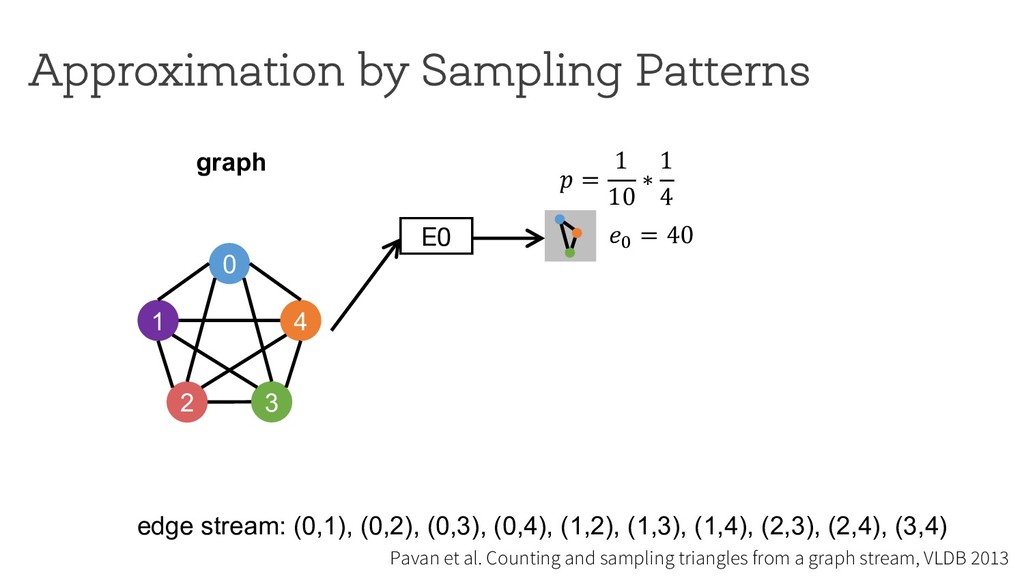
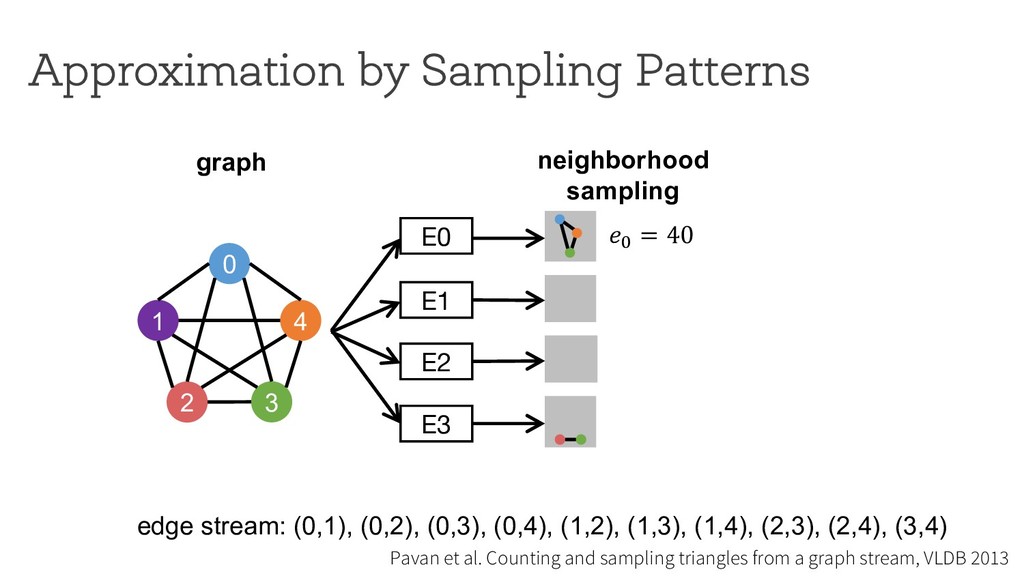
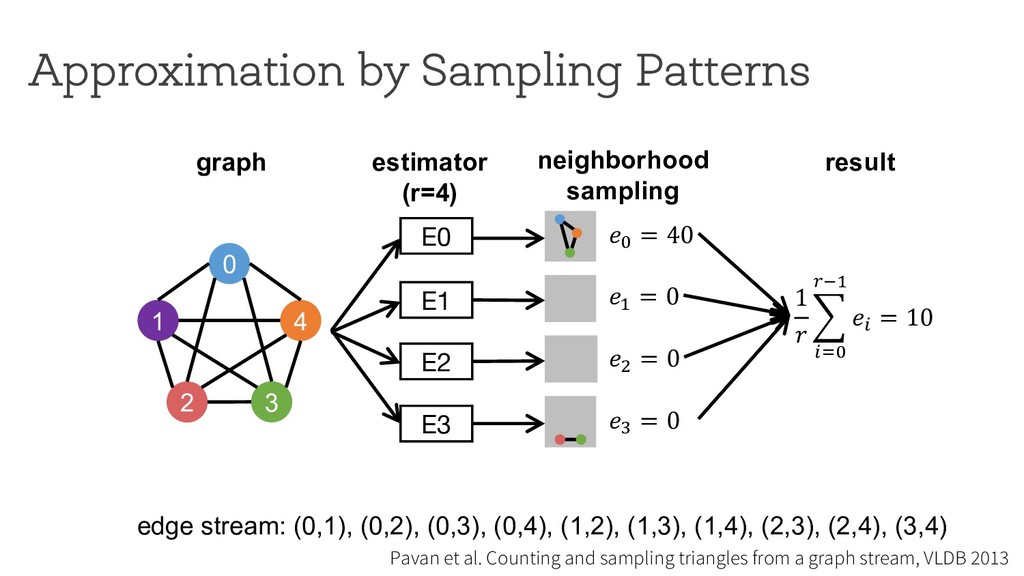
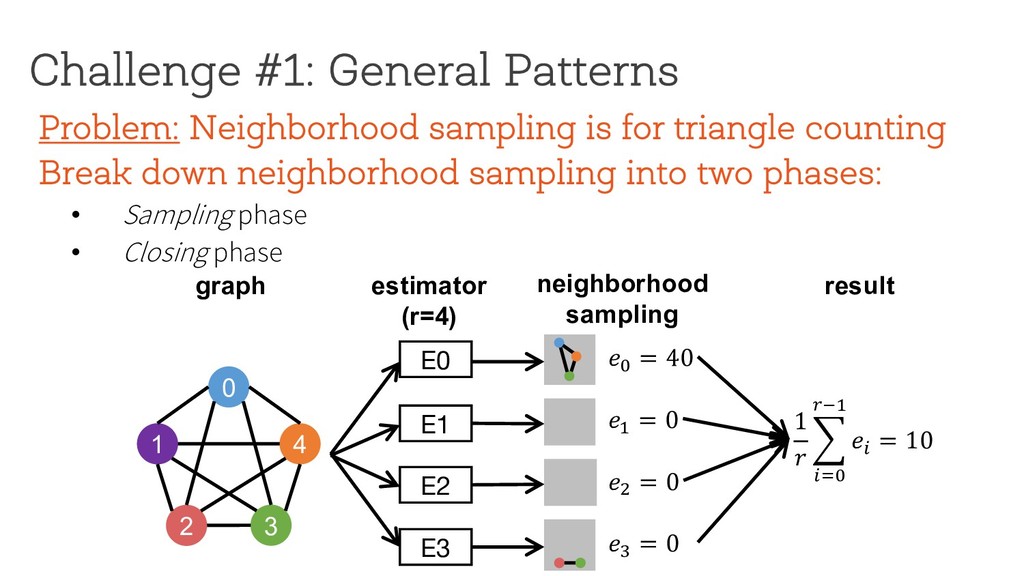
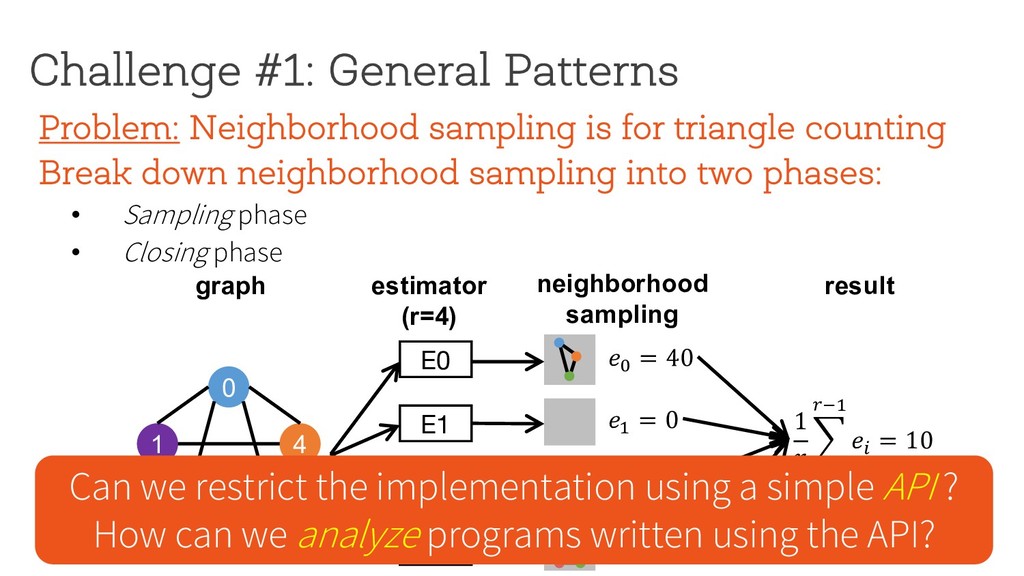
counting Break down neighborhood sampling into two phases: • Sampling phase • Closing phase ! = 1 10 ∗ 1 4 E0 0 1 4 2 3 estimator (r=4) neighborhood sampling graph E1 E2 E3 '( = 40 result 1 ) * +,( -./ '+ = 10 '/ = 0 '0 = 0 '1 = 0 Can we restrict the implementation using a simple API ? How can we analyze programs written using the API?
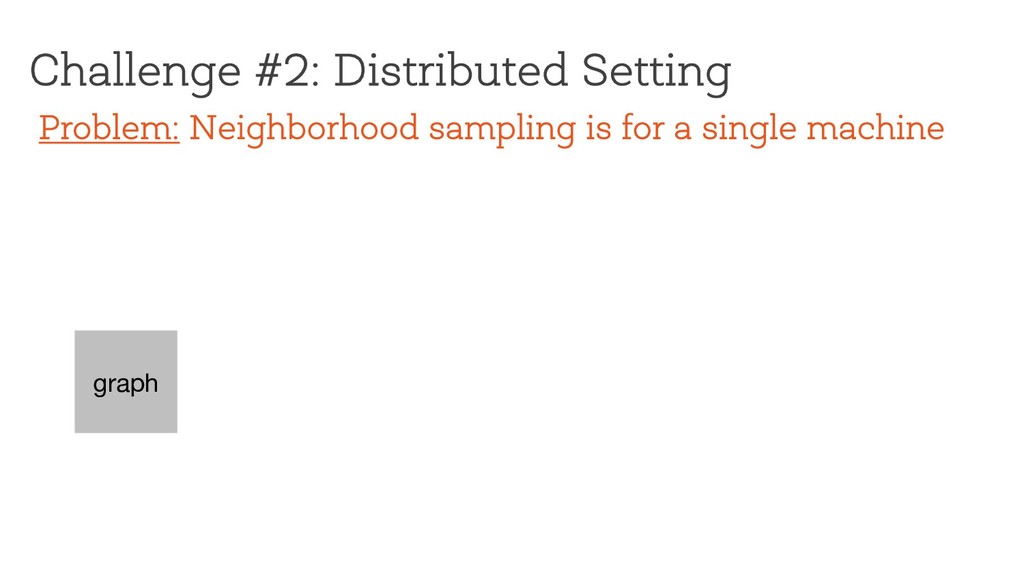
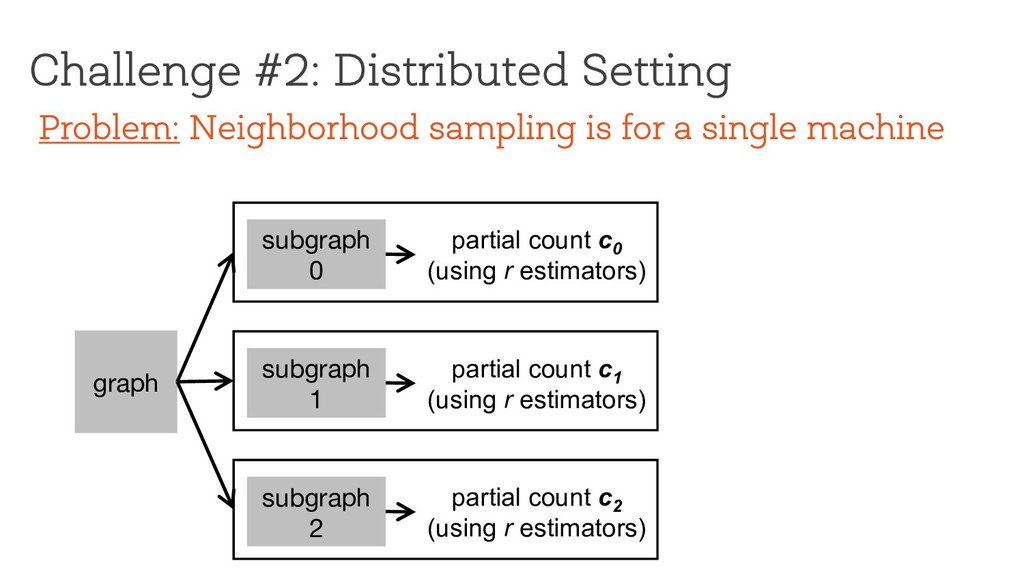
0 (using r estimators) subgraph 1 partial count c 1 (using r estimators) subgraph 2 partial count c 2 (using r estimators) Problem: Neighborhood sampling is for a single machine
partial count c 0 (using r estimators) subgraph 1 partial count c 1 (using r estimators) subgraph 2 partial count c 2 (using r estimators) Problem: Neighborhood sampling is for a single machine
partial count c 0 (using r estimators) subgraph 1 partial count c 1 (using r estimators) subgraph 2 partial count c 2 (using r estimators) Problem: Neighborhood sampling is for a single machine
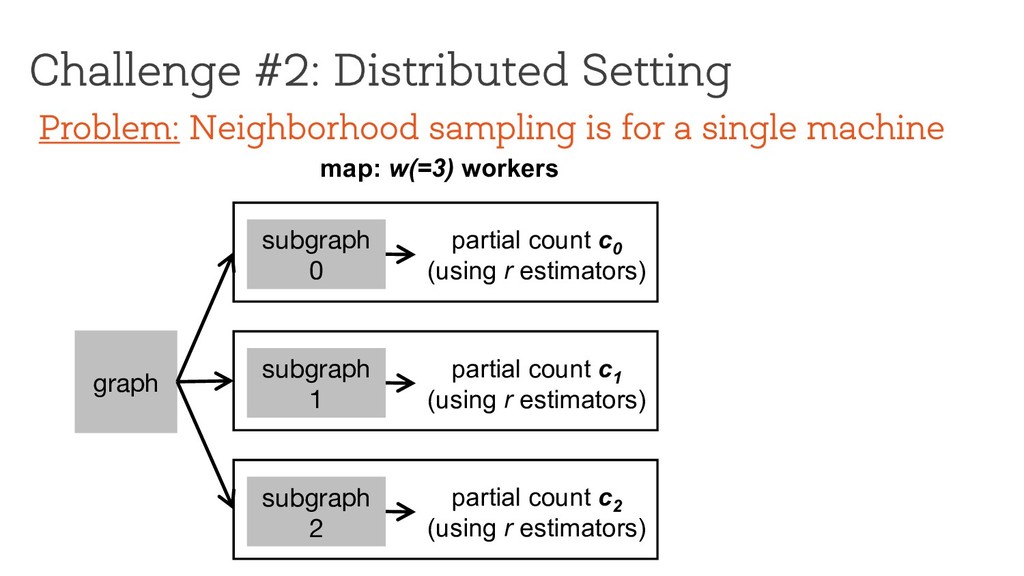
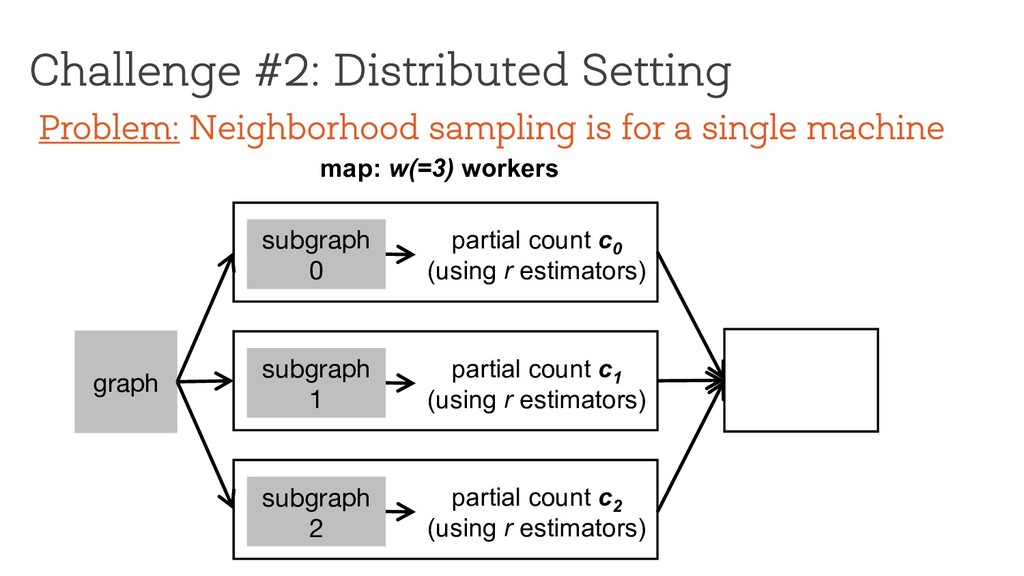
w(=3) workers subgraph 0 partial count c 0 (using r estimators) subgraph 1 partial count c 1 (using r estimators) subgraph 2 partial count c 2 (using r estimators) Problem: Neighborhood sampling is for a single machine
w(=3) workers reduce subgraph 0 partial count c 0 (using r estimators) subgraph 1 partial count c 1 (using r estimators) subgraph 2 partial count c 2 (using r estimators) Problem: Neighborhood sampling is for a single machine
w(=3) workers reduce subgraph 0 partial count c 0 (using r estimators) subgraph 1 partial count c 1 (using r estimators) subgraph 2 partial count c 2 (using r estimators) )(+) Problem: Neighborhood sampling is for a single machine
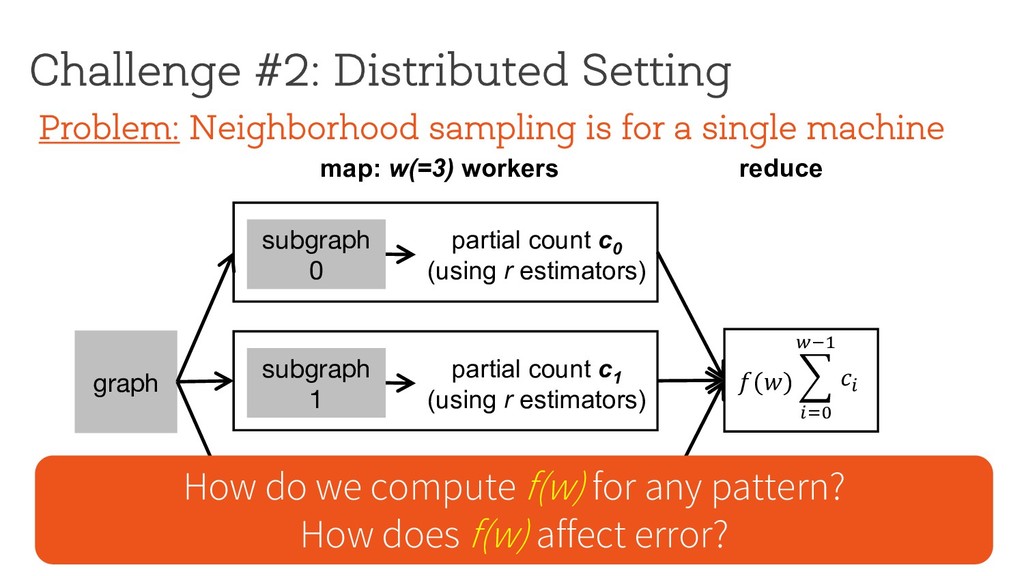
w(=3) workers reduce subgraph 0 partial count c 0 (using r estimators) subgraph 1 partial count c 1 (using r estimators) subgraph 2 partial count c 2 (using r estimators) )(+) Problem: Neighborhood sampling is for a single machine How do we compute f(w) for any pattern? How does f(w) affect error?
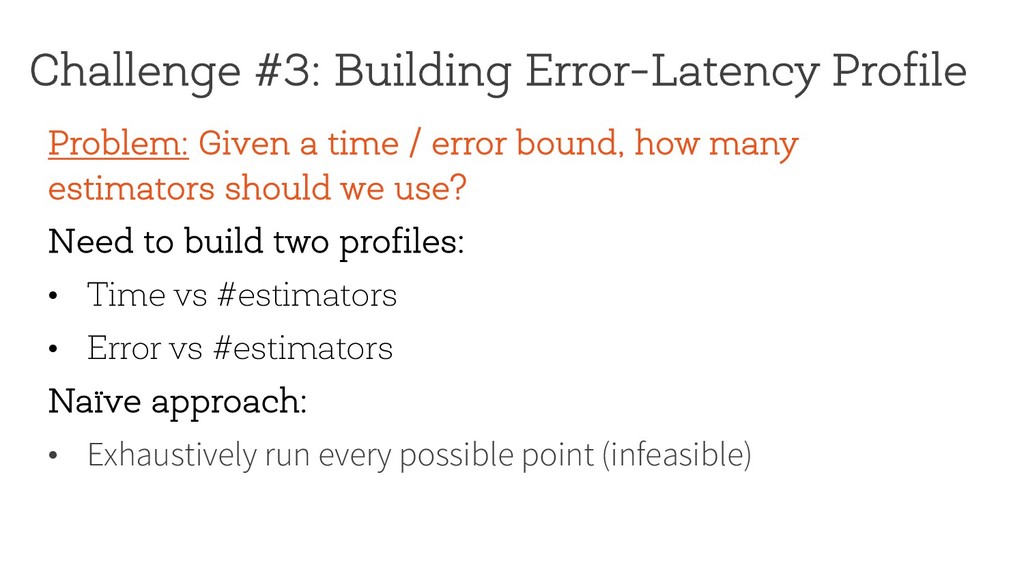
error bound, how many estimators should we use? Need to build two profiles: • Time vs #estimators • Error vs #estimators Naïve approach: • Exhaustively run every possible point (infeasible)
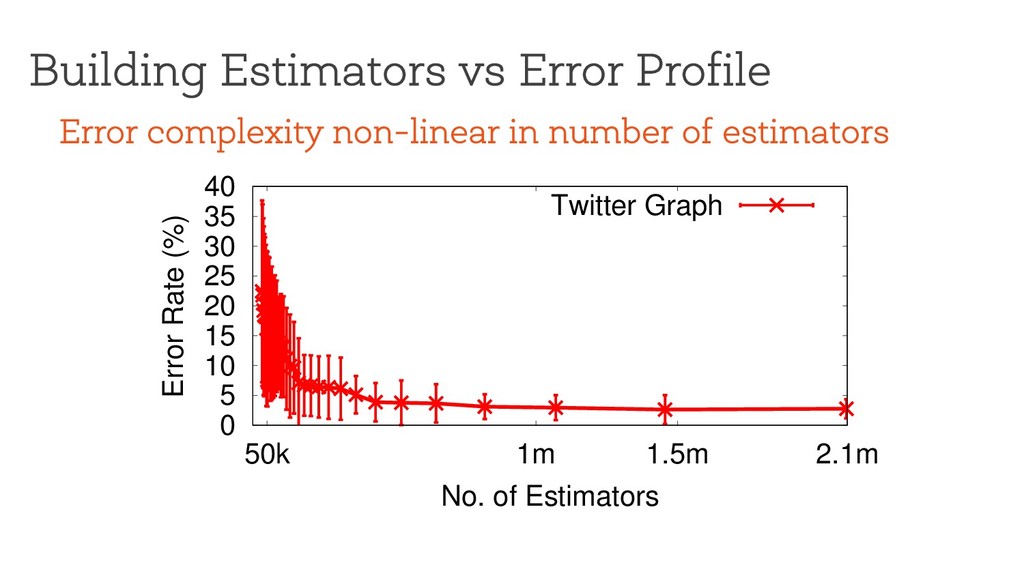
25 30 35 40 50k 1m 1.5m 2.1m Error Rate (%) No. of Estimators Twitter Graph Error complexity non-linear in number of estimators Leverage techniques like experiment design/Bayesian optimization? How do we avoid the need to know the ground truth?
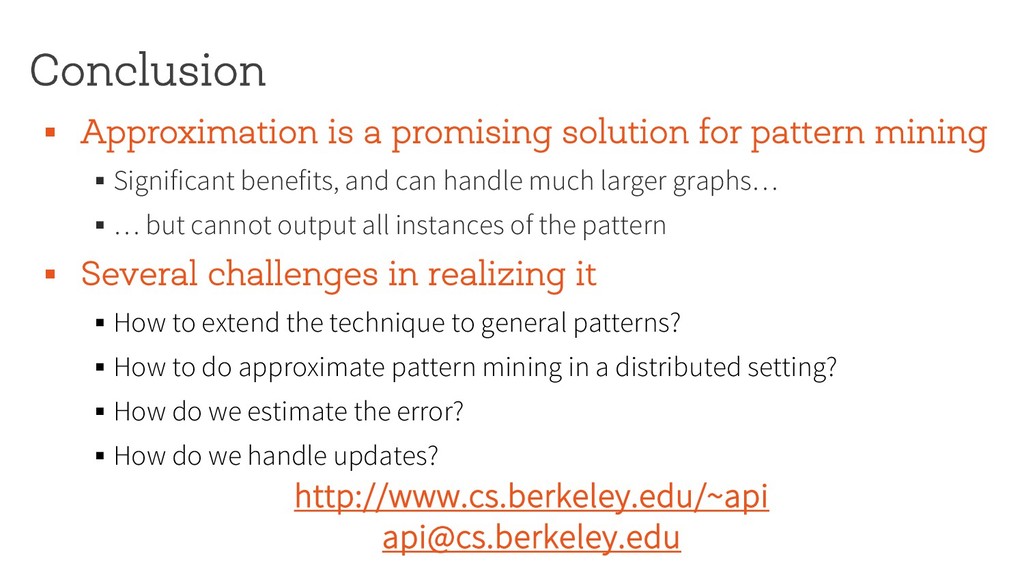
§ Significant benefits, and can handle much larger graphs… § … but cannot output all instances of the pattern § Several challenges in realizing it § How to extend the technique to general patterns? § How to do approximate pattern mining in a distributed setting? § How do we estimate the error? § How do we handle updates? http://www.cs.berkeley.edu/~api [email protected]