Upgrade to Pro — share decks privately, control downloads, hide ads and more …

HDR defense presentation

Andrea Rau
September 26, 2017

HDR defense presentation

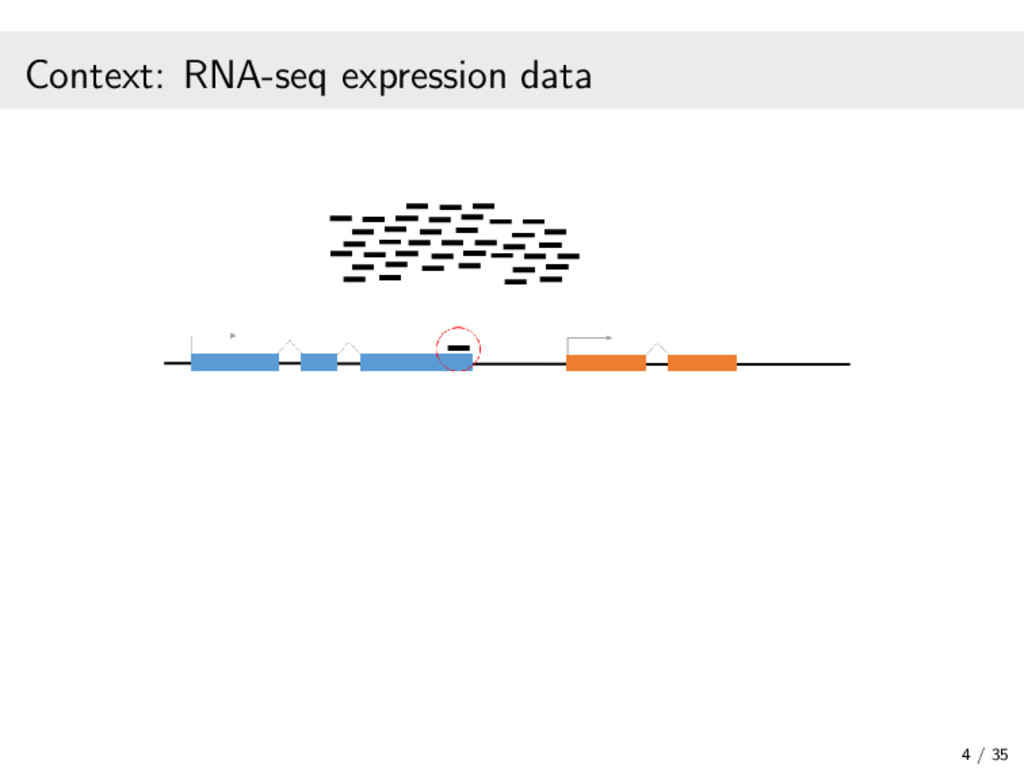
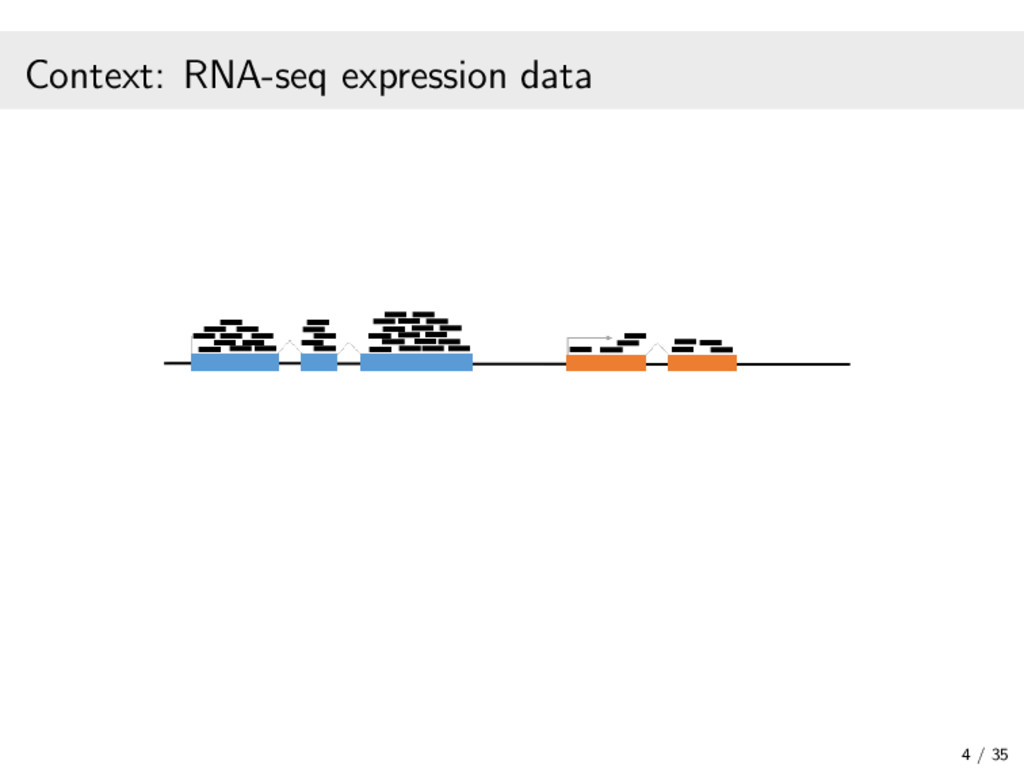
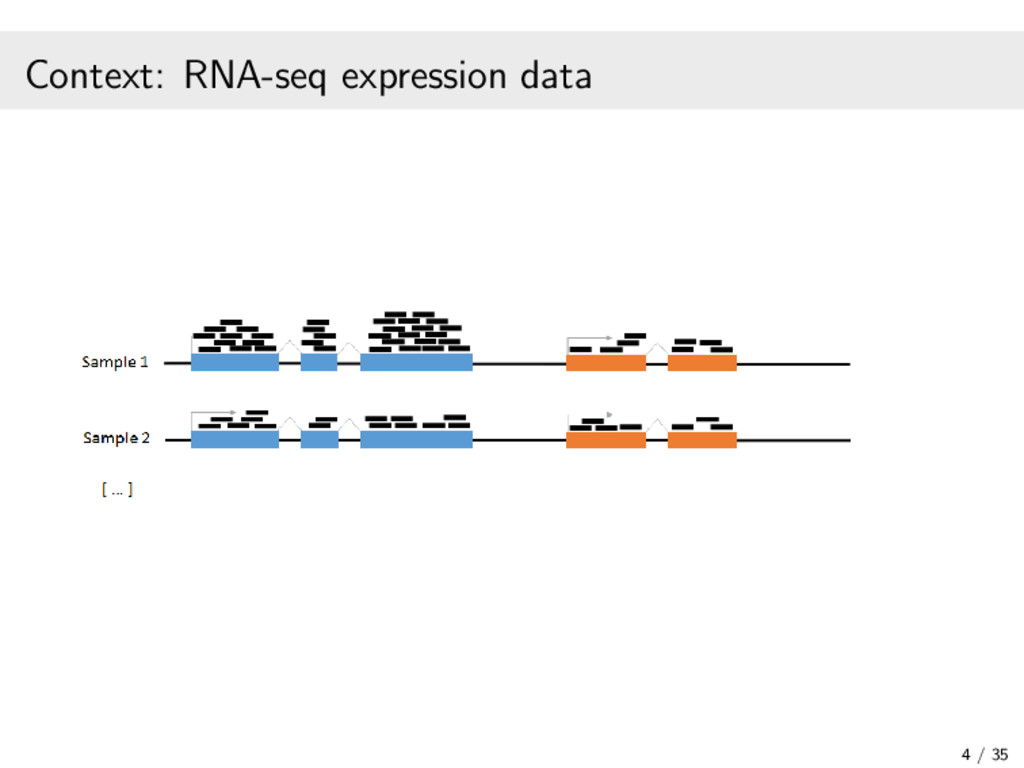
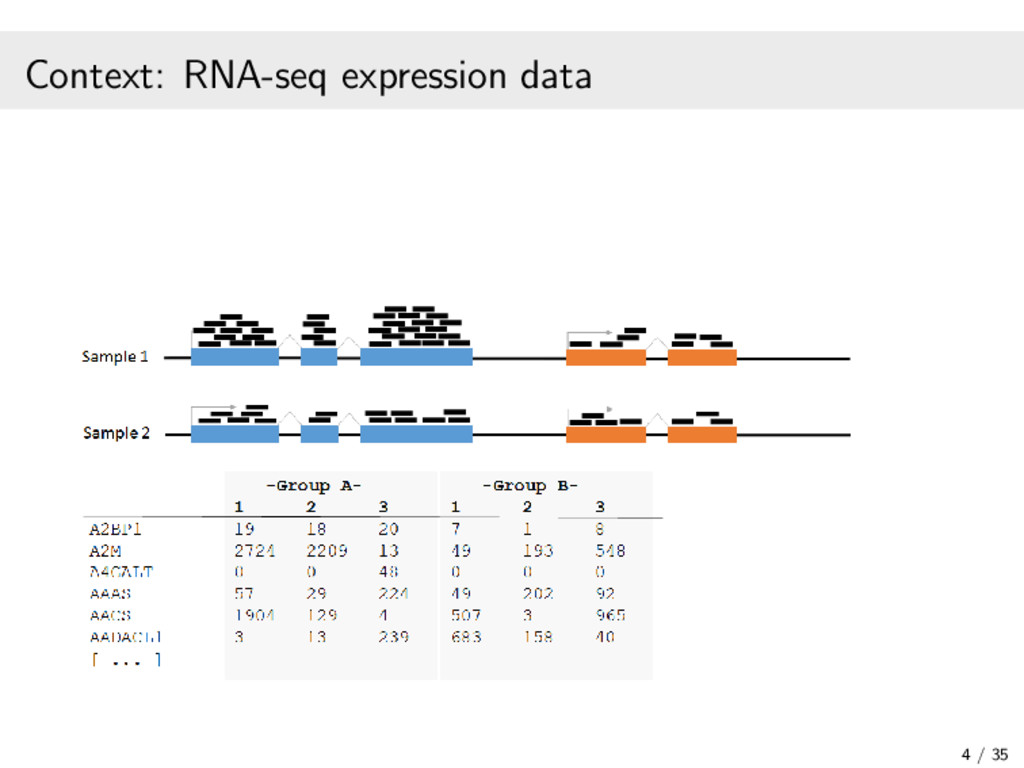
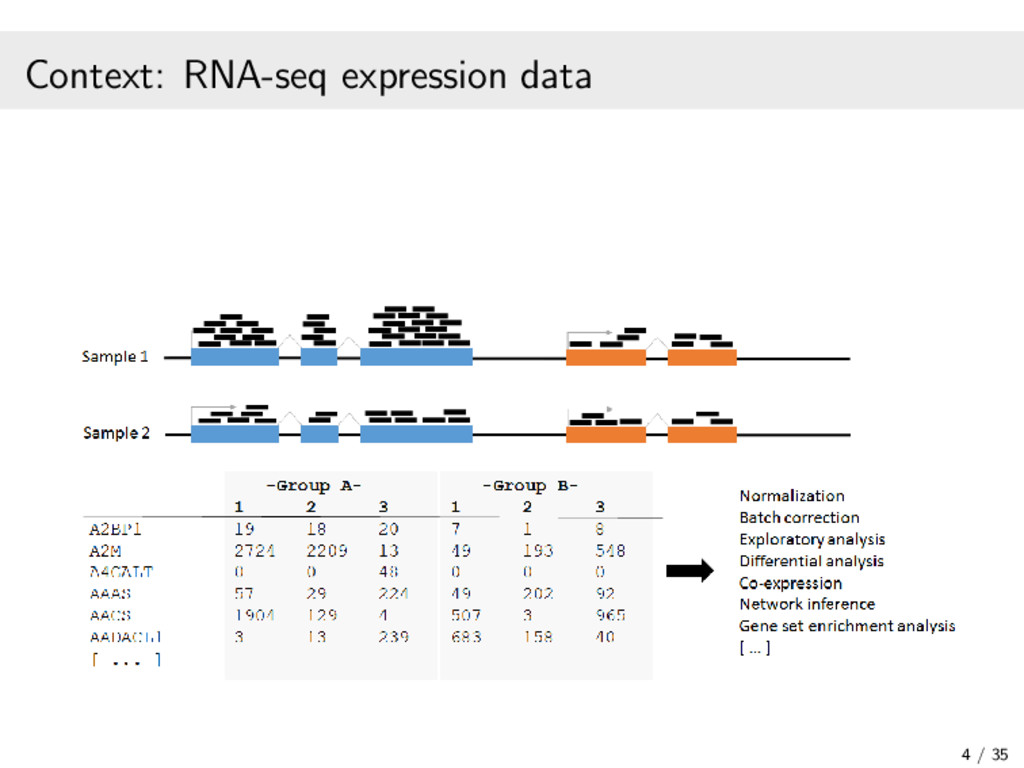
In recent years, high-throughput sequencing (HTS) has become an essential tool for genomic and transcriptomic studies. In particular, the use of HTS to directly sequence reverse-transcribed RNA molecules, known as RNA sequencing (RNA-seq), has revolutionized the study of gene expression. In turn, a great deal of methodological research has focused on developing analysis pipelines that are well suited to the characteristics of RNA-seq data. In this work, I focus on methodological contributions to three analytical goals: (1) the powerful detection of differentially expressed genes from RNA-seq data, in particular through a data-based filter for weakly expressed genes and a P-value combination approach for data arising from multiple related studies; (2) the identification of clusters of co-expressed genes from RNA-seq data using finite mixture models, appropriately chosen transformations, and adapted model selection criteria; and (3) the inference of gene regulatory networks from observational RNA-seq data or arbitrarily complex gene knockout expression data. In addition, I will present some of the open-source software packages I have developed and continue to maintain for the implementation of our proposed statistical methods. Finally, I will discuss some related research perspectives regarding methodological developments for multi-omics data integration.

Andrea Rau

September 26, 2017
Tweet

More Decks by Andrea Rau

Other Decks in Science

Transcript

  1. Statistical methods and software for the analysis of transcriptomic data

    Andrea Rau HDR defense September 26, 2017 Universit´ e d’´ Evry-Val-d’Essonne
  2. 2005 B.A. Mathematics & French 2007 M.S. Applied Statistics 2010

    Ph.D. Statistics Prof. R. W. Doerge, Dr. F. Jaffr´ ezic, Dr. J.-L. Foulley Reverse engineering gene networks using genomic time-course data 2010-2011 Post-doctoral fellowship Dr. G. Celeux, Dr. M.-L. Martin-Magniette Methods for RNA-seq co-expression analysis 2011-today Charg´ ee de Recherche Animal Genetics & Integrative Biology (GABI) unit, Jouy en Josas
  3. Supervision and teaching Student (co-)supervision: 2 Ph.D. students and 1

    3-month Erasmus+ Ph.D. mobility M´ elina Gallopin (defended December 2015), Gilles Monneret (expected December 2017), Manuel Revilla S´ anchez (defended June 2017) 7 Master’s students Rapha¨ elle Momal-Leisenring (2017), Fr´ ed´ eric Jehl (2017), Babacar Ciss (2016), Audrey Hulot (2015), Meriem Benabbas (2015), M´ elina Gallopin (2012), R´ emi Bancal (2012) Teaching: M1/M2 biostatistics courses at Universit´ e Paris-Sud (2011-2012), Ensai (2012-2017), UEVE (2016-2017) Researcher training schools: INRA-PEPI school (2012), RGB-Net COST action (2012), Agrocampus Ouest (2016-2017), Saclay Plant Sciences (2016), PiGutNet COST action (2017) Organization of BioBayes school on Bayesian statistics (2013) + co-author of subsequent book 3 / 35
  4. Differential analysis of RNA-seq data Is there a statistically significant

    difference in the expression of gene i between experimental conditions? Variable library sizes among experiments + technical biases ⇒ per-sample normalization factors (mj ) needed1 Discrete, non-negative, highly skewed data ⇒ transformation + precision weights or negative binomial models : yij ∼ NB (mj qij , φi ) log(qij ) = Xj βi Differential expression for gene i via hypothesis testing: H0i : cβi = 0 1Statomique consortium (Dillies et al., 2013) 7 / 35
  5. Filtering in differential analyses Stringent multiple testing correction (e.g., FDR

    control) due to large number of hypothesis tests Usually assume P-values are uniformly distributed under H0 p−values Frequency 0.0 0.2 0.4 0.6 0.8 1.0 0 200 400 600 800 1000 1200 Identify and remove genes that generate an uninformative signal Only test hypotheses for genes passing filter ⇒ tempered correction for multiple testing Filtering thresholds tend to be fairly ad hoc in practice 8 / 35
  6. A data-based filter for RNA-seq data2 ˜ yj = yj

    /mj : normalized read counts in sample j from condition C(j) Idea: identify a filtering threshold s that maximizes the filtering similarity among replicates within the same condition using the Jaccard index Js(˜ yj , ˜ yj ) = a a + b + c Sample j Normalized counts > s Normalized counts ≤ s Sample j Normalized counts > s a b Normalized counts ≤ s c d 2Joint work with M. Gallopin, G. Celeux, and F. Jaffr´ ezic (Rau et al., 2013) 9 / 35
  7. A data-based filter for RNA-seq data Multiple replicates/conditions typically available

    ⇒ global filtering similarity by averaging pairwise Jaccard indices within conditions: Js (˜ y) = mean Js(˜ yj , ˜ yj ) : j < j and C(j) = C(j ) Data-based filter threshold: s = arg max s Js (˜ y) ⇒ Filter genes with normalized read counts ≤ s in all samples 10 / 35
  8. A data-based filter for RNA-seq data Increased detection power for

    moderately/strongly expressed genes 11 / 35
  9. HTSFilter: A data-based filter for RNA-seq data > library(HTSFilter) >

    library(DESeq2) > > dds <- DESeq(ddsObject) > filter <- HTSFilter(dds)$filteredData > res <- results(filter, independentFiltering=FALSE) 12 / 35
  10. Gene co-expression is... Groups of co-transcribed genes Similar expression patterns/trends

    over a range of experiments (correlation, partial correlation, clustering) Related to shared regulatory inputs, functional pathways, and biological process(es) characterize orphan genes Image sources: Google search “co-expression analysis” 14 / 35
  11. How should co-expression be defined for RNA-seq? : Cluster measure

    of relative expression independent of overall expression 0 500 1000 1500 2000 2500 0 5 10 15 Sample Normalized expression A 0 2 4 6 8 0 5 10 15 Sample Log(normalized expression + 1) B 0.00 0.05 0.10 0.15 0.20 0.25 0 5 10 15 Sample Normalized expression profiles Group 1 2 3 4 C 15 / 35
  12. How should co-expression be defined for RNA-seq? : Cluster measure

    of relative expression independent of overall expression 0 500 1000 1500 2000 2500 0 5 10 15 Sample Normalized expression A 0 2 4 6 8 0 5 10 15 Sample Log(normalized expression + 1) B 0.00 0.05 0.10 0.15 0.20 0.25 0 5 10 15 Sample Normalized expression profiles Group 1 2 3 4 C Normalized profile for gene i: pij = ˜ yij +1 ˜ yi +1 15 / 35
  13. Some strategies for mixture models for RNA-seq data3 f (·|K,

    ΨK ) = n i=1 K k=1 πkfk(·|θk) 1 Directly model read counts: HTSCluster yi |gene i ∈ cluster k ∼ J j=1 Poisson(yij |µijk) 2 Apply appropriately chosen transformation: coseq g(yi )|gene i ∈ cluster k ∼ N(µk, Σk) 3 Model the compositional nature of profiles: coseq g(pi )|gene i ∈ cluster k ∼ N(µk, Σk) 3 Joint work with C. Maugis-Rabusseau, M.-L. Martin-Magniette, G. Celeux, A. Godichon-Baggioni. 16 / 35
  14. Transformations for normalized profiles Normalized profiles pij are compositional data,

    i.e. linear dependence of pi· = 1 ⇒ pi imposes constraints on covariance matrices Σk that are problematic for Gaussian mixture models 18 / 35
  15. Transformations for normalized profiles Normalized profiles pij are compositional data,

    i.e. linear dependence of pi· = 1 ⇒ pi imposes constraints on covariance matrices Σk that are problematic for Gaussian mixture models : Transform normalized profiles to break the linear sum constraint garcsin(pij ) = arcsin √ pij ∈ [0, π/2], glogit(pij ) = log pij 1 − pij ∈ (−∞, ∞) ... and fit a Gaussian mixture model to transformed normalized profiles (for simplicity we’ll only consider the [pkLkCk] model: variable proportions, volume, orientation, and shape) 18 / 35
  16. Choosing a transformation with model selection criteria g(x) = arbitrary

    monotonic transformation of a data x If g(x) ∼ f (.|ΨK ) (a GMM) ⇒ initial data x is an i.i.d. sample from fg (.|ΨK ) (obviously not necessarily a GMM) 19 / 35
  17. Choosing a transformation with model selection criteria g(x) = arbitrary

    monotonic transformation of a data x If g(x) ∼ f (.|ΨK ) (a GMM) ⇒ initial data x is an i.i.d. sample from fg (.|ΨK ) (obviously not necessarily a GMM) : select the pair (K, g) minimizing the corrected criteria: BIC∗(K, g) = − log f (y; K, ˆ Ψ(K,g) ) − νK 2 log(n) − log (det(Jg )) ICL∗(K, g) = BIC∗(K, g) + Entropy(K) where Jg = Jacobian of the transformation g and ˆ Ψ(K,g) is the MLE for the model with K clusters and transformation g Note:# of parameters νK does not depend on g 19 / 35
  18. Choosing between arcsin and logit with ICL First calculate log-determinant

    of each transformation: log (det(Jarcsin)) = −nq ln(2) − 1 2 n i=1 q j=1 log (pij (1 − pij )) , log (det(Jlogit)) = −nq ln (ln(2)) − n i=1 q j=1 log (pij (1 − pij )) Then choose the transformation corresponding to the minimum of ICL∗(K, arcsin) and ICL∗(K, logit) 20 / 35
  19. coseq: Co-expression analysis of RNA-seq data > library(coseq) > coexp_arcsin

    <- coseq(counts, K=2:10, model="Normal", > transformation="arcsin") > coexp_logit <- coseq(counts, K=2:10, model="Normal", > transformation="logit") Options: parallelization provided via BiocParallel, filtering, library size normalization, transformation choice (arcsin, logit, CLR, logCLR), approach (Gaussian/Poisson mixture models, K-means) Seamless integration with edgeR/DESeq2 pipeline 21 / 35
  20. coseq: Co-expression analysis of RNA-seq data > plot(coexp_arcsin, ...) 5

    9 1 3 12 4 6 2 7 8 10 11 0.00 0.25 0.50 0.75 1.00 0.00 0.25 0.50 0.75 1.00 0.00 0.25 0.50 0.75 1.00 CP SVZ VZ CP SVZ VZ CP SVZ VZ CP SVZ VZ Conditions Average expression profiles Conditions CP SVZ VZ 23 / 35
  21. coseq: Co-expression analysis of RNA-seq data > plot(coexp_arcsin, ...) Genes

    attributed to cluster with largest conditional probability of membership given the estimated parameters: τik(θ) = πkfk(yi |θk) K =1 π f (yi |θ ) 23 / 35
  22. Functional annotation for co-expression analysis Odds Exp. K GO ID

    p-value Ratio Count Count Size Term 1 GO:0006396 0.0010 4.47 2.10 8 360 RNA processing 6 GO:0016203 0.0006 20.67 0.17 3 30 muscle attachment 11 GO:0019058 0.0008 124.10 0.05 2 3 viral life cycle [...] Integrate functional annotations into the model selection step4 ⇒ Integrated Completed Annotated Likelihood (ICAL) criterion: ICAL(K) = ICL(K) − G g=1 K k=1 ng k log ng k ng ng = # genes annotated for function g, ng k = # genes assigned to cluster k annotated for g 4Joint work with M. Gallopin, G. Celeux, and F. Jaffr´ ezic. 24 / 35
  23. Markov equivalence in Directed Acyclic Graphs Graphs often used to

    represent gene networks Markov equivalence: two different networks can yield same joint distribution and observational data alone generally cannot orient edges 26 / 35
  24. Markov equivalence in Directed Acyclic Graphs Graphs often used to

    represent gene networks Markov equivalence: two different networks can yield same joint distribution and observational data alone generally cannot orient edges Interventions can resolve this ambiguity 26 / 35
  25. Gene expression interventions Gene knock-outs (KO): ⇒ Gene is made

    entirely inoperative Crossbreeding chimeric and wild-type individuals Naturally occuring point mutations causing functional KO CRISPR-Cas9 genome editing Gene knock-downs (KD): ⇒ Gene’s expression is reduced RNA interference (RNAi) Source: https://algae.ucsd.edu/research/cab-comm/genetic-tools.html 27 / 35
  26. Gene expression interventions Mathematically, interventions are a do(Xi = xi

    ) operation Do-calculus (Pearl, 2000): E(Xj |do(Xi = xi )) = E(Xj ) if Xj ∈ pa(Xi ) E(Xj |xi , pa(Xi ))P(pa(Xi ))dpa(Xi ) if Xj / ∈ pa(Xi ) Total causal effects: βij = ∂ ∂x E(Xj |do(Xi = xi )) Equal to 0 if Xi is not an ancestor of Xj 28 / 35
  27. Joint inference of steady-state + intervention expression Xj = expression

    of gene j Gaussian Bayesian network: Xj = mj + i∈pa(j) wij Xi + εj with εj ∼ N(0, σ2 j ) for j = 1, . . . , p wij = 0 if and only if i ∈ pa(j) Directed acyclic graph (DAG), and nodes have been ordered so that i ∈ pa(j) ⇒ i < j (i.e., W = (wij ) is upper triangular) Model parameters are θ = (W, m, σ) Total causal effects are β = (I − W)−1 = I + W + . . . + W p−1 29 / 35
  28. Joint inference of steady-state + intervention expression MCMC-Mallows GBN model5

    Log-likelihood of model for arbitrary combination of knock-outs (single, partially complete, multiple, ...) Explore the posterior distribution of node order and estimated causal effects via an empirical MCMC algorithm Node ordering proposal via Mallows model Estimation of model parameters for given ordering via likelihood calculations Some extensions: ridge penalty for high(er) dimensional networks, marginal causal estimation for single KO 5Joint work with F. Jaffr´ ezic, G. Nuel, G. Monneret 30 / 35
  29. MCMC-Mallows GBN model Simulations for several KO settings suggest that

    our approach makes better use of partially available information than competiting methods Multiple KOs contribute additional valuable information 31 / 35
  30. Current/future work: integrative multi-omic analysis Multi-omics: Gene expression + methylation

    + copy number alterations + chromatin accessibility + chromatin conformation + ... Source: Rajasundaram and Selbig (2016) 32 / 35
  31. Current/future work: integrative multi-omic analysis Exploring molecular drivers of gene

    expression in cancer genomes6 Comprehensive/coordinated effort to improve the molecular understanding of major cancers through high-throughput genomics What are the relative contributions of other molecular data (methylation, copy number alterations, somatic mutations, transcription factor expression, miRNA abundance, genotypes) to the variation of gene expression within a cancer? Are there shared patterns across cancers? How can interesting patterns of molecular drivers be easily explored? R/Shiny interactive web application 6Joint work with P. L. Auer. 33 / 35
  32. Current/future work: integrative multi-omic analysis Joint modeling of chromatin accessibility

    and gene expression8 Fr-AgENCODE: French pilot project part of FAANG consortium with aim to improve functional annotation for livestock7 4 species / 3 tissues (CD4, CD8, liver) Multiple high-throughput assays: RNA-seq, ATAC-seq, Hi-C Goal: study multi-tissue/multi-species associations between the transcriptional and chromatin landscapes 7Analyses coordinated by E. Giuffra, S. Foissac, S. Djebali-Quelen, S. Lagarrigue 8Joint work with R. Momal-Leisenring. 34 / 35
  33. Future work: integrative multi-omic analysis AgreenSkills+ mobility project Integrative analysis

    of multi-omics data for improved detection power of functional genetic variants (October 2017-May 2019) Comprehensive data from the NHLBI Trans-Omic Precision Medicine (TOPmed) program ⇒ identify rare coding and functional noncoding variants underlying complex multifactorial diseases 60k individuals (26 studies) profiled with WGS, other ’omics to follow Goal: integrate public transcriptomic/epigenomic data (GTEx, ENCODE, Roadmap) to better target functionally relevant variants 35 / 35
  34. Acknowledgements Ph.D. students: M´ elina Gallopin Manuel Revilla Sanchez Gilles

    Monneret Master’s students: Rapha¨ elle Momal-Leisenring Fr´ ed´ eric Jehl Babacar Ciss Audrey Hulot Meriem Benabbas R´ emi Bancal Statomique consortium Funding: MixStatSeq ANR-JCJC grant INRA/GA departmental grants (Causality, COSI-net) HDR evaluation committee: David Causeur Anne-Laure Boulesteix Nathalie Villa-Vialaneix St´ ephane Robin Franck Picard Christophe Ambroise Collaborators: Gilles Celeux Marie-Laure Martin-Magniette Cathy Maugis-Rabusseau Antoine Godichon-Baggioni Gr´ egory Nuel Guillemette Marot Christopher Sauvage Sandrine Lagarrigue Paul Livermore Auer
  35. Acknowledgements GABI research unit, and our director Claire Rogel-Gaillard Special

    thanks to the PSGen team, especially Florence Jaffr´ ezic, Denis Lalo¨ e, Tatiana Zerjal, and the Bioinfo-Biostats pole