Upgrade to Pro — share decks privately, control downloads, hide ads and more …

Leveraging multi-omic data for integrative exploratory, predictive, and network analyses

Andrea Rau
November 17, 2021

Leveraging multi-omic data for integrative exploratory, predictive, and network analyses

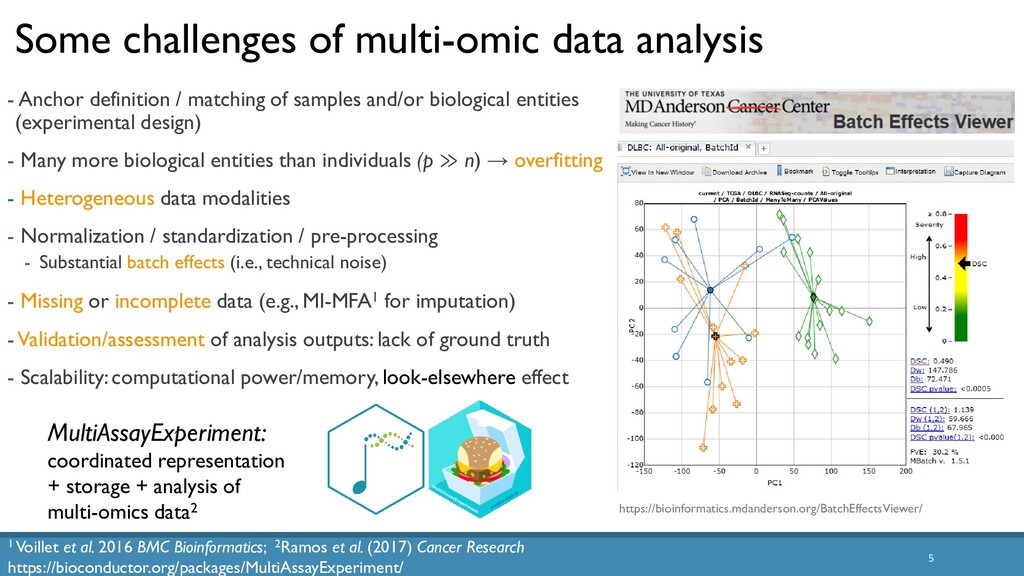
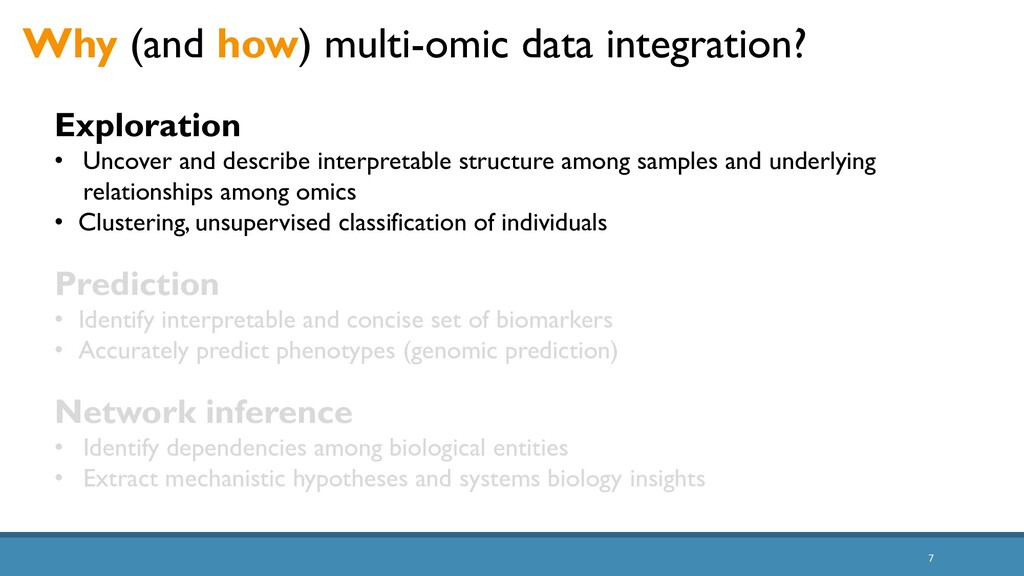
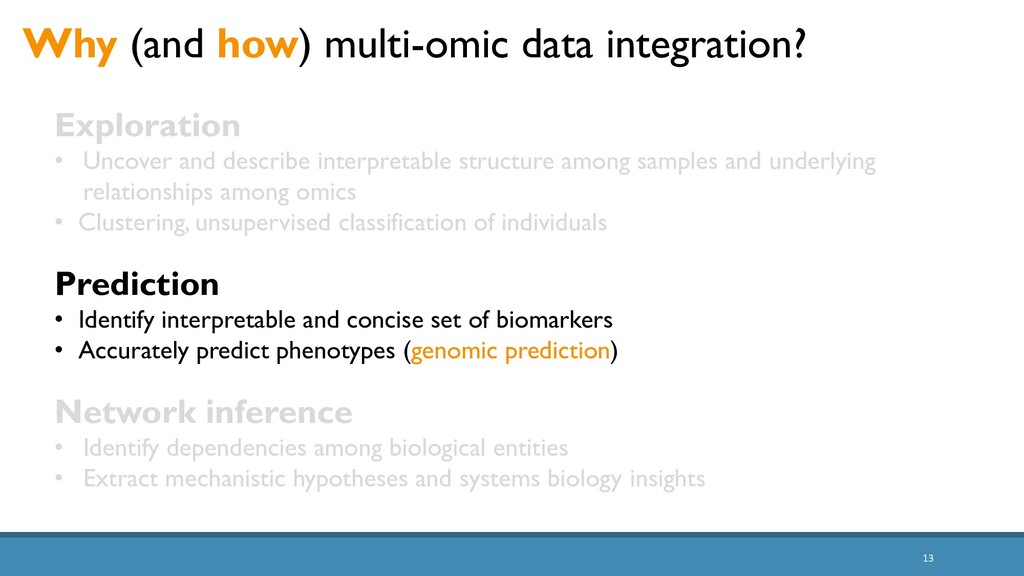
The increased availability and affordability of high-throughput sequencing technologies in recent years have facilitated the use of multi-omic studies, expanding and enriching our understanding of complex systems across hierarchical biological levels. Integrative methods for these heterogeneous and multi-faceted omics data have shown promise for enhancing the interpretability of exploratory analyses, improving predictive power, and contributing to a holistic understanding of systems biology. However, such integrative analyses are accompanied by several major obstacles, including the potentially ambiguous relationships among omic levels, high dimensionality coupled with small sample sizes, technical artefacts due to batch effects, potentially incomplete or missing data… and the occasional difficulty in posing well-defined and answerable research questions of such data. In light of these challenges, in this talk I will discuss a few of our recent methodological contributions to integrate multi-omic data for (1) exploratory analyses, (2) genomic prediction, and (3) network inference, all with a focus on enhanced interpretability and user-friendly software implementations.

Andrea Rau

November 17, 2021
Tweet

More Decks by Andrea Rau

Other Decks in Science

Transcript

  1. Leveraging multi-omic data for
    integrative exploratory, predictive, and
    network analyses
    ANDREA RAU
    NUTRINEURO SEMINAR
    @ZOOM
    NOVEMBER 22, 2021
    1
    https://andrea-rau.com @andreamrau slides: https://tinyurl.com/NutriNeurO2021-Rau

    View Slide

  2. 2
    Gene
    expression
    TTTGCA
    AAACGT
    TF
    Transcription
    factor
    expression
    Copy number alterations
    The multi-omics data landscape
    Promoter methylation
    microRNA
    expression
    …GCAGCGTTCGA…
    …GCAACGTTAGA…
    Somatic mutations
    Germline genetic variation
    Enhancer
    Accessibility
    Protein
    abundance
    Metabolite
    concentrations
    … + Histone modifications + RNA processing/stability + 3D conformation + Microbiome composition + … 2

    View Slide

  3. 3
    - Comprehensive, multi-dimensional maps of key genomic changes in 33 cancer types
    from n = 11k+ individuals
    ◦ RNA-seq, miRNA-seq, copy number alterations, methylation, somatic mutations, protein abundance,
    genotypes, histological data, clinical data → p ~ 100s to 1000s to 100k+
    - Publically available data (multi-tiered data depending on patient identifiability)
    - Widely used by the research community (1000+ publications by TCGA network +
    independent researchers)
    Large-scale (public) matched multi-omics
    The Cancer Genome Atlas (TCGA)
    Image: Corces et al. (2018)

    View Slide

  4. 4
    Smaller-scale matched multi-omics @ INRAE
    H2020 GENE-SWitCH
    The regulatory GENomE of Swine & Chicken: functional annotation during development PI’s: Elisabetta Giuffra and Hervé Acloque (INRAE)
    Aim: deliver new underpinning knowledge on functional genomes of the 2 main monogastric
    farm species to enable immediate translation to the pig and poultry sectors
    - High-quality richly annotated maps of pig and chicken genomes
    ◦ Developmental stages: early/late organogenesis, new born/hatched, adult
    ◦ Sexes: {♀,♂} x 3 biological replicates
    ◦ Tissues: liver, skeletal muscle, small intestine, cerebellum, dorsal epidermis, lung, kidney
    ◦ Assays: RNA-seq, ATAC-seq, ChIP-seq, RNA-seq, smRNA-seq, lrRNA-seq, methylation, Hi-C, whole genome sequences
    ◦ eQTLs in small intestine + skeletal muscle + liver in pigs
    Image: http://www.fragencode.org Image: http://www.gene-switch.eu/project.html
    Integrate functional information with
    phenotypic + genotypic data in
    genomic prediction models for
    greater power and interpretability

    View Slide

  5. 5
    - Anchor definition / matching of samples and/or biological entities
    (experimental design)
    - Many more biological entities than individuals (p ≫ n) → overfitting
    - Heterogeneous data modalities
    - Normalization / standardization / pre-processing
    - Substantial batch effects (i.e., technical noise)
    - Missing or incomplete data (e.g., MI-MFA1 for imputation)
    - Validation/assessment of analysis outputs: lack of ground truth
    - Scalability: computational power/memory, look-elsewhere effect
    Some challenges of multi-omic data analysis
    https://bioinformatics.mdanderson.org/BatchEffectsViewer/
    1 Voillet et al. 2016 BMC Bioinformatics; 2Ramos et al. (2017) Cancer Research
    https://bioconductor.org/packages/MultiAssayExperiment/
    MultiAssayExperiment:
    coordinated representation
    + storage + analysis of
    multi-omics data2

    View Slide

  6. 6
    Requires anchor to link modalities, account for (known/unknown)
    interdependencies within and between modalities
    What is multi-omic data integration?
    Multi-{domain, way, view, modal, table, variate, omics} data
    Samples →
    ← Features
    Horizontal
    Diagonal
    Samples →
    ← Assays
    ← Features
    Mosaic
    Samples →
    ← Assays
    ← Features
    Images adapted from Argelaguet et al. (2021) Nature Biotechnology; Rajasundaram & Selbig (2016) Current Opinion in Plant Biology
    Samples →
    ← Assays
    Vertical
    ← Features

    View Slide

  7. 7
    Why (and how) multi-omic data integration?
    Exploration
    • Uncover and describe interpretable structure among samples and underlying
    relationships among omics
    • Clustering, unsupervised classification of individuals
    Prediction
    • Identify interpretable and concise set of biomarkers
    • Accurately predict phenotypes (genomic prediction)
    Network inference
    • Identify dependencies among biological entities
    • Extract mechanistic hypotheses and systems biology insights

    View Slide

  8. 8
    Which individuals in a large-scale cohort have highly
    aberrant multi-omic profiles for a given pathway of interest?
    Does patient prognosis correlate with large pathway deviation scores?
    Which genes / omics modalities drive these strongly aberrant scores?
    Multi-omic integration: Exploration
    Breast invasive carcinoma (BRCA; n = 504) and lung adenocarcinoma (LUAD; n = 144)
    • (Batch-corrected) RNA-seq + promoter methylation + copy number alterations + miRNA-seq
    • miRNA → gene mapping via miRTarBase (exact matches, Functional MTI predictions)
    • 1136 MSigDB curated canonical pathways

    View Slide

  9. A
    B
    C
    Individuals
    1 / λA
    1 / λB
    1 / λC
    Individuals
    1 / λA
    1 / λB
    1 / λC
    PC 1
    PC 2
    !
    9
    Define an individualized pathway-level deviation score
    based on multi-omic data using MFA
    http://bioconductor.org/packages/padma Rau et al. (2020) Biostatistics, https://doi.org/10.1101/827022
    padma: Pathway deviation scores using Multiple Factor Analysis
    i
    9

    View Slide

  10. Which individuals have the most highly aberrant multi-omic profiles?
    10
    D4-GDP dissociation inhibitor signaling pathway, LUAD (Cox PH*, BH padj = 0.0111)
    Rau et al. (2020) Biostatistics

    View Slide

  11. Which genes/omics drive large pathway deviation scores?
    11
    → CASP1, CASP3, CASP8 have large gene-level
    deviation scores for the two most extreme individuals…
    Rau et al. (2020) Biostatistics

    View Slide

  12. 12
    • Larger padma deviation scores = increasingly aberrant pathway variation with significantly worse prognosis
    (survival, histological grade) in breast and lung cancer
    • Potential outlier detection tool in precision medicine & agriculture applications
    Innovative use of existing MFA method to
    quantify and graphically explore
    individualized multi-omic pathway deviation scores
    Next steps…
    • Incorporation of known hierarchical structure among genes in pathway
    • Extensions for highly structured data (e.g., multi-omic data from divergent chicken lines subject to feed/heat stress
    or maize diversity panels under control/cold conditions)
    padma results on TCGA multi-omic data
    (RNA-seq + miRNA-seq + methylation + CNA data, MSigDB canonical pathways)

    View Slide

  13. 13
    Why (and how) multi-omic data integration?
    Exploration
    • Uncover and describe interpretable structure among samples and underlying
    relationships among omics
    • Clustering, unsupervised classification of individuals
    Prediction
    • Identify interpretable and concise set of biomarkers
    • Accurately predict phenotypes (genomic prediction)
    Network inference
    • Identify dependencies among biological entities
    • Extract mechanistic hypotheses and systems biology insights

    View Slide

  14. 14
    Multi-omic integration: Genomic Prediction
    Genomic prediction of phenotypes and breeding values now widely used in most
    major plant and animal breeding programs
    Phenotypes ~ Genotypes
    → Increase rates of genetic gain through:
    • Better accuracy of estimated breeding values
    • Reduction of generation intervals
    • Genome-guided mate selection
    Increased availability of additional omics data has potential to improve prediction
    and enhance QTL discovery via inclusion as prior biological information
    Goal: accurate + interpretable phenotype prediction

    View Slide

  15. 15
    Bayesian models for genomic prediction
    PhD work of Fanny Mollandin (H2020 GENE-SWitCH)

    View Slide

  16. 16
    Improved Bayesian models for genomic prediction
    PhD work of Fanny Mollandin (H2020 GENE-SWitCH)
    https://github.com/fmollandin/BayesRCO
    Cumulative
    Preferential
    assignment

    View Slide

  17. 17
    BayesRCO for genomic prediction: simulations
    PhD work of Fanny Mollandin (H2020 GENE-SWitCH)
    • Phenotypes simulated from real cattle 50k genotypes (n ~ 2500) with various heritabilities,
    number/sizes of QTLs
    • Types of annotation categories ⇒ strongly/moderately/weakly enriched or unenriched
    • A = 1 strong + 1 moderate + remaining SNPs
    • B = 1 strong + 1 moderate + 1 weak + 1 unenriched + remaining SNPs
    • C = 2 strong + 2 moderate + 3 weak + 2 unenriched + remaining SNPs
    3
    scenarios
    Improvement in
    validation prediction
    and QTL ranking
    (posterior variance)
    compared to
    BayesR
    BayesRC
    BayesRCπ
    BayesRC+

    View Slide

  18. 18
    BayesRCO for genomic prediction: PIG-HEAT data
    PhD work of Fanny Mollandin (H2020 GENE-SWitCH), collaboration with Hélène Gilbert (GenPhySE)
    • 60k genotypes for n ~1200 backcross pigs in 2 different climatic environments
    • 11 (partially overlapping) annotation categories extracted from PigQTLdb1 trait hierarchies
    • Phenotypes pre-corrected for age, farm, sex → focus here on Feed Conversion Ratio (FCR2)
    1 https://www.animalgenome.org/cgi-bin/QTLdb/SS/index 2 Feed input / output (weight gain)
    FCR No
    annotations
    PigQTLdb
    annotations
    BayesR 0.374
    BayesRCπ 0.417
    BayesRC+ 0.420
    Validation correlation
    Medium-effect QTLs
    Large-effect QTLs
    BayesRCπ
    Next steps…
    • Annotation categories generated using GENE-SWitCH multi-omics data

    View Slide

  19. 19
    Why (and how) multi-omic data integration?
    Exploration
    • Uncover and describe interpretable structure among samples and underlying
    relationships among omics
    • Clustering, unsupervised classification of individuals
    Prediction
    • Identify interpretable and concise set of biomarkers
    • Accurately predict phenotypes (genomic prediction)
    Network inference
    • Identify dependencies among biological entities
    • Extract mechanistic hypotheses and systems biology insights

    View Slide

  20. 20
    Image adapted from Lee et al. (2020) Frontiers in Genetics
    Homogeneous
    network
    (homogeneous
    nodes, single view)
    Multiplex
    network
    (homogeneous nodes,
    multiple views)
    Multi-layered
    network
    (heterogeneous
    nodes, multiple
    views)
    Graphs typically used to describe interactions: nodes = individual molecules, edges = interactions (dependencies)
    Multi-omic integration: Networks

    View Slide

  21. 21
    Copula models for mixed-type data networks
    • (Sparse) graphical models often preferred to pairwise associations for network inference
    • Remove indirect associations by identifying conditional dependencies
    • For continuous data, graphical Gaussian models are a popular choice
    • But multi-omic data represent mixed-type data (continuous, counts, binary, …)
    that may have nonconstant correlations across their distribution
    • One strategy: couple univariate marginal distributions of variable pairs with copulae
    ⇒ Map (≠ transform!) mixed-type data into other variables where correlation can be easily defined
    Full joint
    probability
    distribution
    Marginal distribution
    of each variable
    Function coupling
    marginals together
    (= « copula »)
    Image from https://analystprep.com/study-notes/frm/part-1/quantitative-analysis/correlations-and-copulas

    View Slide

  22. DINAMIC:
    Differential network analysis of mixed-type data with copulae
    22
    INRAE DIGIT-BIO Metaprogramme (2021-2023)

    View Slide

  23. Some final remarks on multi-omics integration
    …and answering questions that we have not yet thought to ask1
    Multi-omic data integration often requires a combination of software tools +
    computational expertise + domain expertise…
     Utility of tools for rapid querying + (interactive) exploration of fully processed data
    without advanced coding knowledge
     Reproducibility
    Communication + vocabulary is key!
    Moving forward, dealing with partially matched data:
    ◦ Multi-task learning (mosaic integration)
    ◦ Transfer learning (exploit large-scale reference atlases)
    Emergence of single-cell / spatial / time-course multi-omics data
    1 Stein-O’Brien et al. (2018) Trends in Genetics
    Matrix factorization?
    Decomposition?
    Latent factor model? ...
    23

    View Slide

  24. Acknowledgements
    Part of this work has received funding from the EU’s Horizon 2020 Research and Innovation Programme under grand agreement n°817998.

    View Slide