Upgrade to Pro — share decks privately, control downloads, hide ads and more …

Multi-omic integration for enhanced interpretability in exploratory analyses

Andrea Rau
April 23, 2021

Multi-omic integration for enhanced interpretability in exploratory analyses

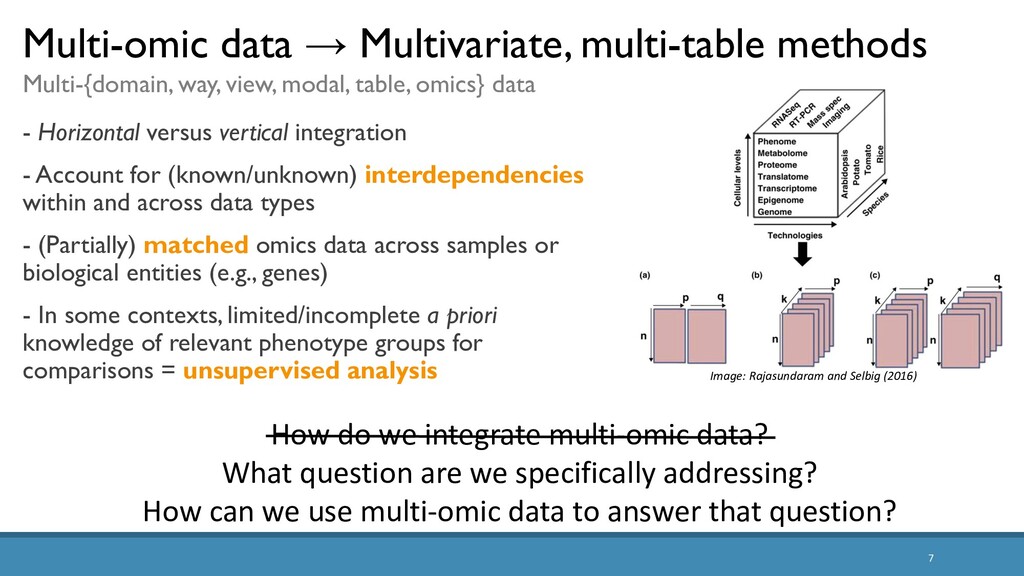
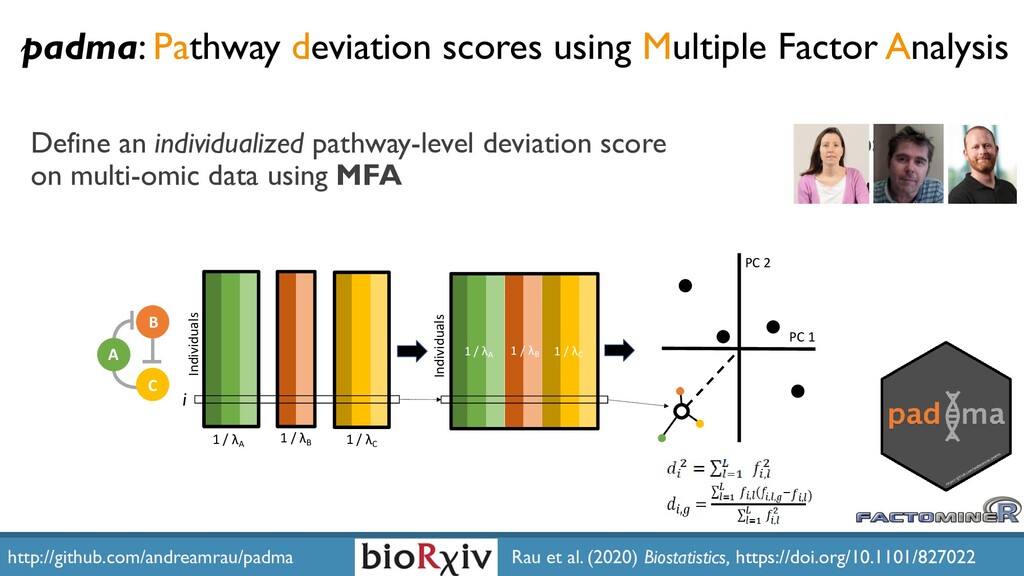
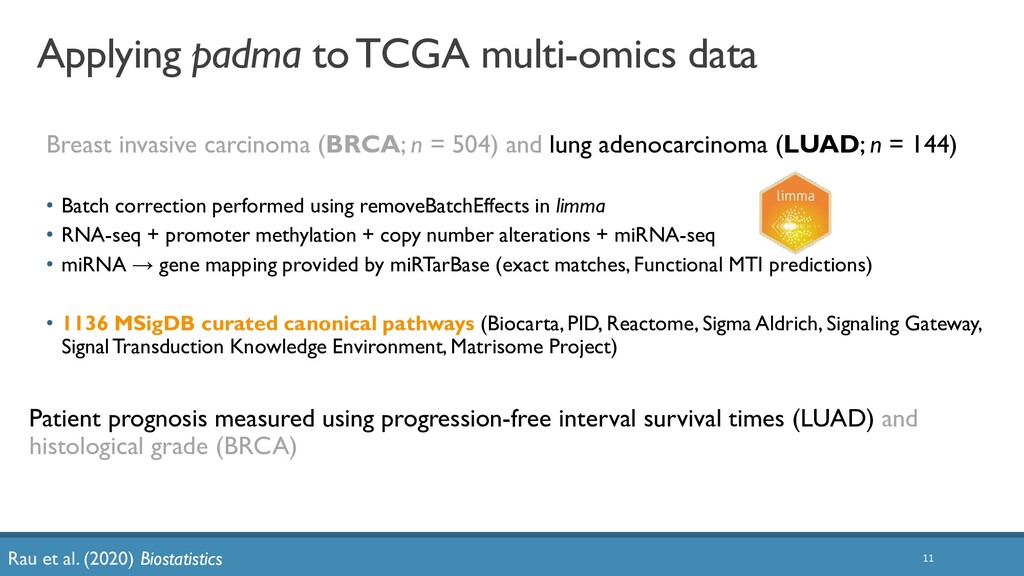
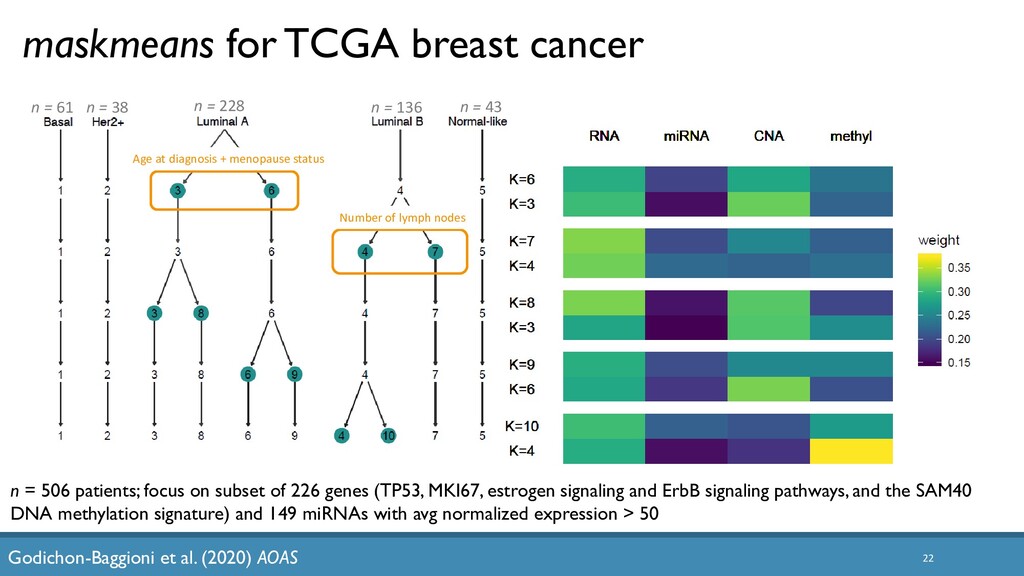
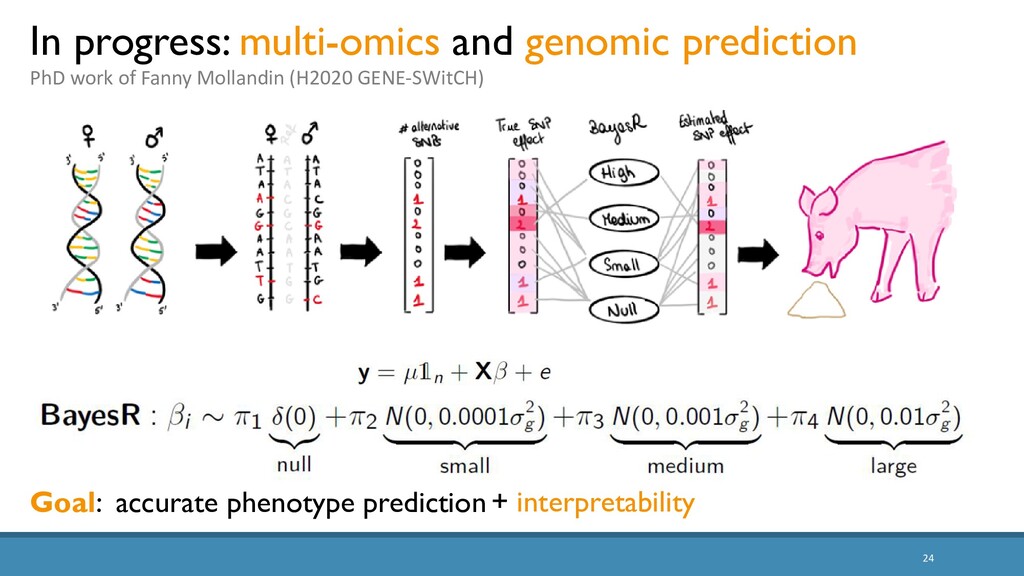
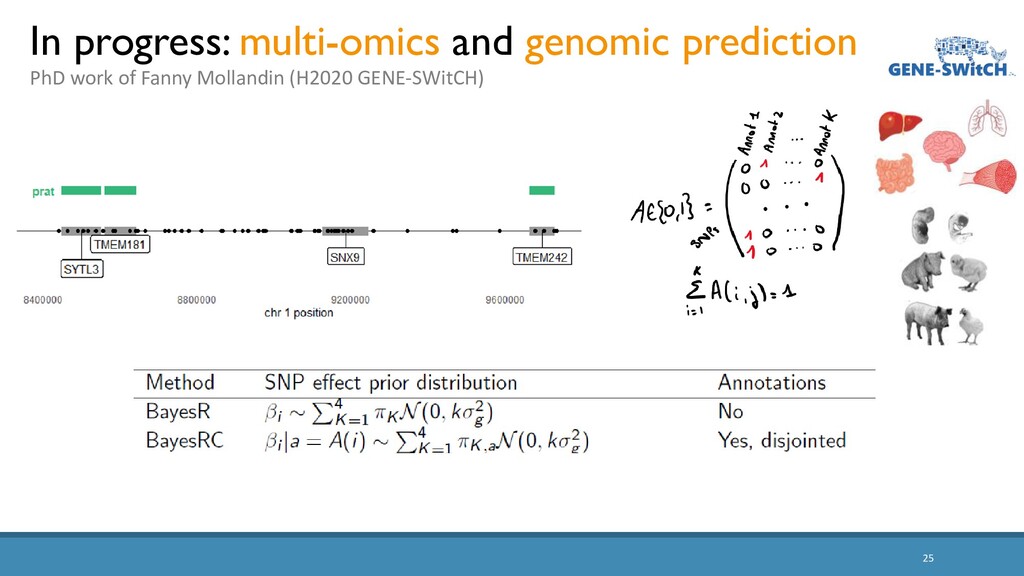
The increased availability and affordability of high-throughput sequencing technologies in recent years has facilitated the use of multi-omic studies to expand and enrich our understanding of complex systems across hierarchical biological levels. Integrative methods for these heterogeneous and multi-faceted ‘omics data have shown promise for enhancing the interpretability of exploratory analyses, improving predictive power, and contributing to a holistic understanding of systems biology. However, such integrative analyses are accompanied by several major obstacles, including the unknown hierarchy and potentially ambiguous relationships among different sources of data, high dimensionality coupled with small sample sizes, issues due to batch effects and quality control, potentially incomplete or missing data… and the occasional difficulty in posing well-defined and answerable research questions of such data. In light of these challenges, in this talk I will discuss two recent methodological contributions to exploratory integrative multi-omic analyses: (1) padma, a multiple factor analysis approach for quantifying and visualizing individualized multi-omic pathway deviation patterns; and (2) maskmeans, an approach for aggregating/splitting an existing clustering partition using multi-view data. Finally, I will discuss some practical considerations for multi-omics integration in practice, as well as some current and future areas of methodological research in this area.

Andrea Rau

April 23, 2021
Tweet

More Decks by Andrea Rau

Other Decks in Science

Transcript

  1. Multi-omic integration for enhanced interpretability in exploratory analyses ANDREA RAU

    LABORATOIRE JEAN KUNTZMANN SEMINAR @ZOOM APRIL 29, 2021 1 https://andrea-rau.com @andreamrau slides: https://tinyurl.com/Grenoble2021-Rau
  2. 2 Gene expression TTTGCA AAACGT TF Transcription factor expression Copy

    number alterations The multi-omics data landscape Promoter methylation microRNA expression …GCAGCGTTCGA… …GCAACGTTAGA… Somatic mutations Germline genetic variation Enhancer Accessibility Protein abundance Metabolite concentrations … + Histone modifications + RNA processing/stability + 3D conformation + Microbiome composition + …
  3. 3 - Comprehensive, multi-dimensional maps of key genomic changes in

    33 cancer types from n = 11k+ individuals ◦ RNA-seq, miRNA-seq, copy number alterations, methylation, somatic mutations, protein abundance, genotypes, histological data, clinical data → p ~ 100s to 1000s to 100k+ - Publically available data (multi-tiered data depending on patient identifiability) - Widely used by the research community (1000+ publications by TCGA network + independent researchers) Large-scale (public) matched multi-omics The Cancer Genome Atlas (TCGA) Image: Corces et al. (2018)
  4. 4 No regenerative response = disability Robust regenerative response =

    functional recovery Gene expression + Chromatin accessibility (RNA-seq + ATAC-seq) Dhara et al. (2019) Scientific Reports; Rau et al. (2019) G3 4 Smaller-scale matched multi-omics Central nervous system injury in zebrafish Regulatory network involved in CNS rewiring during optic nerve regeneration in zebrafish n = 15 (5 times × 3 reps) p ~ 20k
  5. 6 - Many more biological entities than individuals (p >>

    n) - Experimental design - Normalization / standardization / pre-processing, potentially heterogenous quality across datasets, substantial batch effects - Missing or incomplete data (e.g., MI-MFA1) - Look-everywhere effect Some challenges of multi-omic data analysis https://bioinformatics.mdanderson.org/BatchEffectsViewer/ 1 Voillet et al. 2016; 2Ramos et al. (2017), https://bioconductor.org/packages/MultiAssayExperiment/ MultiAssayExperiment: coordinated representation + storage + analysis of multi-omics data2
  6. 7 - Horizontal versus vertical integration - Account for (known/unknown)

    interdependencies within and across data types - (Partially) matched omics data across samples or biological entities (e.g., genes) - In some contexts, limited/incomplete a priori knowledge of relevant phenotype groups for comparisons = unsupervised analysis Multi-omic data → Multivariate, multi-table methods Multi-{domain, way, view, modal, table, omics} data How do we integrate multi-omic data? What question are we specifically addressing? How can we use multi-omic data to answer that question? Image: Rajasundaram and Selbig (2016)
  7. 8 Broad umbrella of integrative data analysis Many different answers,

    depending on the question… Exploration / description • Find underlying relationships between datasets • Clustering, unsupervised classification Prediction • Identify small set of features (i.e., biomarkers) that yields best possible prediction • Remove noisy or redundant feature, curse of dimensionality • Use set of features to understand the underlying biology Causality • Extract mechanistic hypotheses and insights http://factominer.free.fr, http://mixomics.org/
  8. 9 For a given pathway of interest, can we identify

    and quantify highly aberrant individuals in a sample based on multi-omic data? Does patient prognosis correlate with large pathway deviation scores? Which individuals have the most aberrant profiles for pathways of interest? Which genes / omic drive these aberrant scores? Integrative multi-omics methods: Multivariate analysis
  9. A B C Individuals 1 / λA 1 / λB

    1 / λC Individuals 1 / λA 1 / λB 1 / λC PC 1 PC 2 ! 10 Define an individualized pathway-level deviation score based on multi-omic data using MFA http://github.com/andreamrau/padma Rau et al. (2020) Biostatistics, https://doi.org/10.1101/827022 padma: Pathway deviation scores using Multiple Factor Analysis i
  10. 11 Applying padma to TCGA multi-omics data Breast invasive carcinoma

    (BRCA; n = 504) and lung adenocarcinoma (LUAD; n = 144) • Batch correction performed using removeBatchEffects in limma • RNA-seq + promoter methylation + copy number alterations + miRNA-seq • miRNA → gene mapping provided by miRTarBase (exact matches, Functional MTI predictions) • 1136 MSigDB curated canonical pathways (Biocarta, PID, Reactome, Sigma Aldrich, Signaling Gateway, Signal Transduction Knowledge Environment, Matrisome Project) Patient prognosis measured using progression-free interval survival times (LUAD) and histological grade (BRCA) Rau et al. (2020) Biostatistics
  11. Which individuals have the most highly aberrant multi-omic profiles? 12

    D4-GDP dissociation inhibitor signaling pathway, LUAD (Cox PH*, BH padj = 0.0111) Rau et al. (2020) Biostatistics
  12. Which genes/omics drive large pathway deviation scores? 13 → CASP1,

    CASP3, and CASP8 all have high gene-level deviation scores for the two most extreme individuals… Rau et al. (2020) Biostatistics
  13. 15 • Larger padma deviation scores = increasingly aberrant pathway

    variation with significantly worse prognosis (survival, histological grade) in breast and lung cancer • Potential outlier detection tool Innovative use of existing MFA method to calculate and graphically explore individualized multi-omic pathway deviation scores Next steps… • Incorporation of known hierarchical structure among genes in pathway • Extensions for highly structured data (e.g., multi-omic data from divergent chicken lines subject to feed/heat stress or maize diversity panels under control/cold conditions) padma results on TCGA breast and lung cancer (RNA-seq + miRNA-seq + methylation + CNA data, MSigDB canonical pathways) Rau et al. (2020) Biostatistics
  14. 16 Integrative multi-omics methods: Clustering Clustering individuals based on single

    omics (especially gene expression) data widely used to identify molecular subtypes of cancer • PAM50, AIMS intrinsic subtypes • Many methods have been developed Recently, many integrative clustering methods have proposed to make use of multi-omic data • Rich literature in machine learning on multi-view methods • Multi-omic specific methods: MVDA, iCluster+, MOFA, … • Primarily de novo clustering from multi-omics data How can an existing clustering be merged or split based on multi-omics data? e.g., subdivide intrinsic subtypes into distinct sub-groups of individuals
  15. 17 maskmeans: Multi-view aggregation/splitting K-means 𝑍 = (𝑍 1 ,

    … , 𝑍 𝑣 , …, 𝑍 𝑉 ) where each 𝑍 𝑣 is scaled to unit-variance and additionally divided by the size of its view: 𝑋 𝑣 = 𝑍 𝑣 /𝑑𝑣 Aggregation/splitting of initial clustering of the n individuals based on the minimization of a criterion similar to the multi-view fuzzy K-means algorithm* with tuning parameters 𝛾, 𝛿 > 1: * Wang and Chen (2017); Godichon-Baggioni et al. (2020) AOAS; http://github.com/andreamrau/maskmeans ෍ 𝑖=1 𝑛 ෍ 𝑘=1 𝐾 ෍ 𝑣=1 𝑉 (𝛼𝑘,𝑣 )𝛾(𝜋𝑖,𝑘 )𝛿 𝑋 𝑖 (𝑣) − 𝜇 𝑘 (𝑣) 2 Clustering partition Per-view cluster centers Per-cluster, per-view weights
  16. 19 Multi-view splitting/aggregating K-means algorithm: Simulations Godichon-Baggioni et al. (2020)

    AOAS • K = 7 clusters • n = 100 • V = 6 views Split: Kinit = 4 from View 2 data Aggregate: Kinit = 20 fromView 1 data True labels from View 1 → 100 simulated datasets
  17. n = 61 n = 38 n = 228 n

    = 136 n = 43 22 maskmeans for TCGA breast cancer n = 506 patients; focus on subset of 226 genes (TP53, MKI67, estrogen signaling and ErbB signaling pathways, and the SAM40 DNA methylation signature) and 149 miRNAs with avg normalized expression > 50 Godichon-Baggioni et al. (2020) AOAS Age at diagnosis + menopause status Number of lymph nodes
  18. Some final remarks on multi-omics …and answering questions that we

    have not yet thought to ask1 Multi-omic data integration often requires a combination of software tools + technical expertise + domain expertise… Utility of tools for rapid querying + (interactive) exploration of fully processed data without advanced coding knowledge Reproducibility Communication + vocabulary is key! Emergence of single-cell and time-course multi-omics data Dealing with partially matched data, transfer learning strategies, … 1 Stein-O’Brien et al. (2018) Trends in Genetics Matrix factorization? Decomposition? Latent factor model? ...
  19. 24 In progress: multi-omics and genomic prediction PhD work of

    Fanny Mollandin (H2020 GENE-SWitCH) Goal: accurate phenotype prediction + interpretability