Upgrade to Pro — share decks privately, control downloads, hide ads and more …

Mixture models as a useful tool for identifying co-expressed genes from RNA-seq data with coseq

Andrea Rau
April 08, 2021

Mixture models as a useful tool for identifying co-expressed genes from RNA-seq data with coseq

Presentation at MiMo workshop on mixture models (April 8, 2021)
https://mimo2021.sciencesconf.org

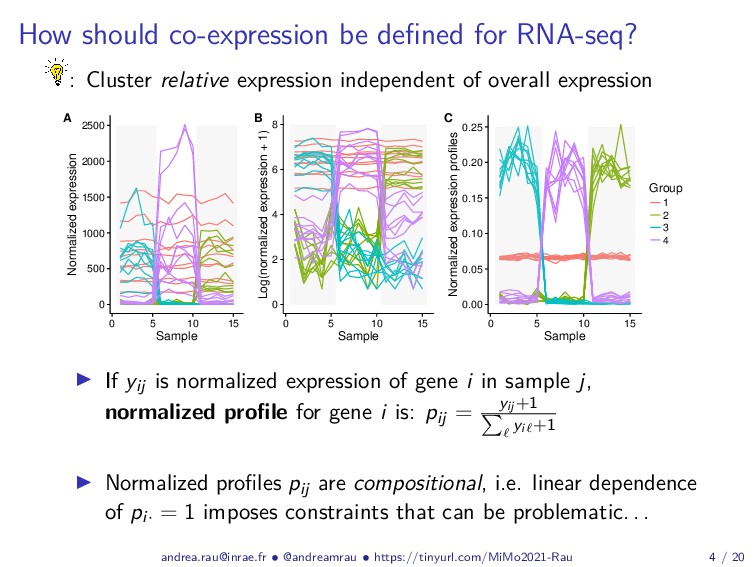
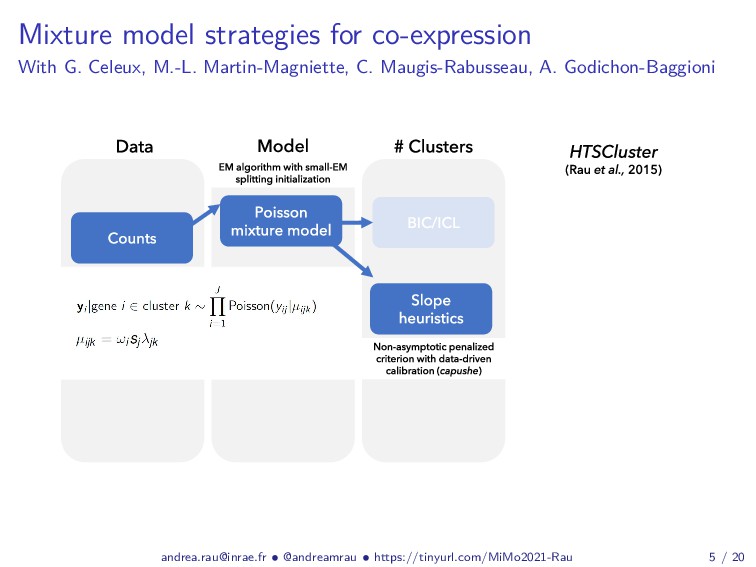
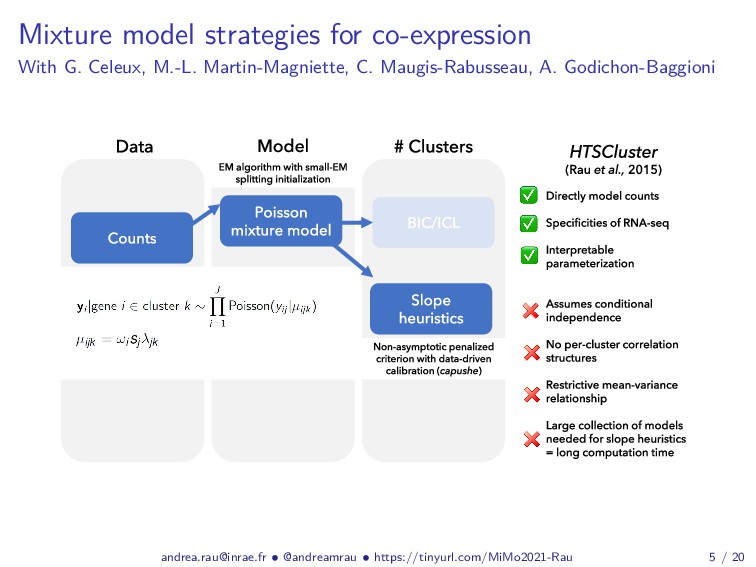
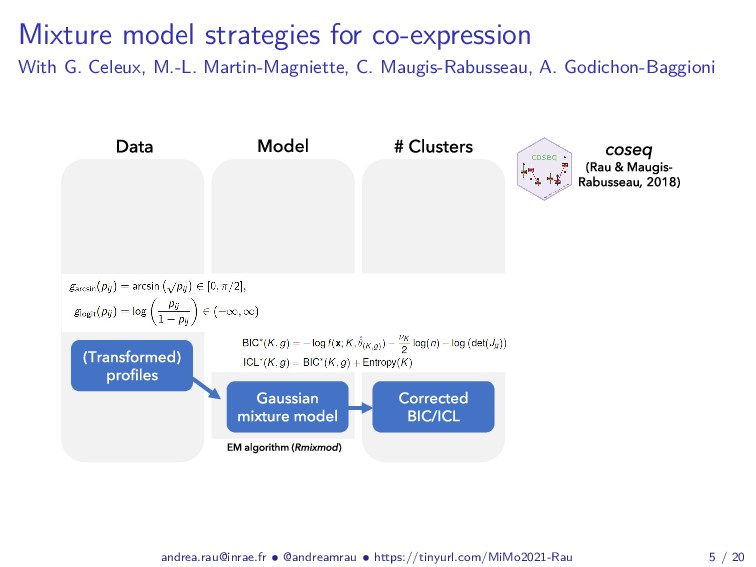
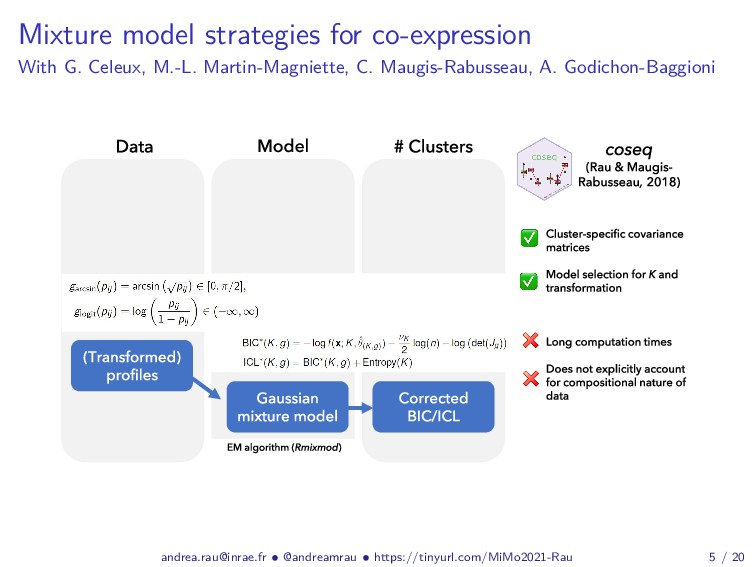
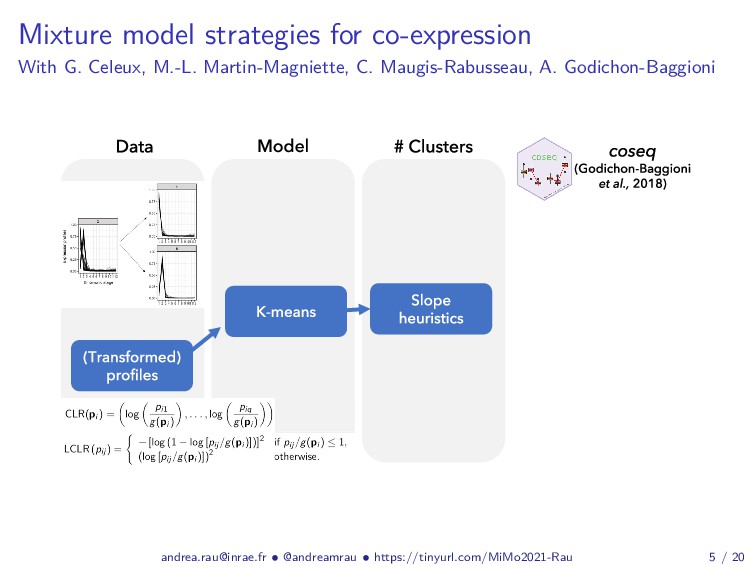
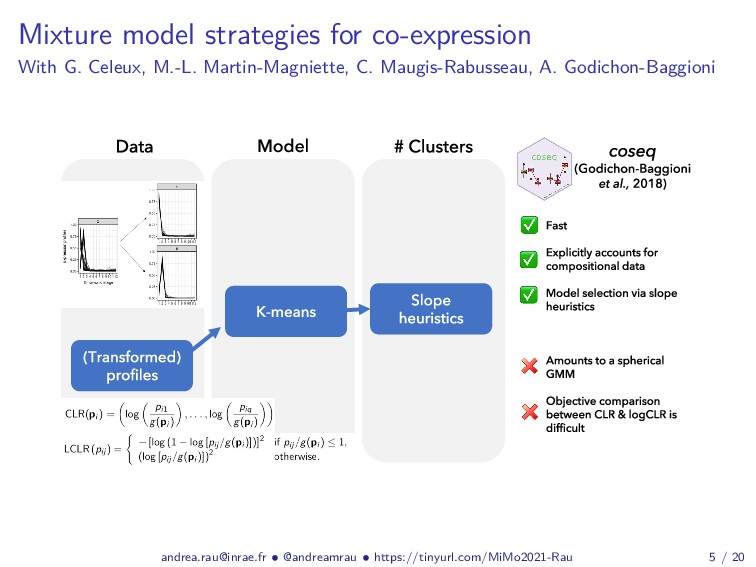
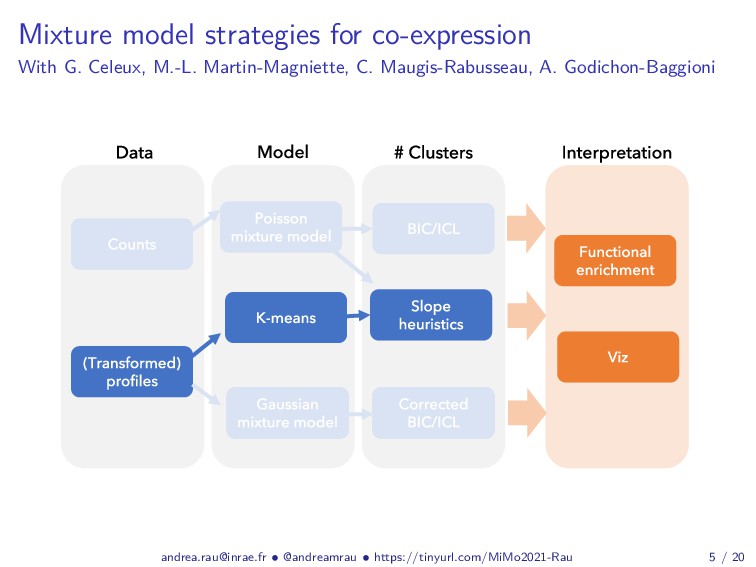
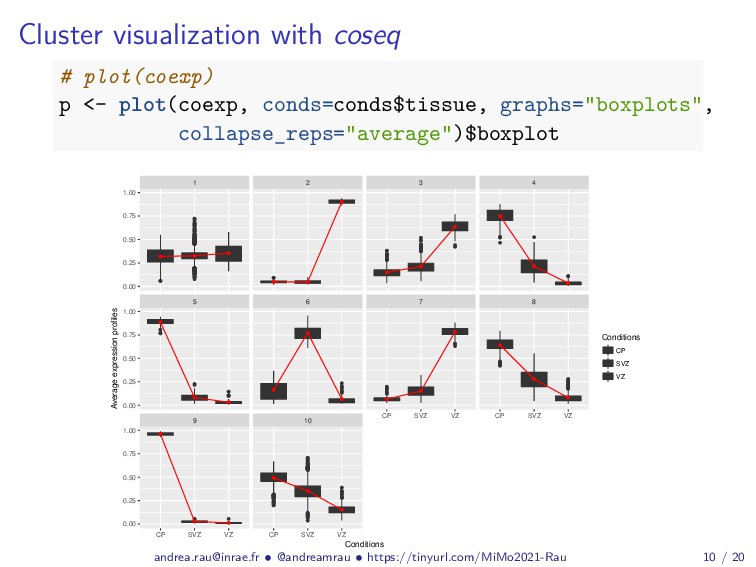
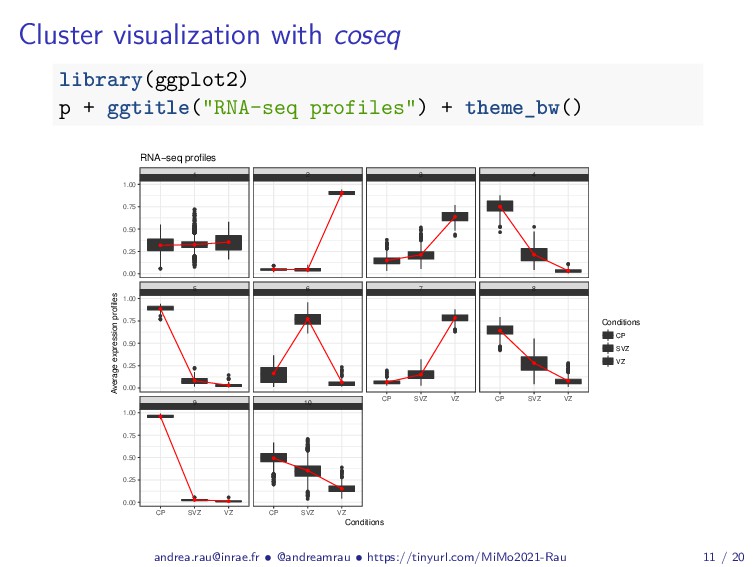
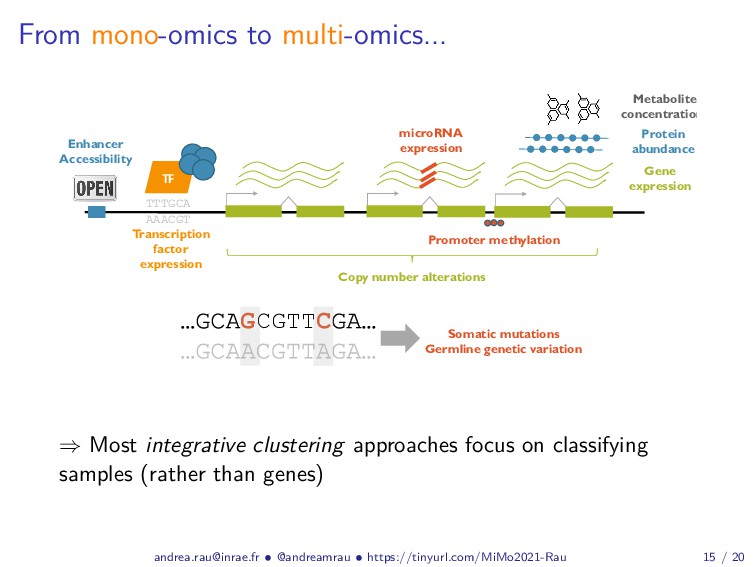
Abstract: Complex studies of transcriptome dynamics are now routinely carried out using RNA sequencing (RNA-seq). A common goal in such studies is to identify groups of co-expressed genes that share similar expression profiles across several treatment conditions, time points, or tissues. These co-expression analyses serve both as an exploratory visualization tool as well as a hypothesis-generating tool for poorly annotated genes. In this talk, I will discuss some of the mixture-model based approaches we have developed in recent years for RNA-seq co-expression analysis, with a particular focus on the practical issues surrounding the use of such approaches and their implementation within the R/Bioconductor package ecosystem. Finally, as studies with matched multi-view data (i.e., at different biological levels of molecular information) are becoming increasingly common, I will also briefly discuss our recent work to integratively use multiple data views to aggregate or split existing clusters from multi-omics data.

Andrea Rau

April 08, 2021
Tweet

More Decks by Andrea Rau

Other Decks in Science

Transcript

  1. Mixture models as a useful tool for
    identifying co-expressed genes from
    RNA-seq data with coseq
    Andrea Rau
    @andreamrau
    April 8, 2021 @ MiMo workshop on mixture models (virtual)
    https://tinyurl.com/MiMo2021-Rau

    View Slide

  2. RNA-seq gene expression data
    (Pseudo)counts affected by amount of transcription + gene
    length + technical biases (library size, GC content)
    1. Experimental design
    2. Experiment: library preparation, manufacturer protocols, ...
    3. Bioinformatics: QC, trimming, alignment, quantification
    4. Analysis
    [email protected] • @andreamrau • https://tinyurl.com/MiMo2021-Rau 2 / 20

    View Slide

  3. "Standard" RNA-seq multi-factor analysis pipeline
    1. Exploratory analysis
    2. Differential analysis
    Wald test with contrasts
    Likelihood ratio test to compare a full model to a reduced one
    3. Clustering / co-expression analysis
    4. Functional enrichment analysis to annotate/interpret results
    coseq
    DAVID, topGO,
    enrichplot, ShinyGO, …
    1 2 3 4
    DESeq2, edgeR, …
    [email protected] • @andreamrau • https://tinyurl.com/MiMo2021-Rau 3 / 20

    View Slide

  4. "Standard" RNA-seq multi-factor analysis pipeline
    1. Exploratory analysis
    2. Differential analysis
    Wald test with contrasts
    Likelihood ratio test to compare a full model to a reduced one
    3. Clustering / co-expression analysis
    4. Functional enrichment analysis to annotate/interpret results
    coseq
    DAVID, topGO,
    enrichplot, ShinyGO, …
    1 2 3 4
    DESeq2, edgeR, …
    [email protected] • @andreamrau • https://tinyurl.com/MiMo2021-Rau 3 / 20

    View Slide

  5. How should co-expression be defined for RNA-seq?
    : Cluster relative expression independent of overall expression
    0
    500
    1000
    1500
    2000
    2500
    0 5 10 15
    Sample
    Normalized expression
    A
    0
    2
    4
    6
    8
    0 5 10 15
    Sample
    Log(normalized expression + 1)
    B
    0.00
    0.05
    0.10
    0.15
    0.20
    0.25
    0 5 10 15
    Sample
    Normalized expression profiles
    Group
    1
    2
    3
    4
    C
    If yij is normalized expression of gene i in sample j,
    normalized profile for gene i is: pij = yij +1
    yi +1
    [email protected] • @andreamrau • https://tinyurl.com/MiMo2021-Rau 4 / 20

    View Slide

  6. How should co-expression be defined for RNA-seq?
    : Cluster relative expression independent of overall expression
    0
    500
    1000
    1500
    2000
    2500
    0 5 10 15
    Sample
    Normalized expression
    A
    0
    2
    4
    6
    8
    0 5 10 15
    Sample
    Log(normalized expression + 1)
    B
    0.00
    0.05
    0.10
    0.15
    0.20
    0.25
    0 5 10 15
    Sample
    Normalized expression profiles
    Group
    1
    2
    3
    4
    C
    If yij is normalized expression of gene i in sample j,
    normalized profile for gene i is: pij = yij +1
    yi +1
    Normalized profiles pij are compositional, i.e. linear dependence
    of pi· = 1 imposes constraints that can be problematic. . .
    [email protected] • @andreamrau • https://tinyurl.com/MiMo2021-Rau 4 / 20

    View Slide

  7. Mixture model strategies for co-expression
    With G. Celeux, M.-L. Martin-Magniette, C. Maugis-Rabusseau, A. Godichon-Baggioni
    [email protected] • @andreamrau • https://tinyurl.com/MiMo2021-Rau 5 / 20

    View Slide

  8. Mixture model strategies for co-expression
    With G. Celeux, M.-L. Martin-Magniette, C. Maugis-Rabusseau, A. Godichon-Baggioni
    [email protected] • @andreamrau • https://tinyurl.com/MiMo2021-Rau 5 / 20

    View Slide

  9. Mixture model strategies for co-expression
    With G. Celeux, M.-L. Martin-Magniette, C. Maugis-Rabusseau, A. Godichon-Baggioni
    [email protected] • @andreamrau • https://tinyurl.com/MiMo2021-Rau 5 / 20

    View Slide

  10. Mixture model strategies for co-expression
    With G. Celeux, M.-L. Martin-Magniette, C. Maugis-Rabusseau, A. Godichon-Baggioni
    [email protected] • @andreamrau • https://tinyurl.com/MiMo2021-Rau 5 / 20

    View Slide

  11. Mixture model strategies for co-expression
    With G. Celeux, M.-L. Martin-Magniette, C. Maugis-Rabusseau, A. Godichon-Baggioni
    [email protected] • @andreamrau • https://tinyurl.com/MiMo2021-Rau 5 / 20

    View Slide

  12. Mixture model strategies for co-expression
    With G. Celeux, M.-L. Martin-Magniette, C. Maugis-Rabusseau, A. Godichon-Baggioni
    [email protected] • @andreamrau • https://tinyurl.com/MiMo2021-Rau 5 / 20

    View Slide

  13. Mixture model strategies for co-expression
    With G. Celeux, M.-L. Martin-Magniette, C. Maugis-Rabusseau, A. Godichon-Baggioni
    [email protected] • @andreamrau • https://tinyurl.com/MiMo2021-Rau 5 / 20

    View Slide

  14. Mixture model strategies for co-expression
    With G. Celeux, M.-L. Martin-Magniette, C. Maugis-Rabusseau, A. Godichon-Baggioni
    [email protected] • @andreamrau • https://tinyurl.com/MiMo2021-Rau 5 / 20

    View Slide

  15. coseq R/Bioconductor package for RNA-seq co-expression
    BiocManager::install("coseq")
    library(coseq)
    ## S4 method for signature matrix , data.frame ,
    ## and DESeqDataSet
    coseq(object, K, , ...)
    [email protected] • @andreamrau • https://tinyurl.com/MiMo2021-Rau 6 / 20

    View Slide

  16. coseq R/Bioconductor package for RNA-seq co-expression
    BiocManager::install("coseq")
    library(coseq)
    ## S4 method for signature matrix , data.frame ,
    ## and DESeqDataSet
    coseq(object, K, , ...)
    Several options:
    Clustering model (kmeans or Normal) and transformation
    (logclr, clr, . . . )
    Type of normalization for RNA-seq data (TMM, DESeq, . . . )
    Parallel computation using BiocParallel
    Output: S4 object of class coseqResults, with corresponding
    methods (plot, summary, show, clusters, likelihood, . . . )
    [email protected] • @andreamrau • https://tinyurl.com/MiMo2021-Rau 6 / 20

    View Slide

  17. coseq for clustering RNA-seq data
    data(fietz)
    counts <- exprs(fietz) ## RNA-seq from mice
    conds <- pData(fietz) ## 3 neocortex regions x 5 reps
    library(DESeq2)
    deseq <- DESeqDataSetFromMatrix(counts,conds,~tissue)
    deseq <- DESeq(deseq)
    coexp <- coseq(deseq, K=2:15, alpha=0.01)
    ## ****************************************
    ## Co-expression analysis on DESeq2 output:
    ## 6461 DE genes at p-adj < 0.01
    ## ****************************************
    ## coseq analysis: kmeans approach & logclr
    ## K = 2 to 15
    ## ****************************************
    ## Running K = 2 ...
    ## Running K = 3 ...
    [email protected] • @andreamrau • https://tinyurl.com/MiMo2021-Rau 7 / 20

    View Slide

  18. Choice of number of clusters
    coexp
    An object of class coseqResults
    6461 features by 15 samples.
    Models fit: K = 2 ... 15
    Chosen clustering model: K = 10
    library(capushe)
    plot(metadata(coexp)$capushe))
    # ICL diagnostic graphic for GMM: plot(coexp, graphs="ICL")
    [email protected] • @andreamrau • https://tinyurl.com/MiMo2021-Rau 8 / 20

    View Slide

  19. Clustering diagnostics with coseq
    plot(coexp, graphs="probapost_boxplots")
    0.00
    0.25
    0.50
    0.75
    1.00
    2 6 9 3 7 5 1 4 8 10
    Cluster
    Max conditional probability
    Genes attributed to cluster with largest conditional probability
    of membership given the estimated parameters:
    τik(θ) =
    πkfk(yi|
    θk)
    K
    =1
    π f (yi|
    θ )
    For K-means, associate clustering partition with spherical GMM
    [email protected] • @andreamrau • https://tinyurl.com/MiMo2021-Rau 9 / 20

    View Slide

  20. Cluster visualization with coseq
    # plot(coexp)
    p <- plot(coexp, conds=conds$tissue, graphs="boxplots",
    collapse_reps="average")$boxplot
    9 10
    5 6 7 8
    1 2 3 4
    CP SVZ VZ CP SVZ VZ
    CP SVZ VZ CP SVZ VZ
    0.00
    0.25
    0.50
    0.75
    1.00
    0.00
    0.25
    0.50
    0.75
    1.00
    0.00
    0.25
    0.50
    0.75
    1.00
    Conditions
    Average expression profiles
    Conditions
    CP
    SVZ
    VZ
    [email protected] • @andreamrau • https://tinyurl.com/MiMo2021-Rau 10 / 20

    View Slide

  21. Cluster visualization with coseq
    library(ggplot2)
    p + ggtitle("RNA-seq profiles") + theme_bw()
    9 10
    5 6 7 8
    1 2 3 4
    CP SVZ VZ CP SVZ VZ
    CP SVZ VZ CP SVZ VZ
    0.00
    0.25
    0.50
    0.75
    1.00
    0.00
    0.25
    0.50
    0.75
    1.00
    0.00
    0.25
    0.50
    0.75
    1.00
    Conditions
    Average expression profiles
    Conditions
    CP
    SVZ
    VZ
    RNA−seq profiles
    [email protected] • @andreamrau • https://tinyurl.com/MiMo2021-Rau 11 / 20

    View Slide

  22. Some thoughts about software usability
    [email protected] • @andreamrau • https://tinyurl.com/MiMo2021-Rau 12 / 20

    View Slide

  23. Some thoughts about software usability
    Fully worked examples in package vignette and extensive
    documentation ⇒ workflow prototype
    Inputs and outputs:
    Accept a range of input types (S4 classes and methods)
    Structure outputs according to the next step in analysis pipeline
    Incorporate feedback from users ⇒ Bioconductor forums,
    emails, ...
    Reasonable parameter default values (users almost always just
    use defaults!)
    Simplified package and function names, consistent naming
    conventions
    Exploit ggplot2 functionality for fully customizable plots
    [email protected] • @andreamrau • https://tinyurl.com/MiMo2021-Rau 13 / 20

    View Slide

  24. Highlighting some recent applications using coseq
    Tomato co-expression (Sauvage et al., 2017)
    Decipher domestication footprints in wild + crop tomato
    Clusters enriched in relevant functional terms (carbohydrate
    metabolism, epigenetic regulation of expression)
    Results suggestive of rewiring of gene co-expression induced by
    domestication
    Varroa life cycle co-expression (Mondet et al., 2018)
    Full life-cycle transcriptomic catalog of a honeybee parasite
    Many clusters characterized by stage-specific expression (e.g.
    pre- and post-reproductive stages)
    Energetic and chitin metabolic process → transcriptional
    regulation → neurotransmitter/neuropeptide receptors involved
    in behavioural regulation = Adaptation of parasite to host
    [email protected] • @andreamrau • https://tinyurl.com/MiMo2021-Rau 14 / 20

    View Slide

  25. From mono-omics to multi-omics...
    2
    Gene
    expression
    TTTGCA
    AAACGT
    TF
    Transcription
    factor
    expression
    Copy number alterations
    The gene regulatory landscape and multi-omics data
    Promoter methylation
    microRNA
    expression
    GCGTTC
    GCGTT
    CGTTC
    Somatic mutations
    Germline genetic variation
    Enhancer
    Accessibility
    Protein
    abundance
    Metabolite
    concentrations
    ⇒ Most integrative clustering approaches focus on classifying
    samples (rather than genes)
    [email protected] • @andreamrau • https://tinyurl.com/MiMo2021-Rau 15 / 20

    View Slide

  26. maskmeans: Multi-view aggregation/splitting K-means
    With C. Maugis-Rabusseau, A. Godichon-Baggioni
    (Standardized) multi-vew data Z = Z(1), . . . , Z(v), . . . , Z(V ) ,
    normalized by view size:
    X(v) = Z(v)/dv
    Aggregation/splitting of initial K clusters by minimizing:
    Crit (ΠK , α, µ) =
    K
    k=1
    n
    i=1
    V
    v=1
    (αk,v )γ(πi,k)δ X(v)
    i
    − µ(v)
    k
    2
    ,
    where γ, δ ≥ 1 and v
    αk,v = k
    πi,k = 1 for all k = 1, . . . , K
    [email protected] • @andreamrau • https://tinyurl.com/MiMo2021-Rau 16 / 20

    View Slide

  27. maskmeans: Multi-view aggregation/splitting K-means
    With C. Maugis-Rabusseau, A. Godichon-Baggioni
    (Standardized) multi-vew data Z = Z(1), . . . , Z(v), . . . , Z(V ) ,
    normalized by view size:
    X(v) = Z(v)/dv
    Aggregation/splitting of initial K clusters by minimizing:
    Crit (ΠK , α, µ) =
    K
    k=1
    n
    i=1
    V
    v=1
    (αk,v )γ(πi,k)δ X(v)
    i
    − µ(v)
    k
    2
    ,
    where γ, δ ≥ 1 and v
    αk,v = k
    πi,k = 1 for all k = 1, . . . , K
    Starting with initial membership probabilities Π(0) = (πi,k) for K0
    1. Multi-view aggregation: aggregate clusters while minimizing
    Crit, where δ = 1 and αk,v = αv for all k
    2. Multi-view splitting: split clusters while minimizing Crit
    ⇒ Special cases: hard vs fuzzy clustering, per-cluster weights or not
    [email protected] • @andreamrau • https://tinyurl.com/MiMo2021-Rau 16 / 20

    View Slide

  28. Multi-view K-means splitting for TCGA multi-omics data
    TCGA multi-omics breast cancer data in n= 506 patients
    (226 genes + 149 miRNAs of interest)
    Multi-view K-means splitting to refine previously inferred BRCA
    subtypes (Basal, Her2+, Luminal A, Luminal B, normal) of
    individuals to reveal clinically interesting subgroupings
    n = 61 n = 38 n = 228 n = 136 n = 43
    maskmeans for TCGA breast cancer
    n = 506 patients; focus on subset of 226 genes (TP53, MKI67, estrogen signaling and ErbB signaling pathways, and the SAM40
    DNA methylation signature) and 149 miRNAs with avg normalized expression > 50
    Age at diagnosis + menopause status
    Number of lymph nodes
    [email protected] • @andreamrau • https://tinyurl.com/MiMo2021-Rau 17 / 20

    View Slide

  29. maskmeans: Multi-view aggregation and splitting K-means
    devtools::install_github("andreamrau/maskmeans")
    library(maskmeans)
    aggreg <- maskmeans(mv_data, clustering_init,
    type="aggregation", ...)
    split <- maskmeans(mv_data, clustering_init,
    type="splitting", Kmax, ...)
    mv_simulate(...)
    mv_plot(...)
    maskmeans_plot(...)
    [email protected] • @andreamrau • https://tinyurl.com/MiMo2021-Rau 18 / 20

    View Slide

  30. Potential next steps for (multi-omic) co-expression
    Ideally, move from co-expression → co-regulation
    Co-regulation is explained by many things (biochemical,
    genetic, evolutionary, technological factors, ...):
    Compartimentalization / 3D organization of genome (Hi-C
    data)
    Local sharing of regulatory elements (e.g., transcription factors,
    ChIP-seq data)
    Housekeeping genes that are constitutively expressed across
    tissues
    ...
    Increasingly large/complex experimental designs (e.g.,
    scRNA-seq data) → variable selection procedures
    [email protected] • @andreamrau • https://tinyurl.com/MiMo2021-Rau 19 / 20

    View Slide

  31. In progress: hierarchical Bayesian mixture models for genomic prediction
    PhD work of F. Mollandin (H2020 GENE-SWitCH)
    y = µ1n + Xβ + e
    [email protected] • @andreamrau • https://tinyurl.com/MiMo2021-Rau 20 / 20

    View Slide

  32. In progress: hierarchical Bayesian mixture models for genomic prediction
    PhD work of F. Mollandin (H2020 GENE-SWitCH)
    y = µ1n + Xβ + e
    BayesR : βi ∼ π1 δ(0)
    null
    +π2 N(0, 0.0001σ2
    g
    )
    small
    +π3 N(0, 0.001σ2
    g
    )
    medium
    +π4 N(0, 0.01σ2
    g
    )
    large
    [email protected] • @andreamrau • https://tinyurl.com/MiMo2021-Rau 20 / 20

    View Slide

  33. In progress: hierarchical Bayesian mixture models for genomic prediction
    PhD work of F. Mollandin (H2020 GENE-SWitCH)
    y = µ1n + Xβ + e
    BayesR : βi ∼ π1 δ(0)
    null
    +π2 N(0, 0.0001σ2
    g
    )
    small
    +π3 N(0, 0.001σ2
    g
    )
    medium
    +π4 N(0, 0.01σ2
    g
    )
    large
    BayesRC+ with overlapping functional multi-omics categories:
    βi |a ∈ A(i) ∼
    a∈A(i)
    4
    k=1
    πk,aN(0, σ2
    k
    )
    [email protected] • @andreamrau • https://tinyurl.com/MiMo2021-Rau 20 / 20

    View Slide

  34. vignette("coseq")
    MixStatSeq ANR-JCJC grant (C. Maugis-Rabusseau)
    http://bioconductor.org/packages/coseq
    Rau, A., et al. (2015) Co-expression analysis of high-throughput transcriptome
    sequencing data with Poisson mixture models. Bioinformatics.
    Rau and Maugis-Rabusseau (2018) Transformation and model choice for
    RNA-seq co-expression. Briefings in Bioinformatics.
    Godichon-Baggioni et al. (2018) Clustering transformed compositional data
    using K-means, with applications in gene expression and bicycle sharing system
    data. Journal of Applied Statistics.

    View Slide