Upgrade to Pro — share decks privately, control downloads, hide ads and more …

Individualized multi omic pathway deviation scores using multiple factor analysis

Andrea Rau
December 05, 2019

Individualized multi omic pathway deviation scores using multiple factor analysis

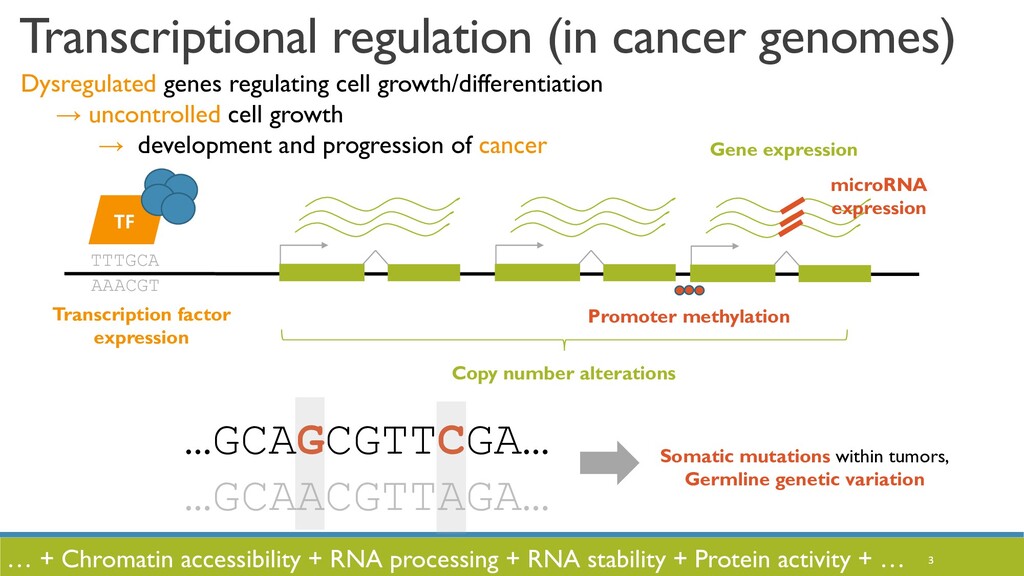
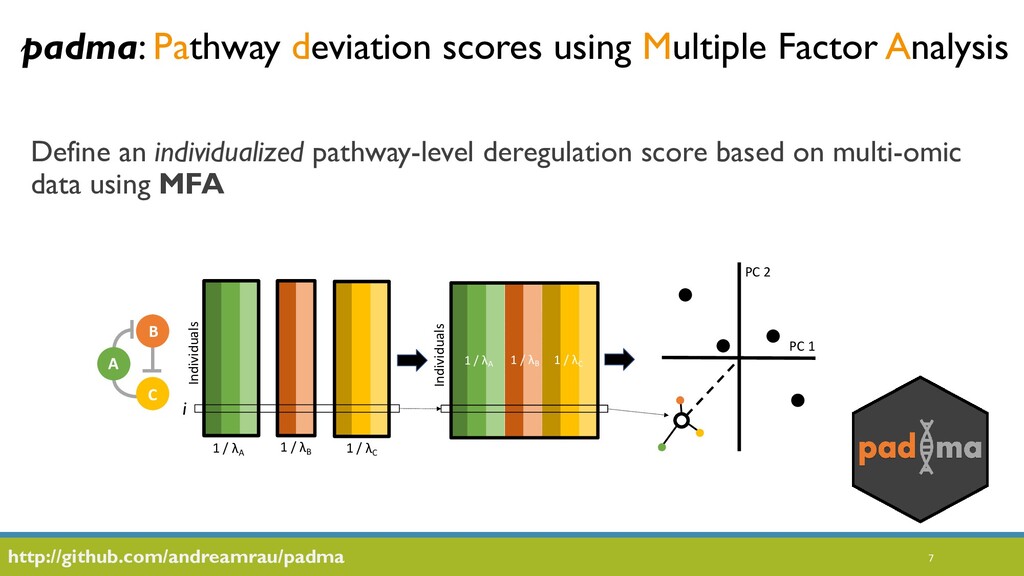
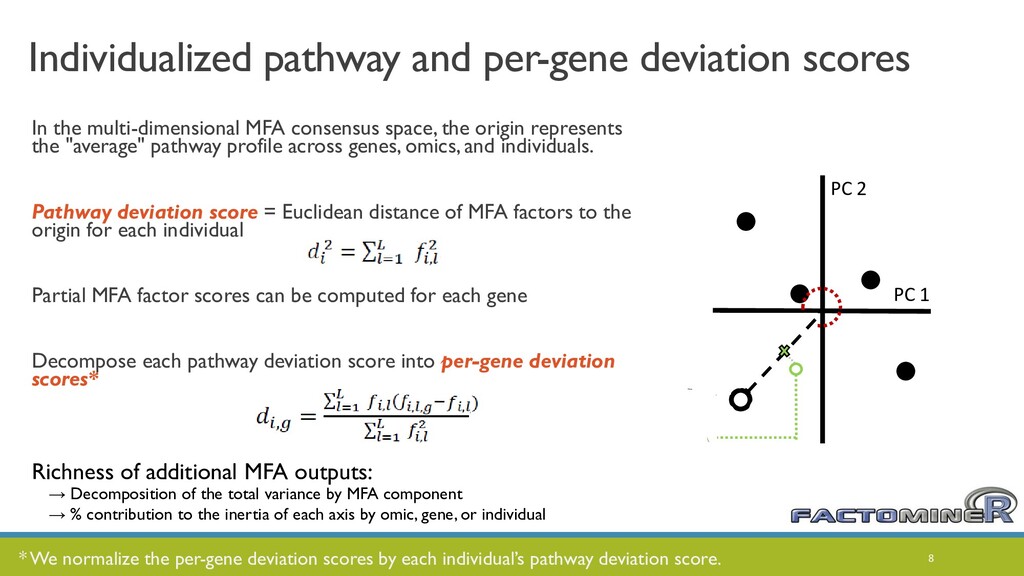
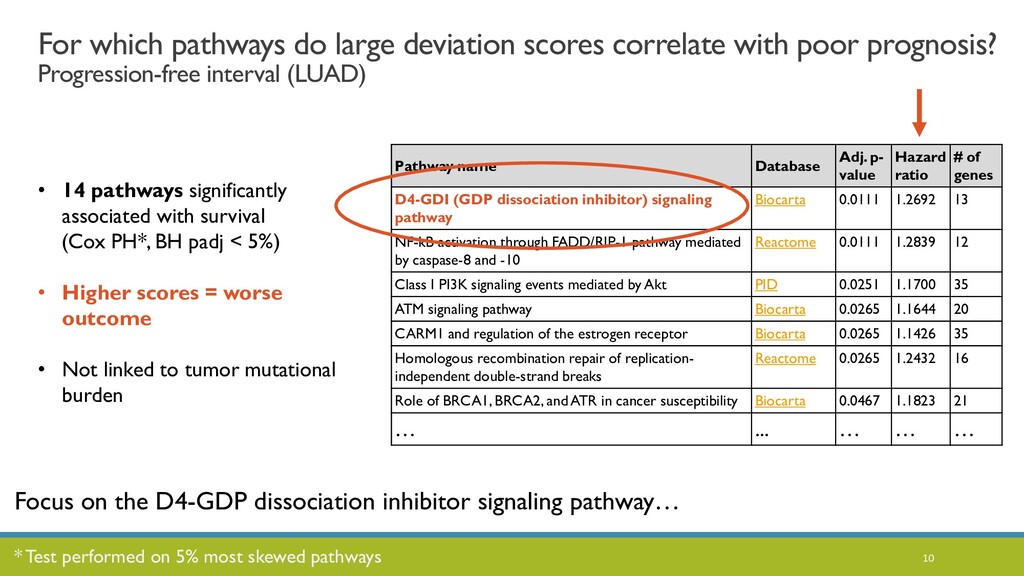
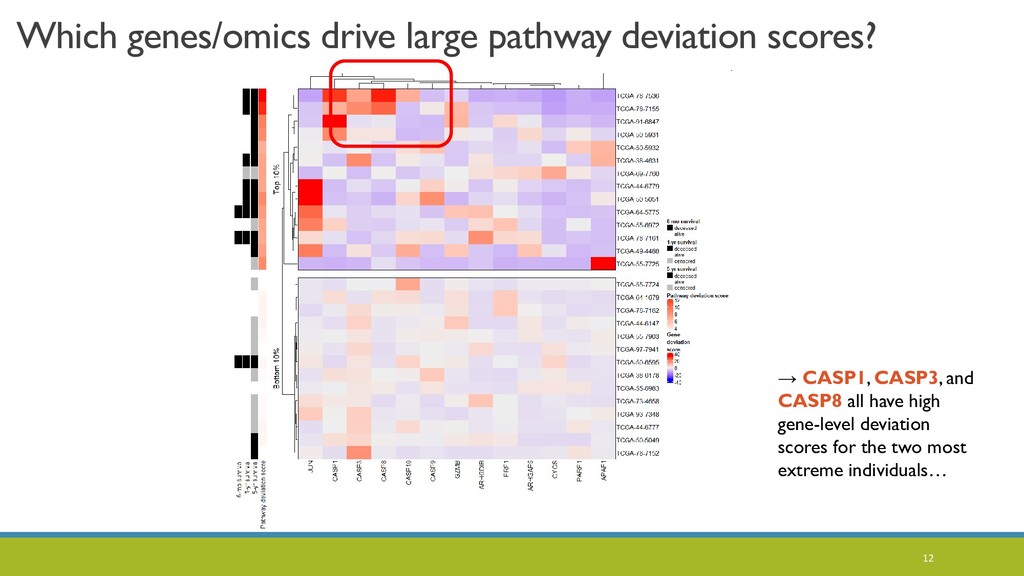
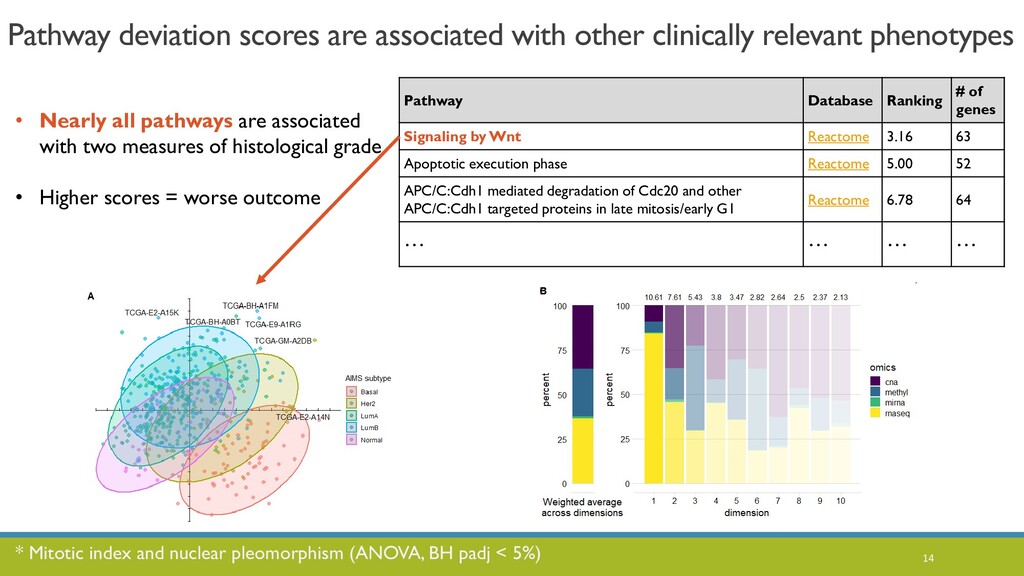
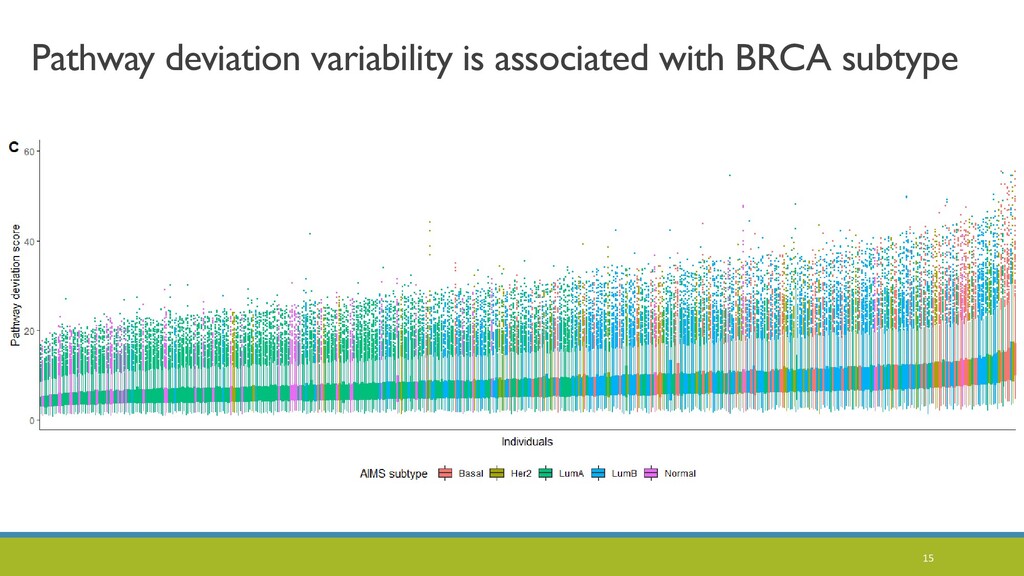
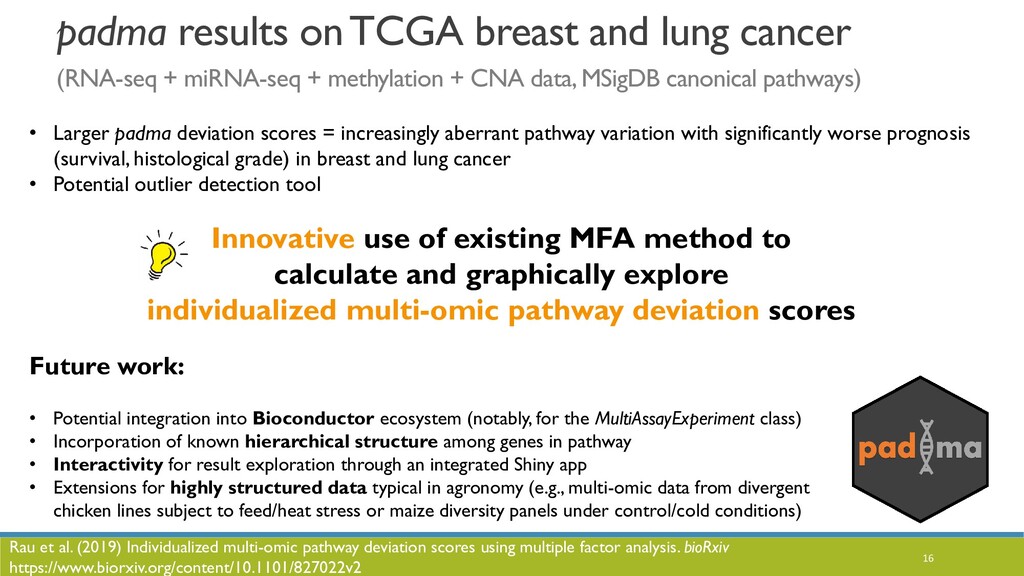
Malignant progression of normal tissue is typically driven by complex networks of somatic changes, including genetic mutations, copy number aberrations, epigenetic changes, and transcriptional reprogramming. To delineate aberrant multi-omic tumor features that correlate with clinical outcomes, we present a novel pathway-centric tool based on the multiple factor analysis framework called padma. Using a multi-omic consensus representation, padma quantifies and characterizes individualized pathway-specific multi-omic deviations and their underlying drivers, with respect to the sampled population. We demonstrate the utility of padma to correlate patient outcomes with complex genetic, epigenetic, and transcriptomic perturbations in clinically actionable pathways in breast and lung cancer.

Andrea Rau

December 05, 2019
Tweet

More Decks by Andrea Rau

Other Decks in Science

Transcript

  1. Individualized multi-omic pathway deviation scores using multiple factor analysis ANDREA

    RAU EUROBIOC DE DUVE INSTITUTE, UCLOUVAIN @ BRUSSELS DECEMBER 9, 2019 1 https://andrea-rau.com, @andreamrau
  2. 2 2

  3. 3 Gene expression TTTGCA AAACGT TF Transcription factor expression Copy

    number alterations Transcriptional regulation (in cancer genomes) Promoter methylation microRNA expression …GCAGCGTTCGA… …GCAACGTTAGA… Somatic mutations within tumors, Germline genetic variation … + Chromatin accessibility + RNA processing + RNA stability + Protein activity + … 3 Dysregulated genes regulating cell growth/differentiation → uncontrolled cell growth → development and progression of cancer
  4. 4 - Comprehensive, multi-dimensional maps of key genomic changes in

    33 cancer types from 11k+ individuals - Publically available data (multi-tiered data depending on patient identifiability) - Widely used by the research community (1000+ publications by TCGA network + independent researchers) The Cancer Genome Atlas (TCGA) Image: Corces et al. (2018)
  5. 5 - Account for interdependencies within and across data types

    - (Partially) matched omics data across samples or biological entities (e.g., genes) - In some contexts, limited/incomplete a priori knowledge of relevant phenotype groups for comparisons = unsupervised analysis Multi-omic data → Multivariate, multi-table methods How do we integrate multi-omic data? What question are we specifically addressing? How can we use multi-omic data to answer that question? Image: Rajasundaram and Selbig (2016)
  6. 6 For a given pathway of interest, can we identify

    and quantify highly aberrant individuals in a sample based on multi-omic data? Does patient prognosis correlate with large pathway deviation scores? Which individuals have the most aberrant profiles for pathways of interest? Which genes / omic drive these aberrant scores? Our focus is specifically on pathway-level inference
  7. A B C Individuals 1 / λA 1 / λB

    1 / λC Individuals 1 / λA 1 / λB 1 / λC PC 1 PC 2 ! 7 Define an individualized pathway-level deregulation score based on multi-omic data using MFA http://github.com/andreamrau/padma padma: Pathway deviation scores using Multiple Factor Analysis i 7
  8. Individualized pathway and per-gene deviation scores Individuals 1 / λA

    1 / λB 1 / λC Individuals 1 / λA 1 / λB 1 / λC PC 1 PC 2 ! In the multi-dimensional MFA consensus space, the origin represents the "average" pathway profile across genes, omics, and individuals. Pathway deviation score = Euclidean distance of MFA factors to the origin for each individual Partial MFA factor scores can be computed for each gene Decompose each pathway deviation score into per-gene deviation scores* Richness of additional MFA outputs: → Decomposition of the total variance by MFA component → % contribution to the inertia of each axis by omic, gene, or individual Individuals 1 / λA 1 / λB 1 / λC Individuals 1 / λA 1 / λB 1 / λC PC 1 PC 2 ! * We normalize the per-gene deviation scores by each individual’s pathway deviation score. 8
  9. 9 Applying padma to TCGA data Breast invasive carcinoma (BRCA;

    n = 504) and lung adenocarcinoma (LUAD; n = 144) • Batch correction performed using removeBatchEffects in limma • RNA-seq + promoter methylation + copy number alterations + miRNA-seq • miRNA → gene mapping provided by miRTarBase (exact matches, Functional MTI predictions) • 1136 MSigDB curated canonical pathways (Biocarta, PID, Reactome, Sigma Aldrich, Signaling Gateway, Signal Transduction Knowledge Environment, Matrisome Project) Patient prognosis measured using progression-free interval survival times (LUAD) and histological grade (BRCA)
  10. For which pathways do large deviation scores correlate with poor

    prognosis? Progression-free interval (LUAD) 10 Pathway name Database Adj. p- value Hazard ratio # of genes D4-GDI (GDP dissociation inhibitor) signaling pathway Biocarta 0.0111 1.2692 13 NF-kB activation through FADD/RIP-1 pathway mediated by caspase-8 and -10 Reactome 0.0111 1.2839 12 Class I PI3K signaling events mediated by Akt PID 0.0251 1.1700 35 ATM signaling pathway Biocarta 0.0265 1.1644 20 CARM1 and regulation of the estrogen receptor Biocarta 0.0265 1.1426 35 Homologous recombination repair of replication- independent double-strand breaks Reactome 0.0265 1.2432 16 Role of BRCA1, BRCA2, and ATR in cancer susceptibility Biocarta 0.0467 1.1823 21 … ... … … … • 14 pathways significantly associated with survival (Cox PH*, BH padj < 5%) • Higher scores = worse outcome • Not linked to tumor mutational burden * Test performed on 5% most skewed pathways Focus on the D4-GDP dissociation inhibitor signaling pathway…
  11. Which individuals have the most highly aberrant multi-omic profiles? 11

    D4-GDI signaling pathway, LUAD MFA 1: RNA-seq (54.38%) MFA 2: methylation (42.29%) MFA 3: CNA (59.18%)
  12. Which genes/omics drive large pathway deviation scores? 12 → CASP1,

    CASP3, and CASP8 all have high gene-level deviation scores for the two most extreme individuals…
  13. 14 • Nearly all pathways are associated with two measures

    of histological grade • Higher scores = worse outcome Pathway deviation scores are associated with other clinically relevant phenotypes Pathway Database Ranking # of genes Signaling by Wnt Reactome 3.16 63 Apoptotic execution phase Reactome 5.00 52 APC/C:Cdh1 mediated degradation of Cdc20 and other APC/C:Cdh1 targeted proteins in late mitosis/early G1 Reactome 6.78 64 … … … … * Mitotic index and nuclear pleomorphism (ANOVA, BH padj < 5%)
  14. 16 • Larger padma deviation scores = increasingly aberrant pathway

    variation with significantly worse prognosis (survival, histological grade) in breast and lung cancer • Potential outlier detection tool Innovative use of existing MFA method to calculate and graphically explore individualized multi-omic pathway deviation scores Future work: • Potential integration into Bioconductor ecosystem (notably, for the MultiAssayExperiment class) • Incorporation of known hierarchical structure among genes in pathway • Interactivity for result exploration through an integrated Shiny app • Extensions for highly structured data typical in agronomy (e.g., multi-omic data from divergent chicken lines subject to feed/heat stress or maize diversity panels under control/cold conditions) padma results on TCGA breast and lung cancer (RNA-seq + miRNA-seq + methylation + CNA data, MSigDB canonical pathways) Rau et al. (2019) Individualized multi-omic pathway deviation scores using multiple factor analysis. bioRxiv https://www.biorxiv.org/content/10.1101/827022v2