Upgrade to Pro — share decks privately, control downloads, hide ads and more …

Exploring drivers of gene expression in The Cancer Genome Atlas

Andrea Rau
March 28, 2018

Exploring drivers of gene expression in The Cancer Genome Atlas

Presentation at the MCW Physiology Department Seminar

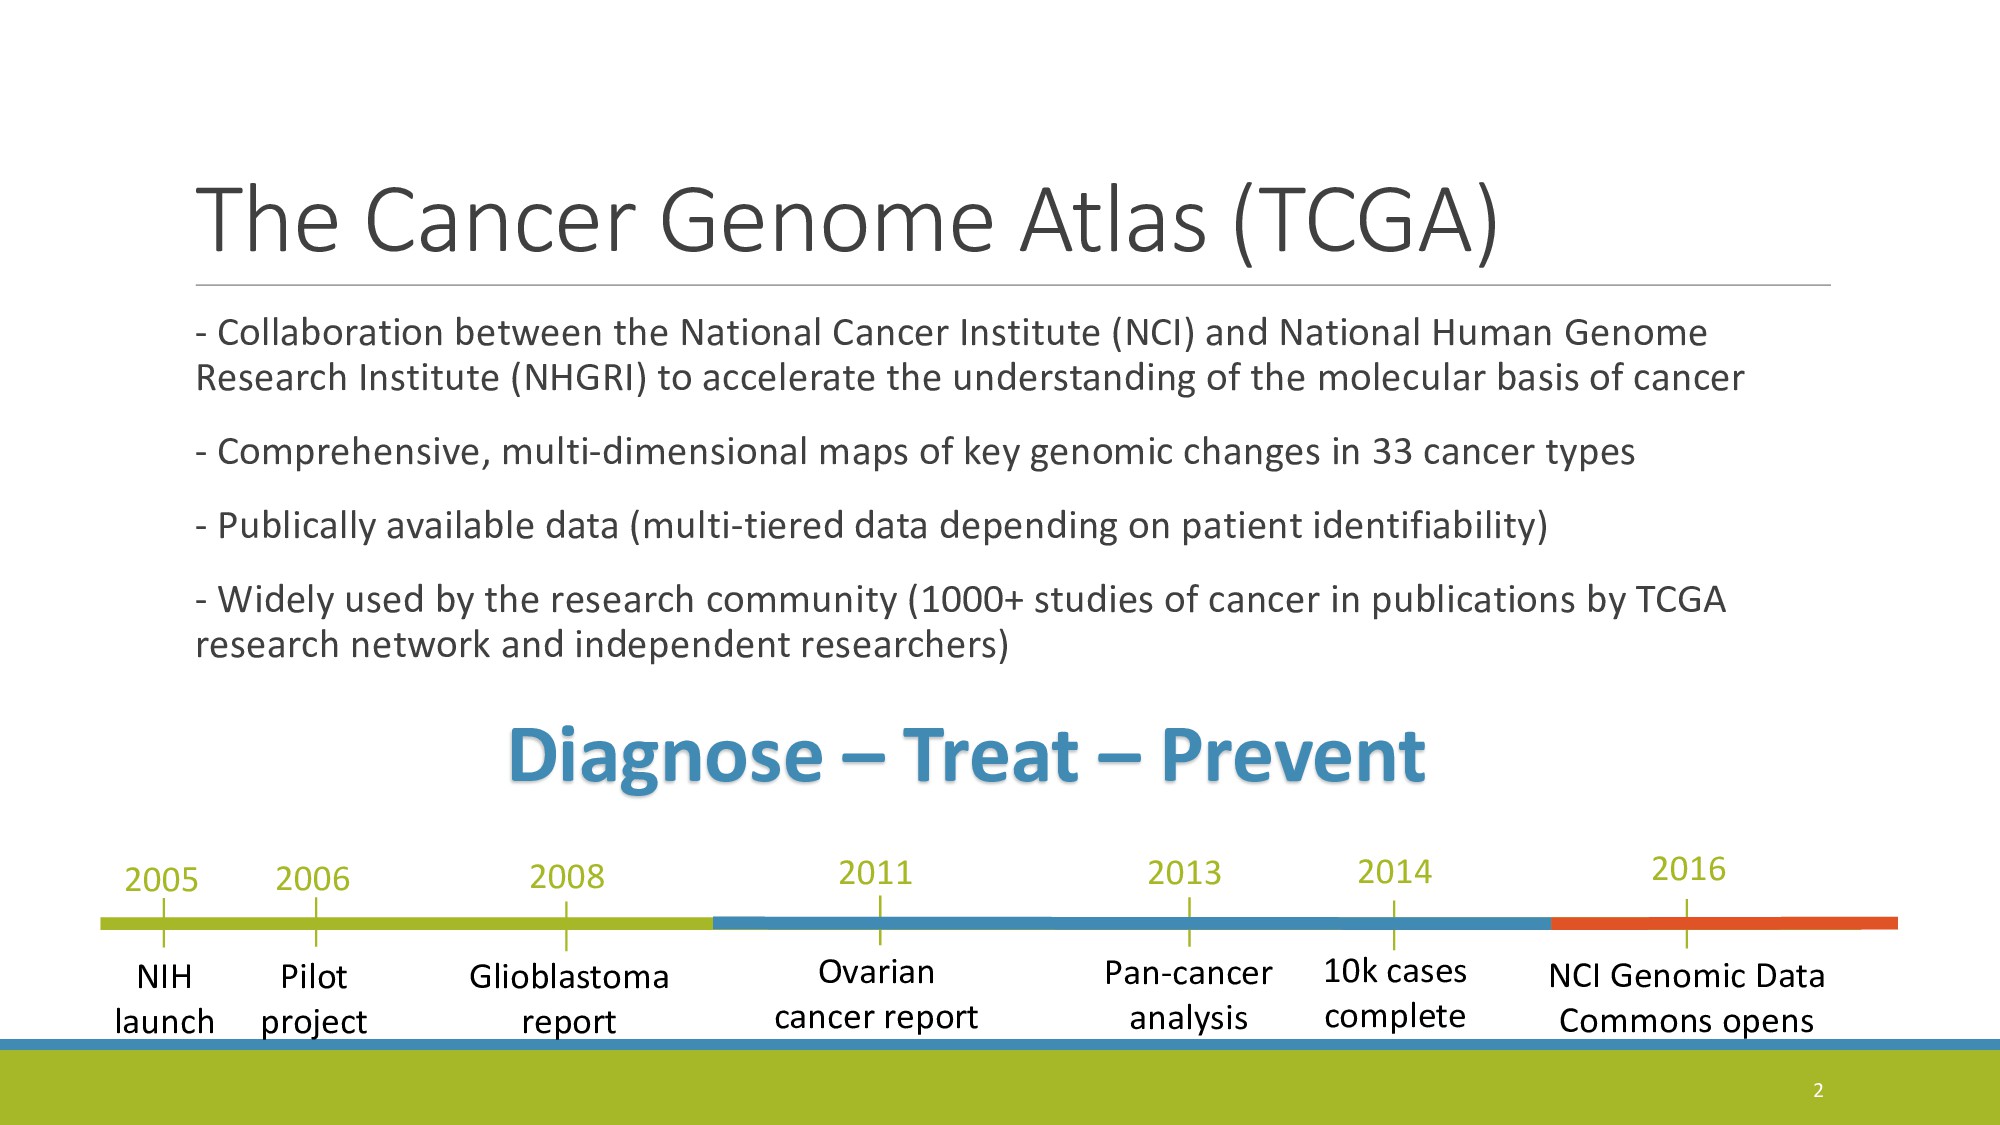
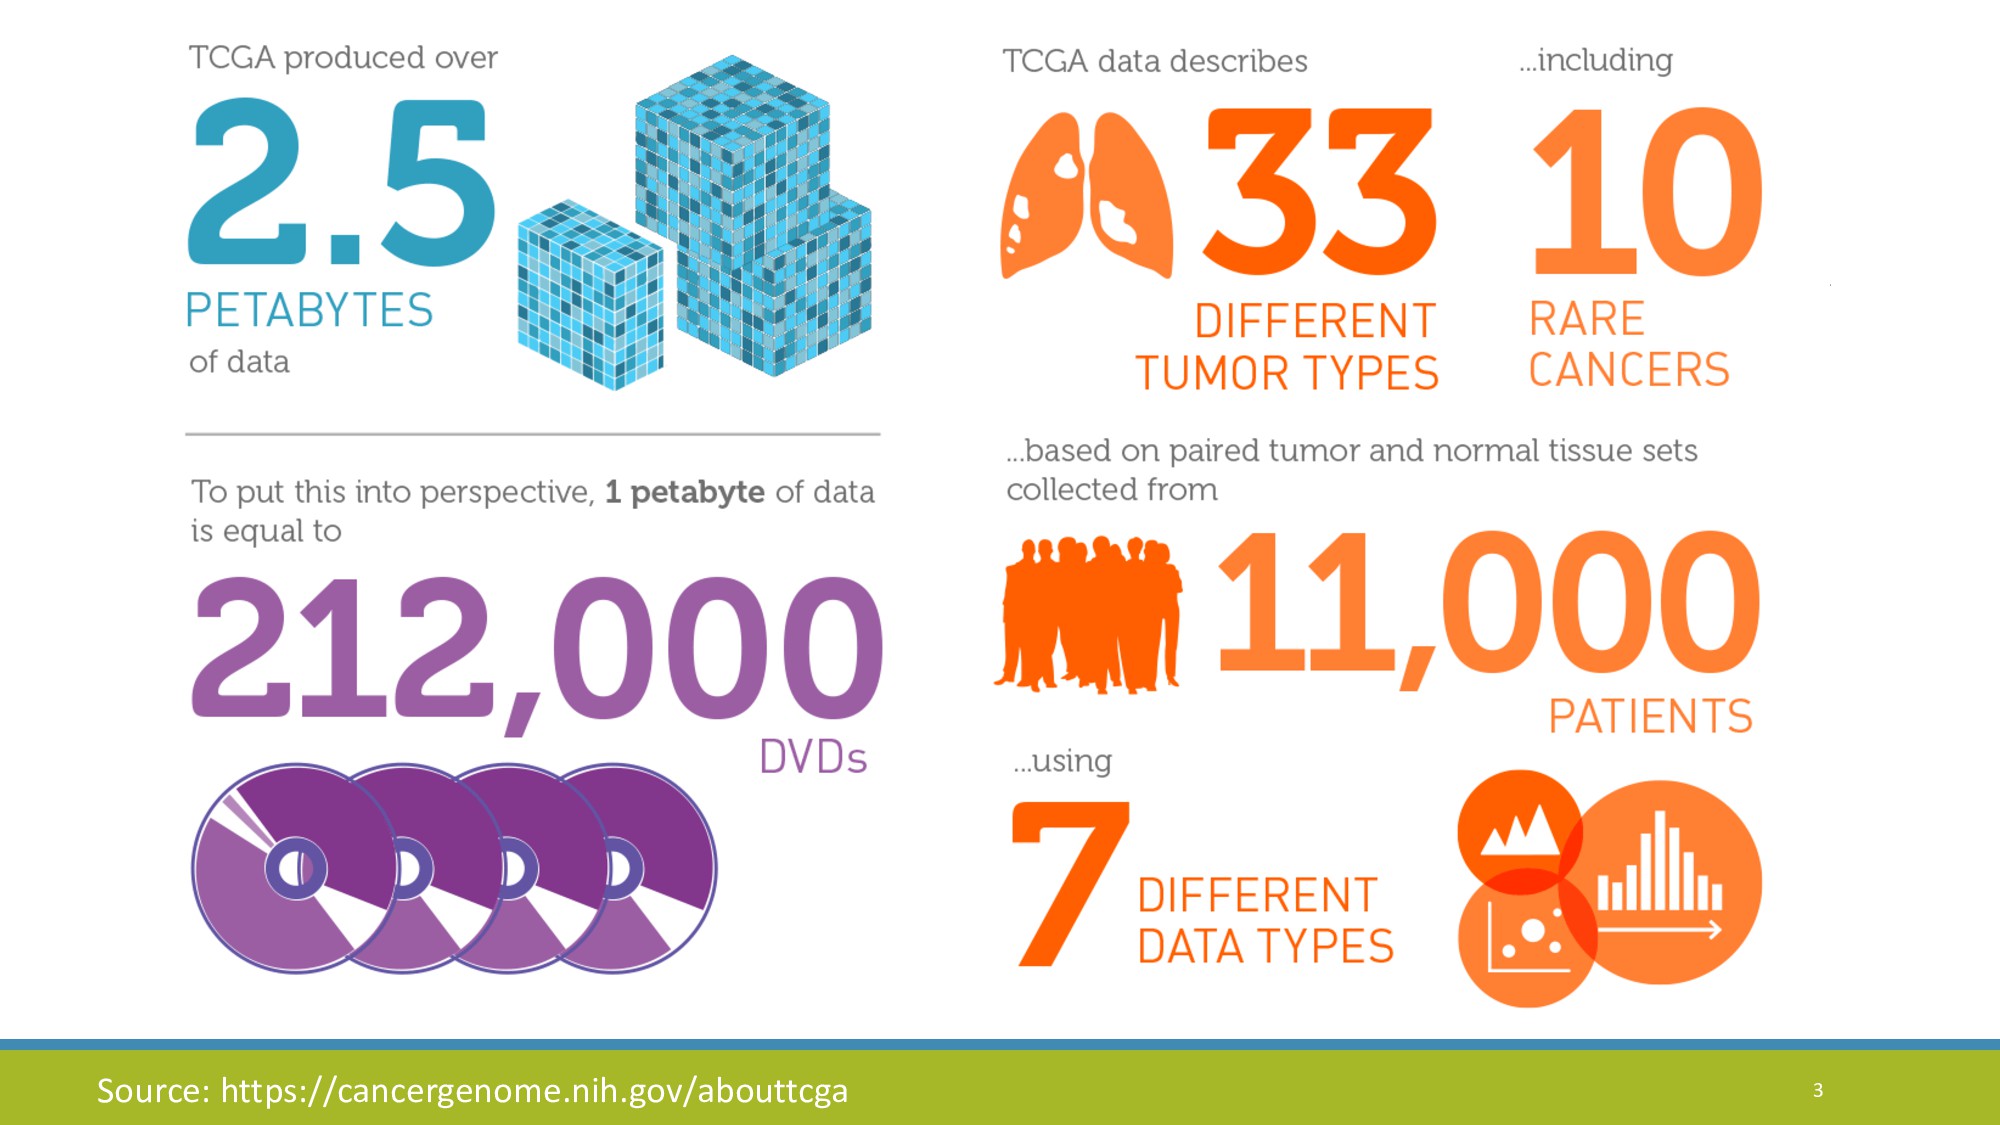
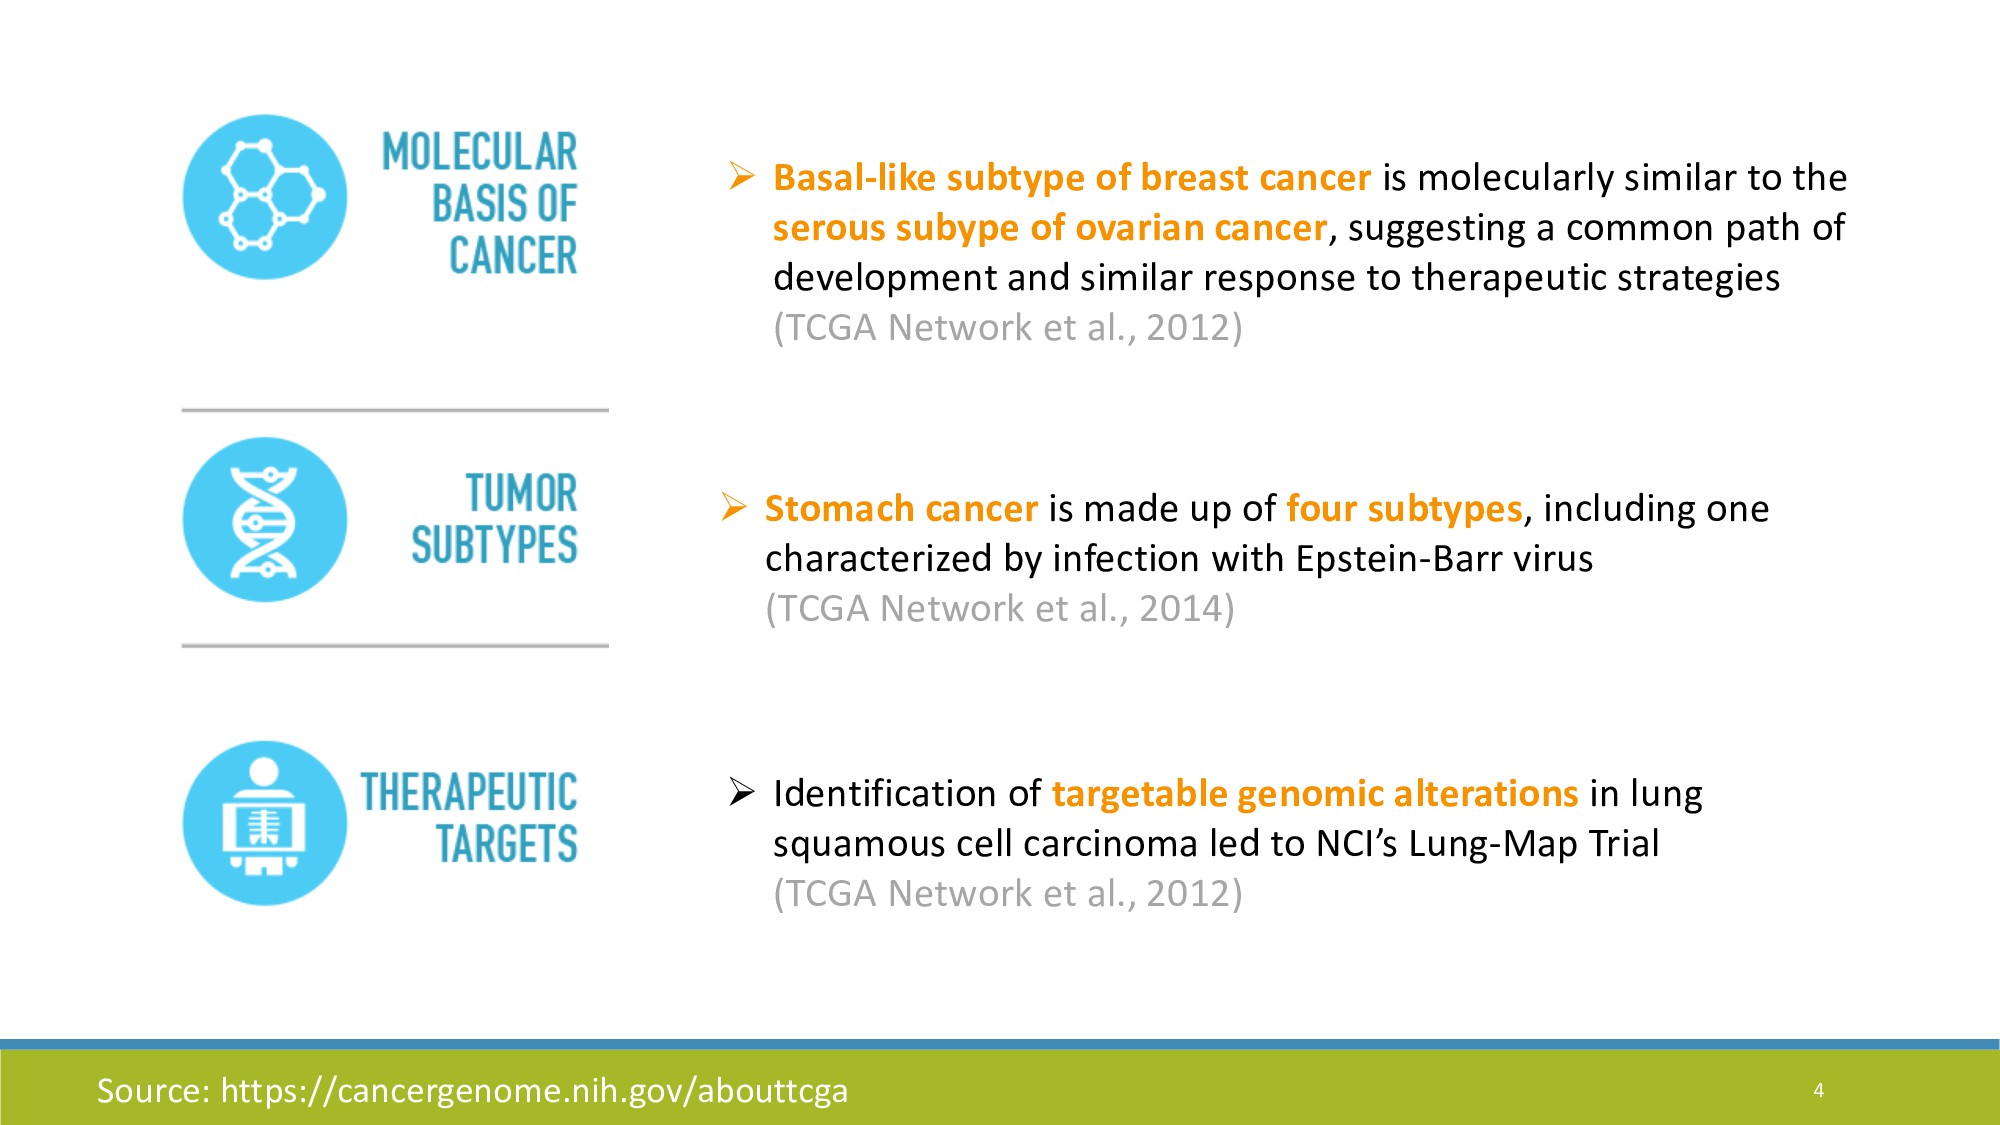
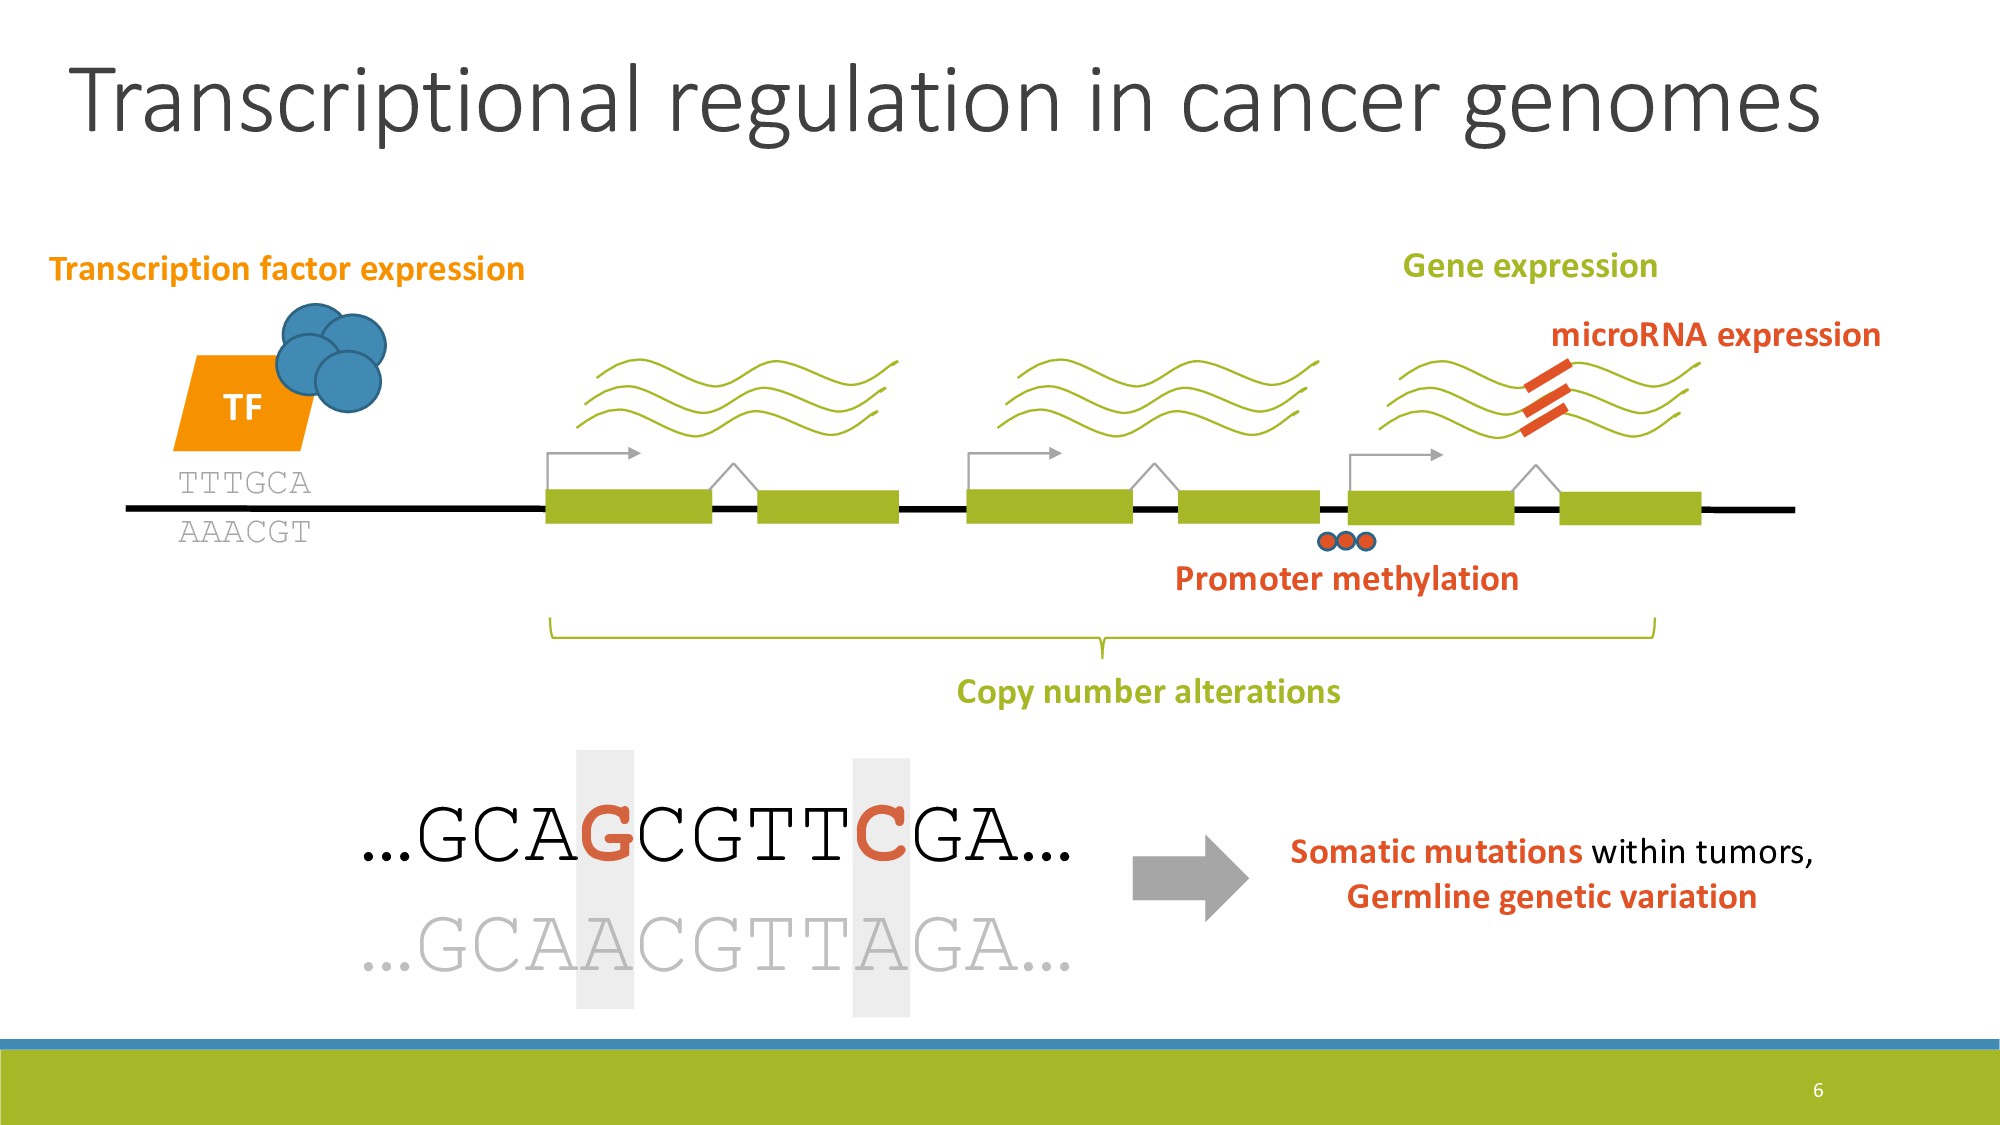
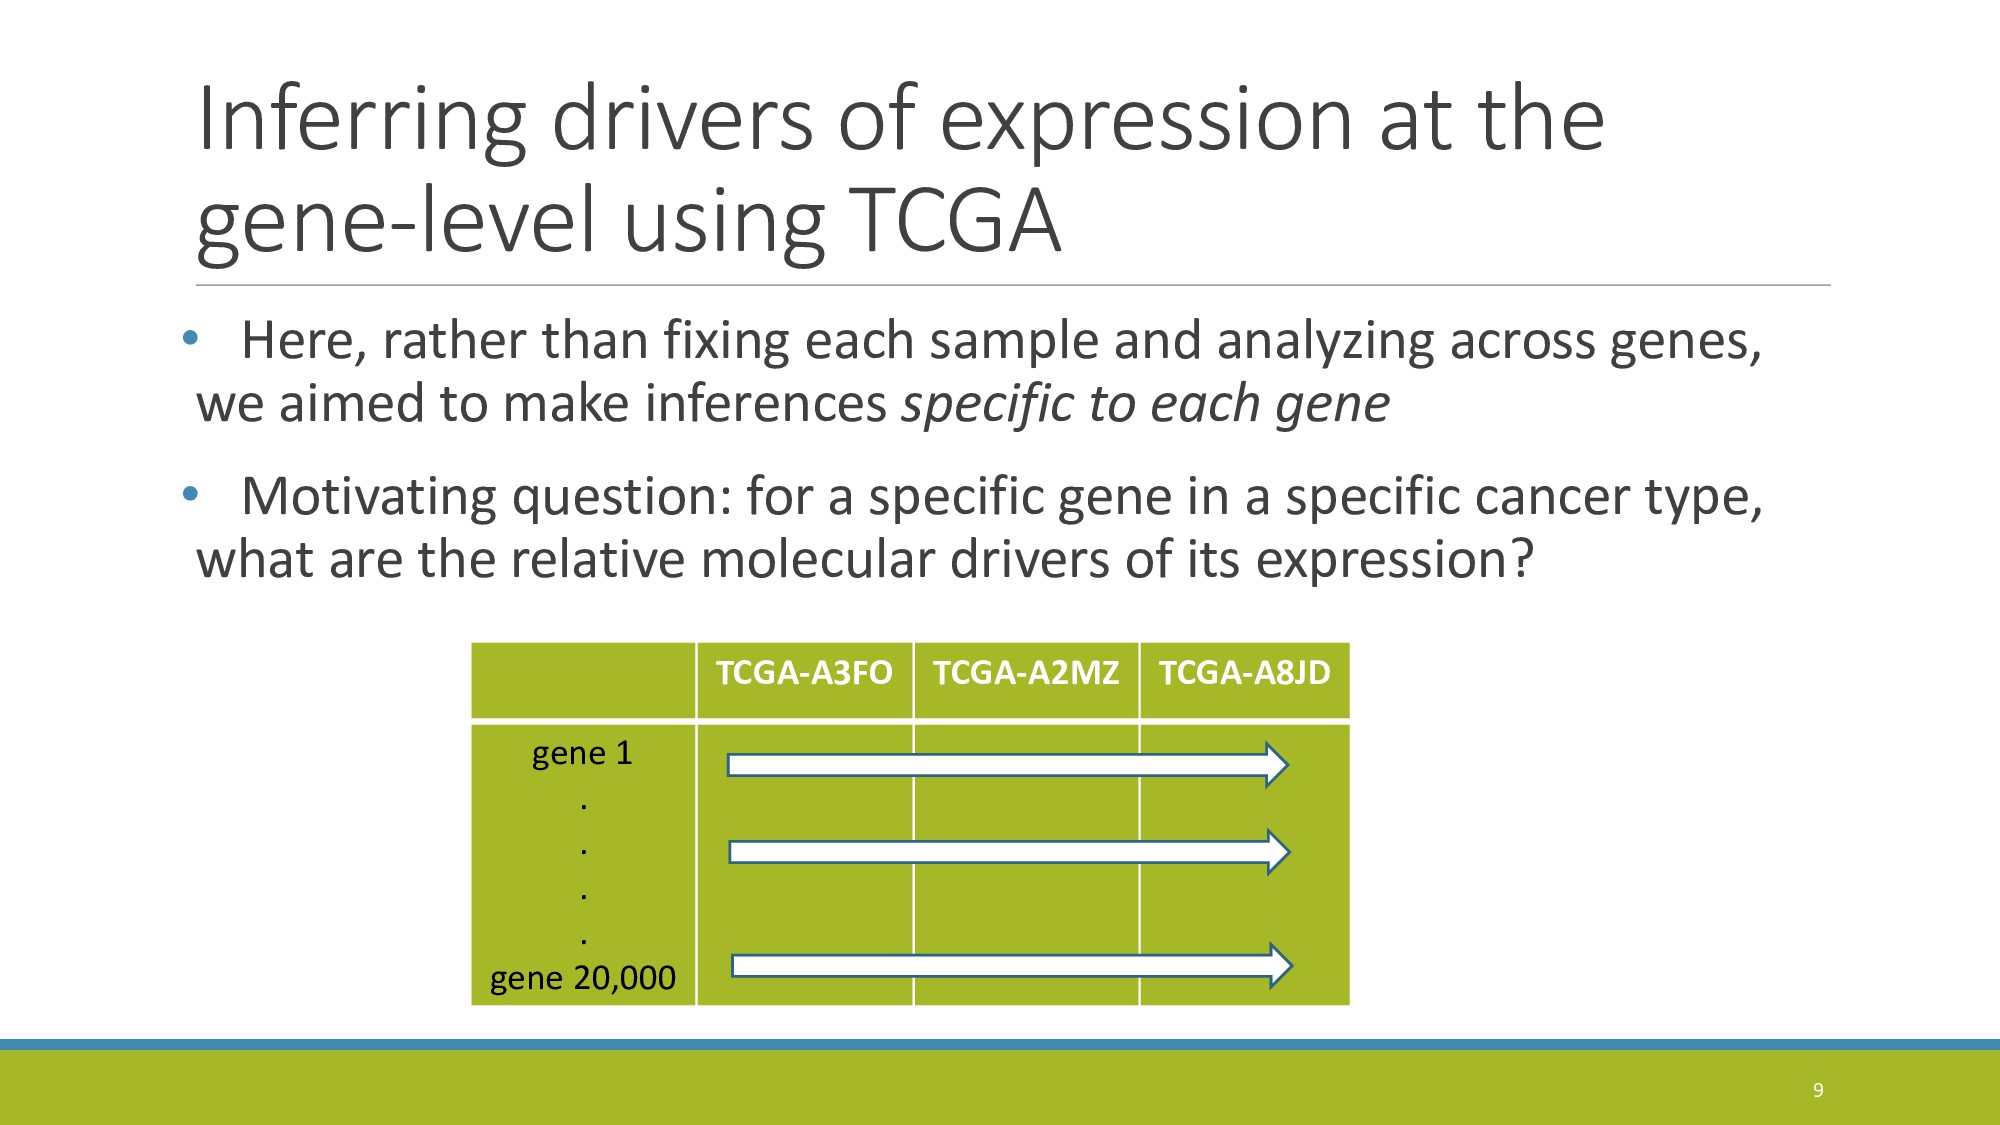
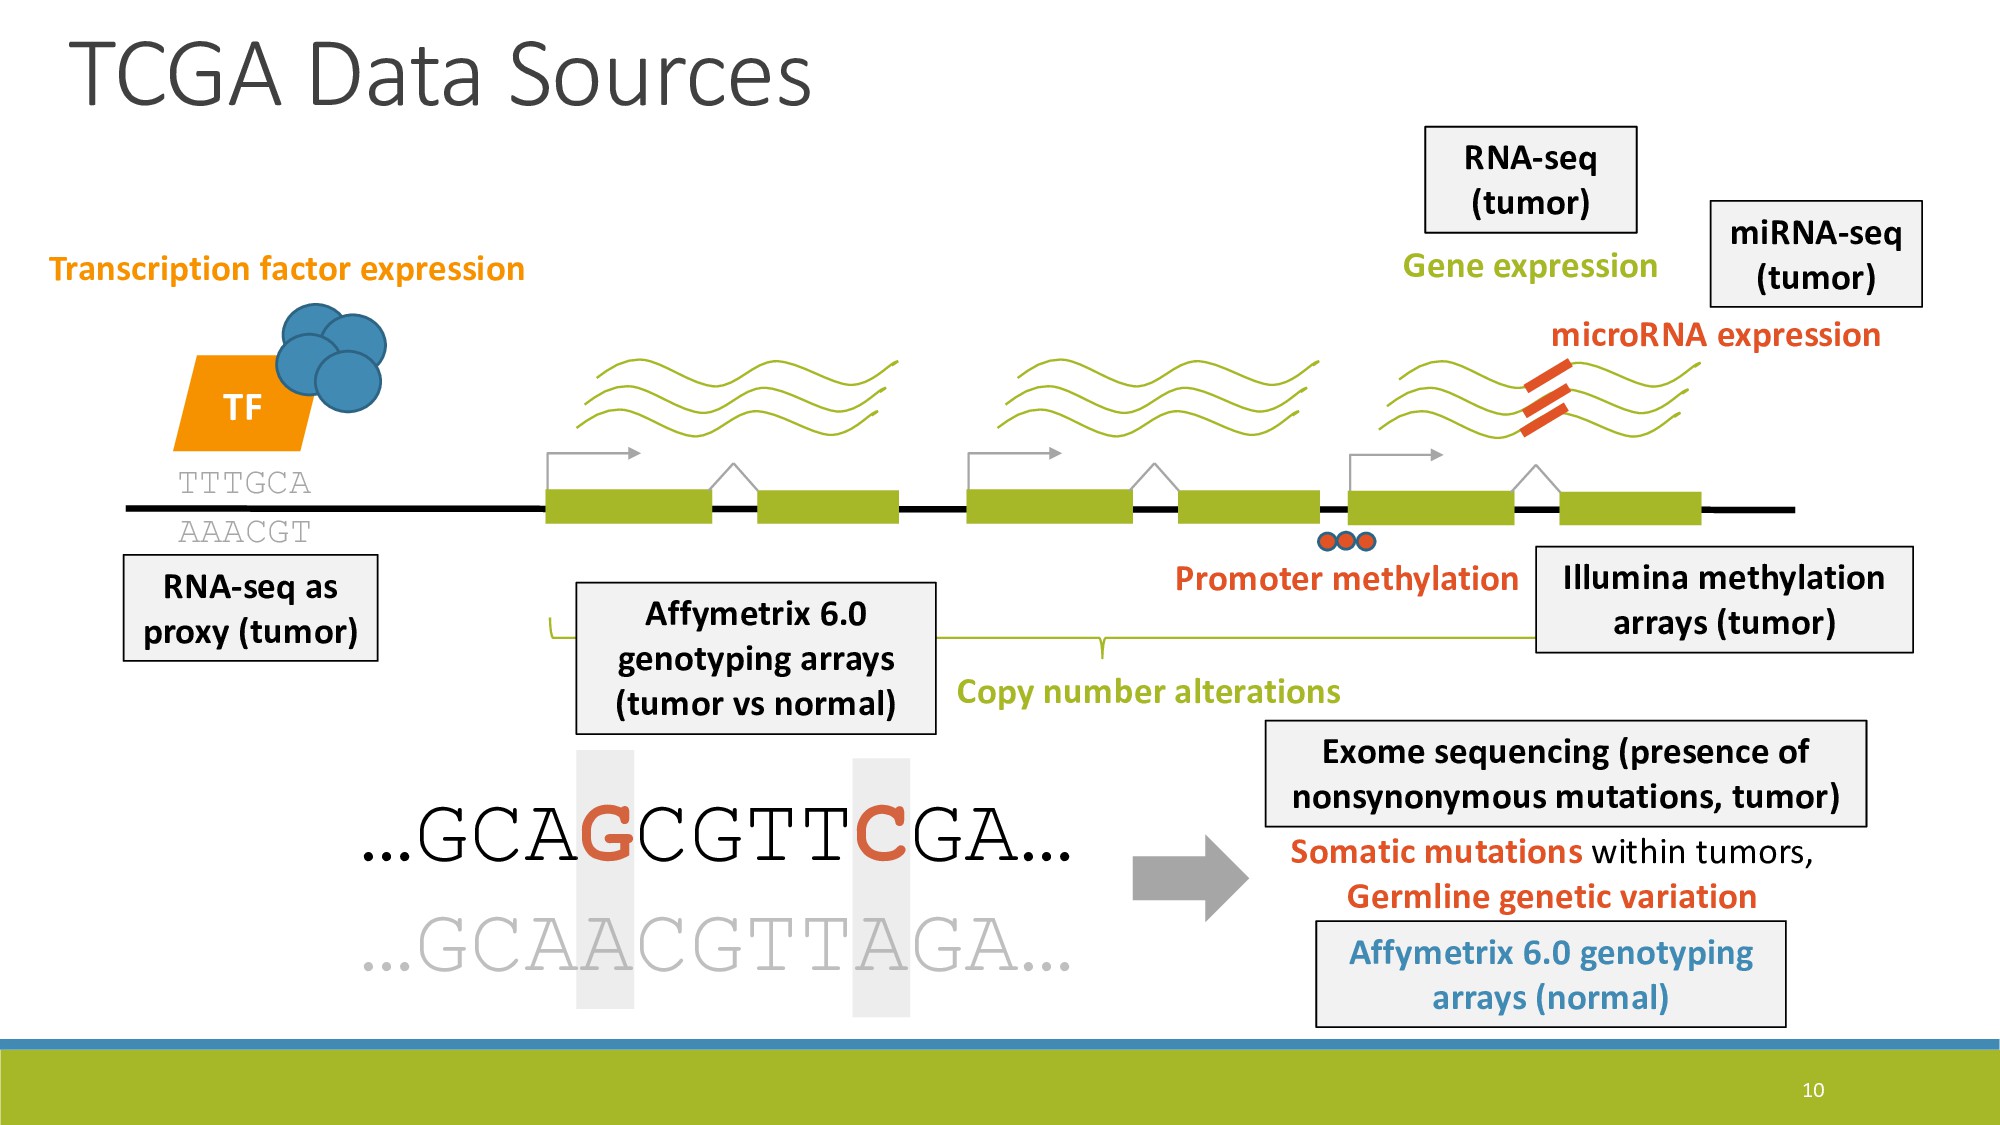
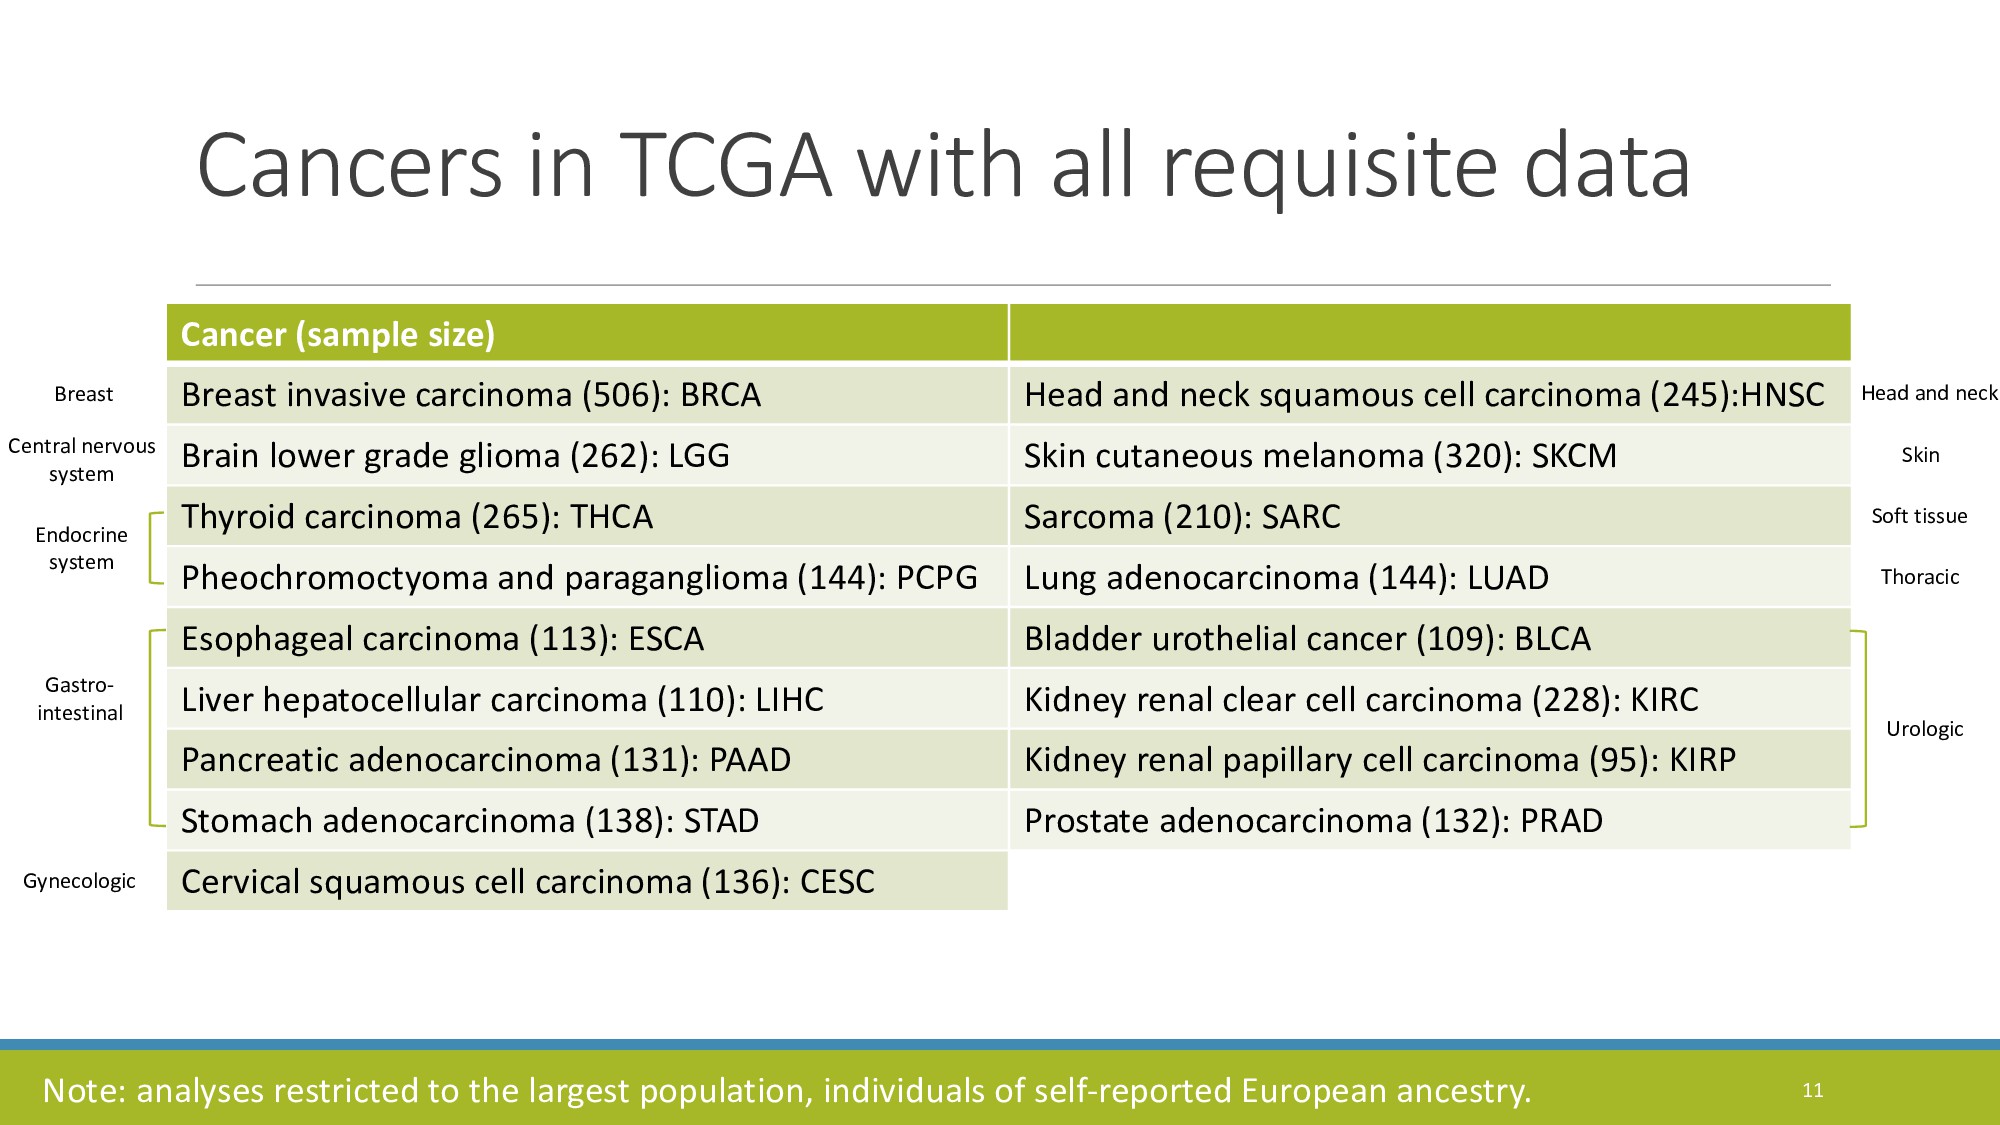
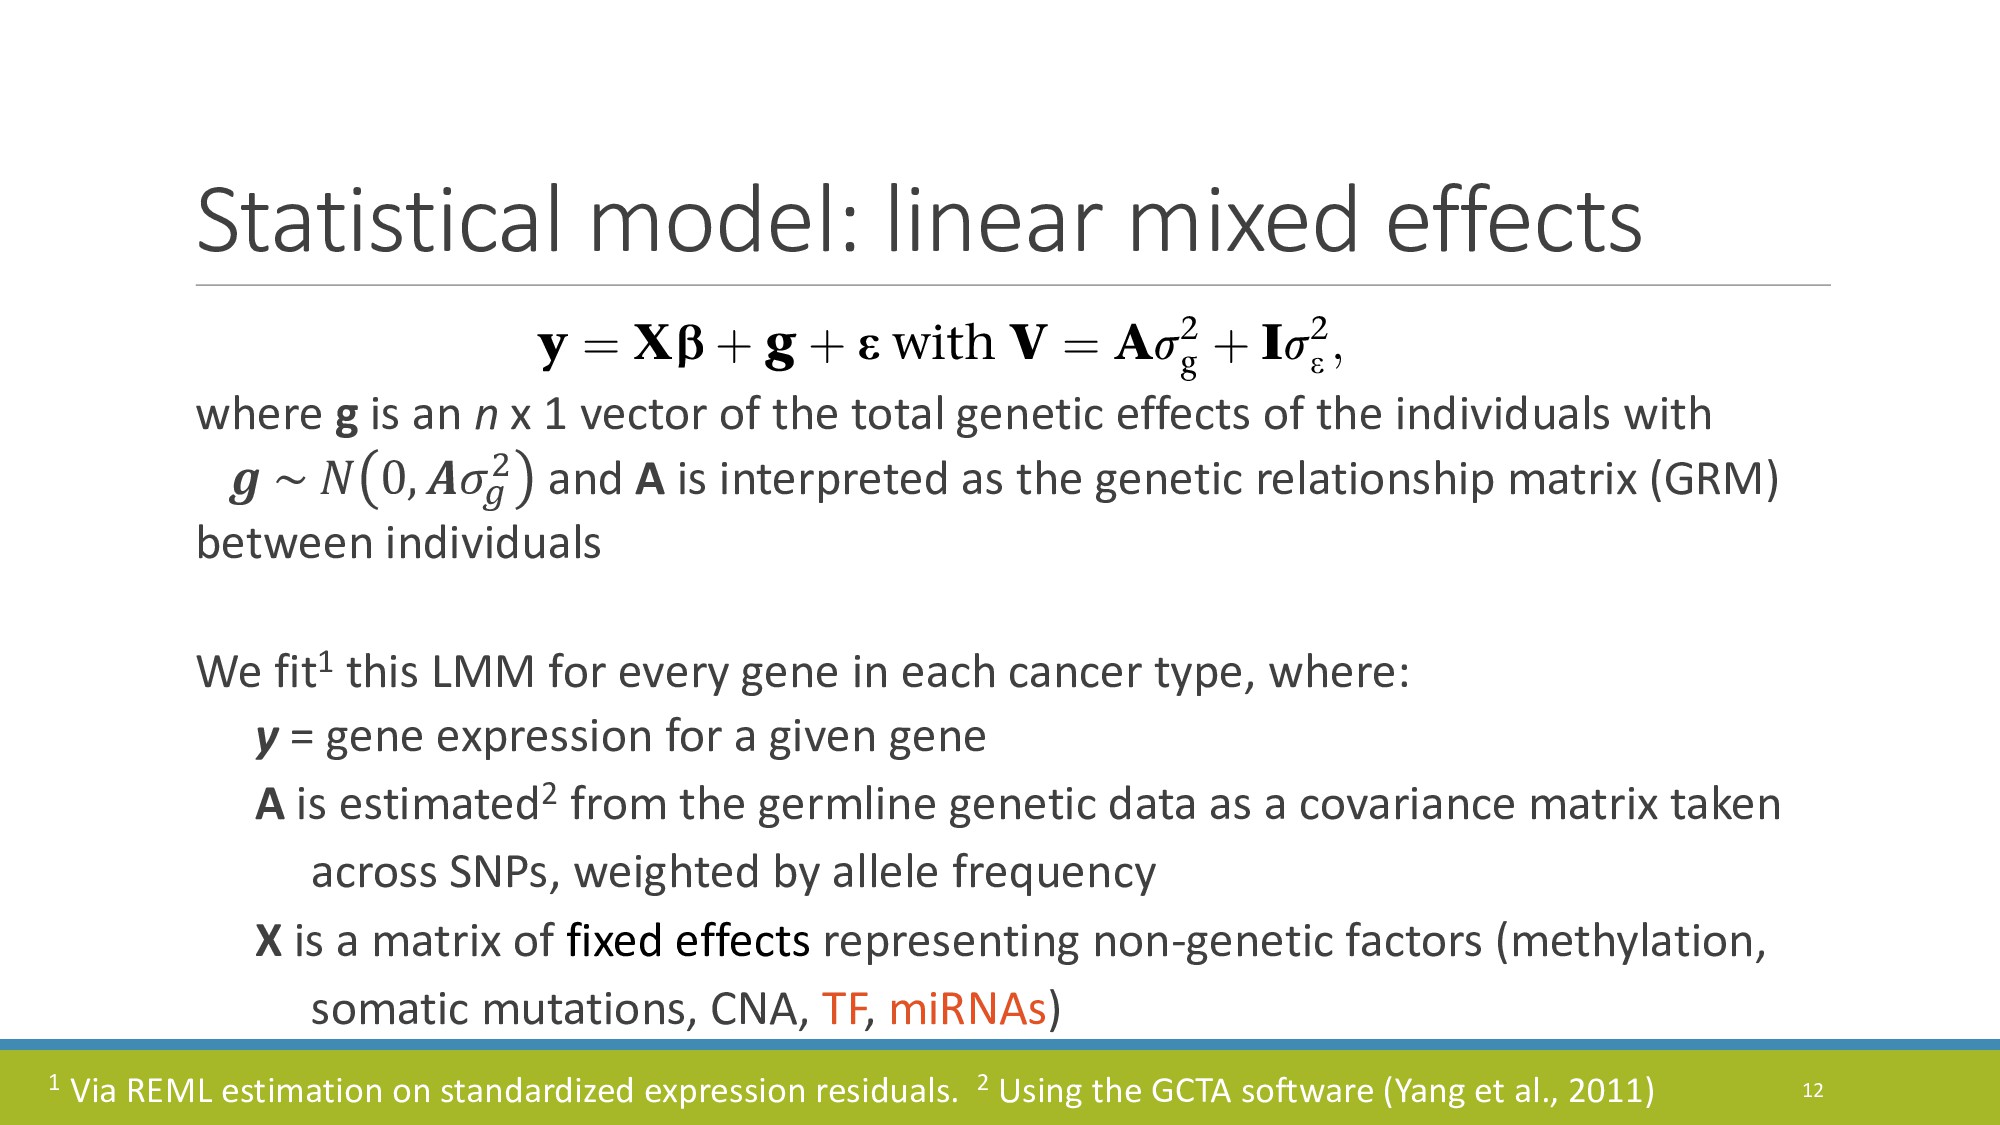
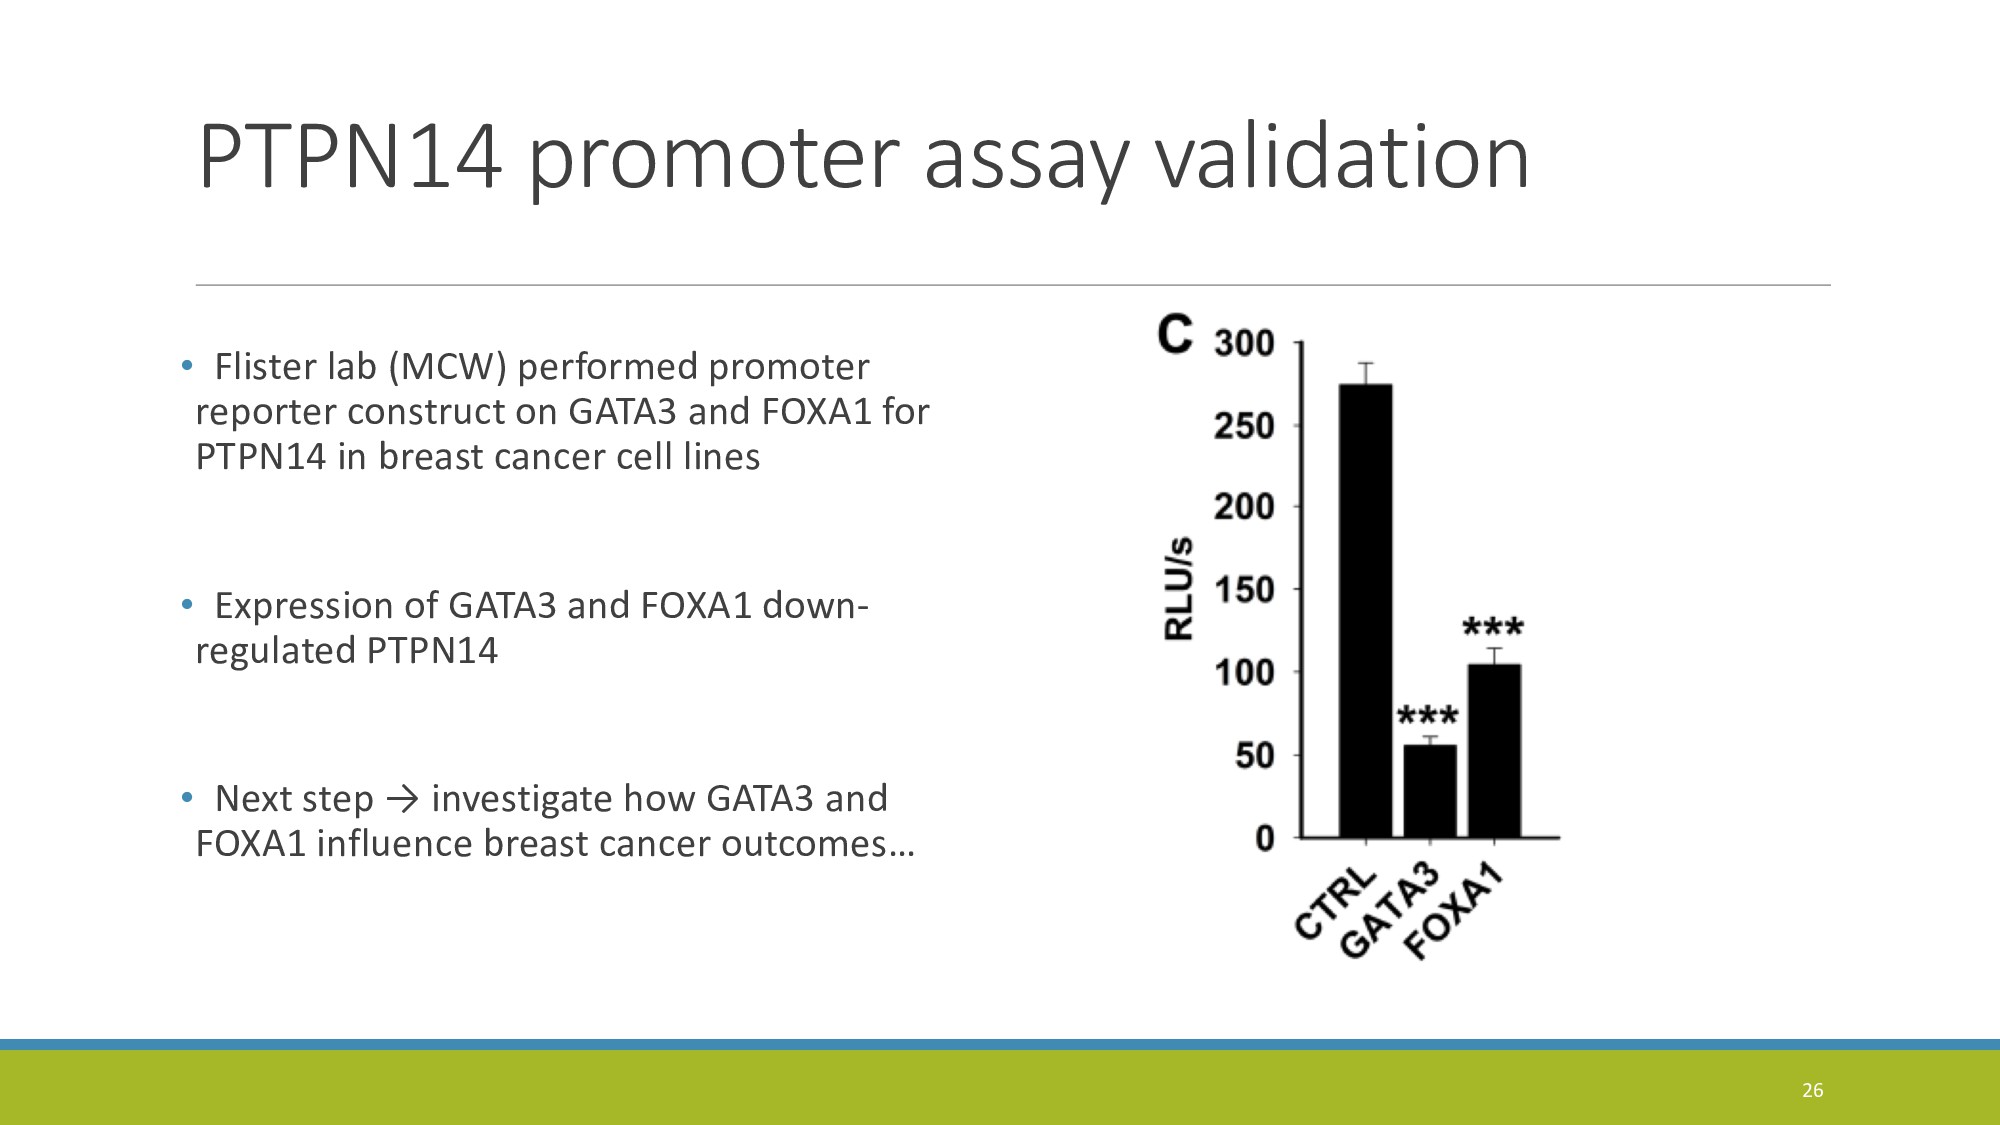
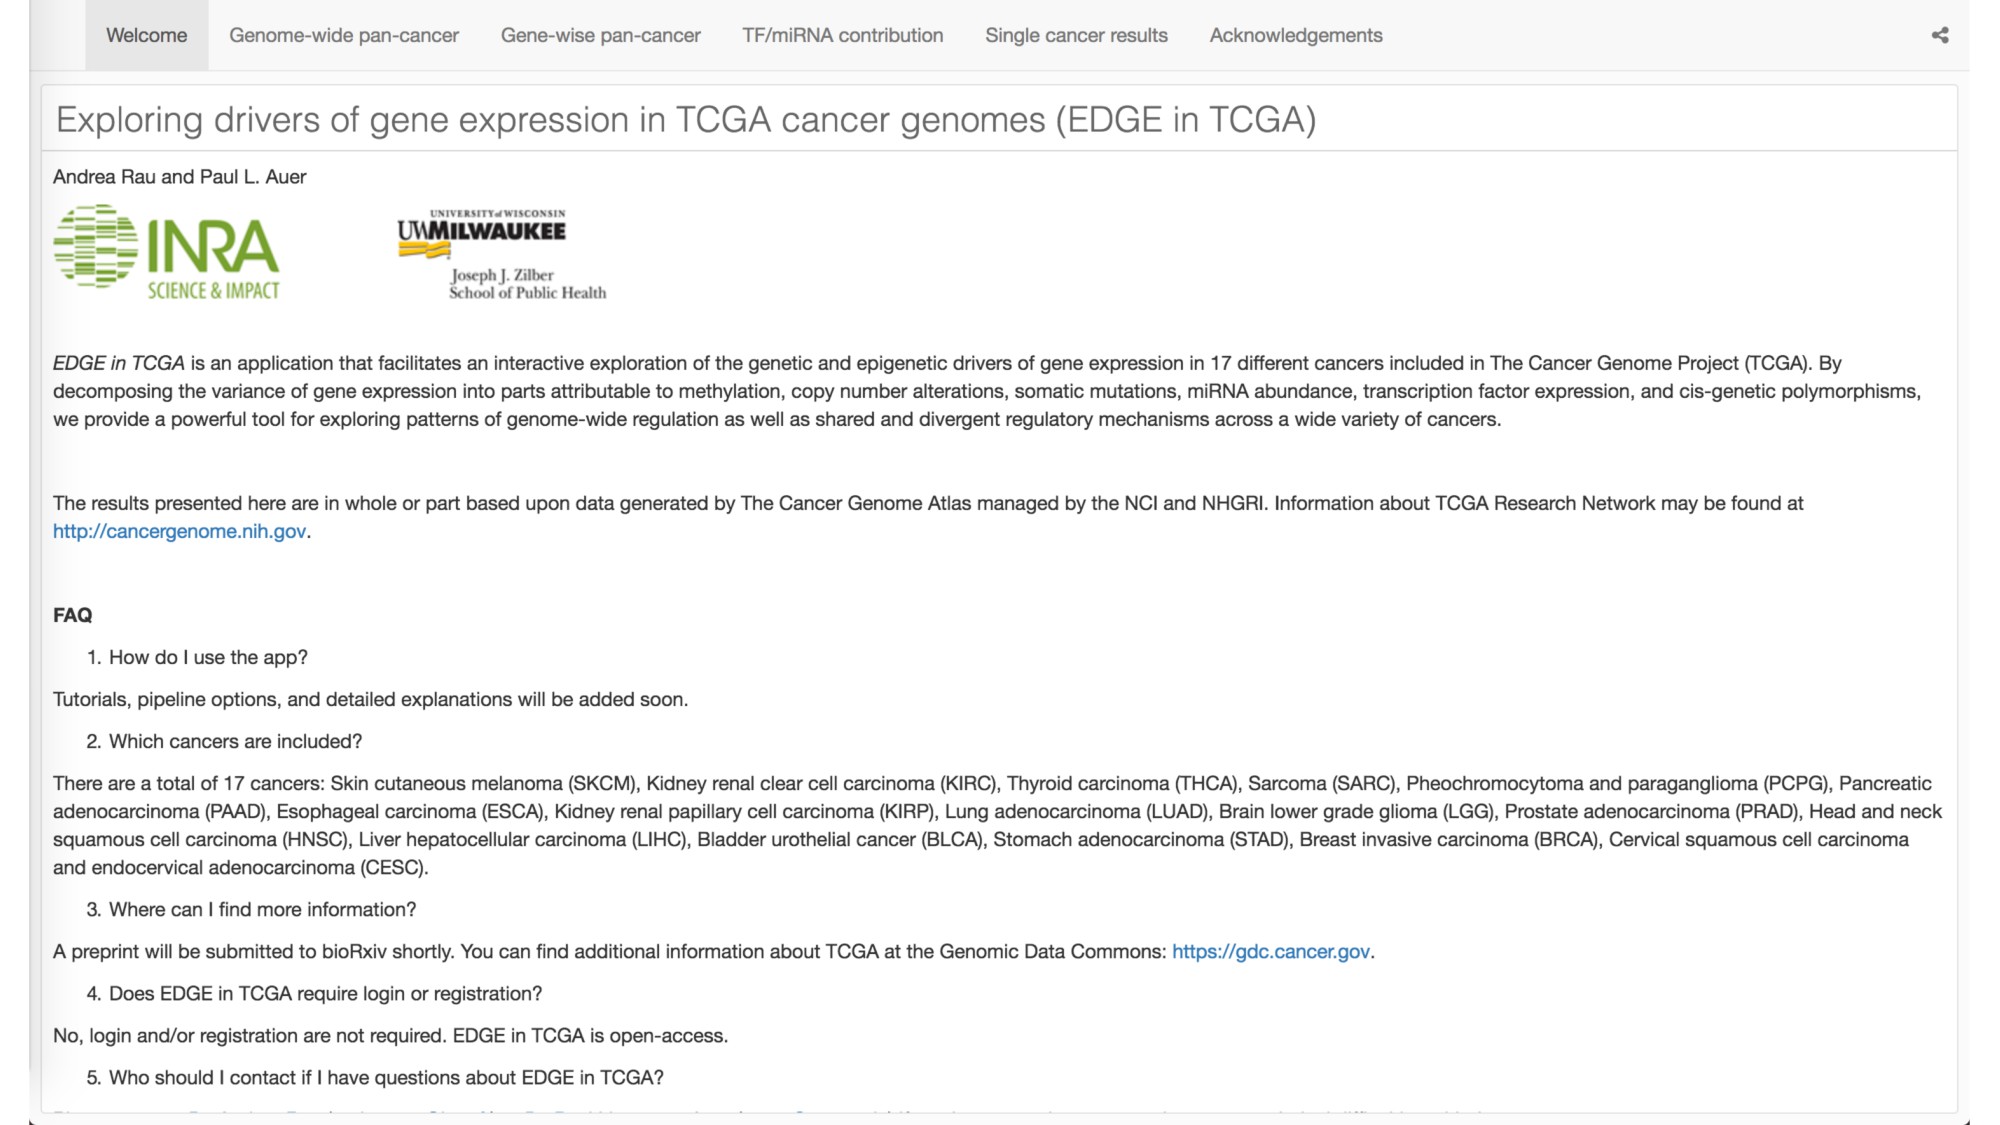
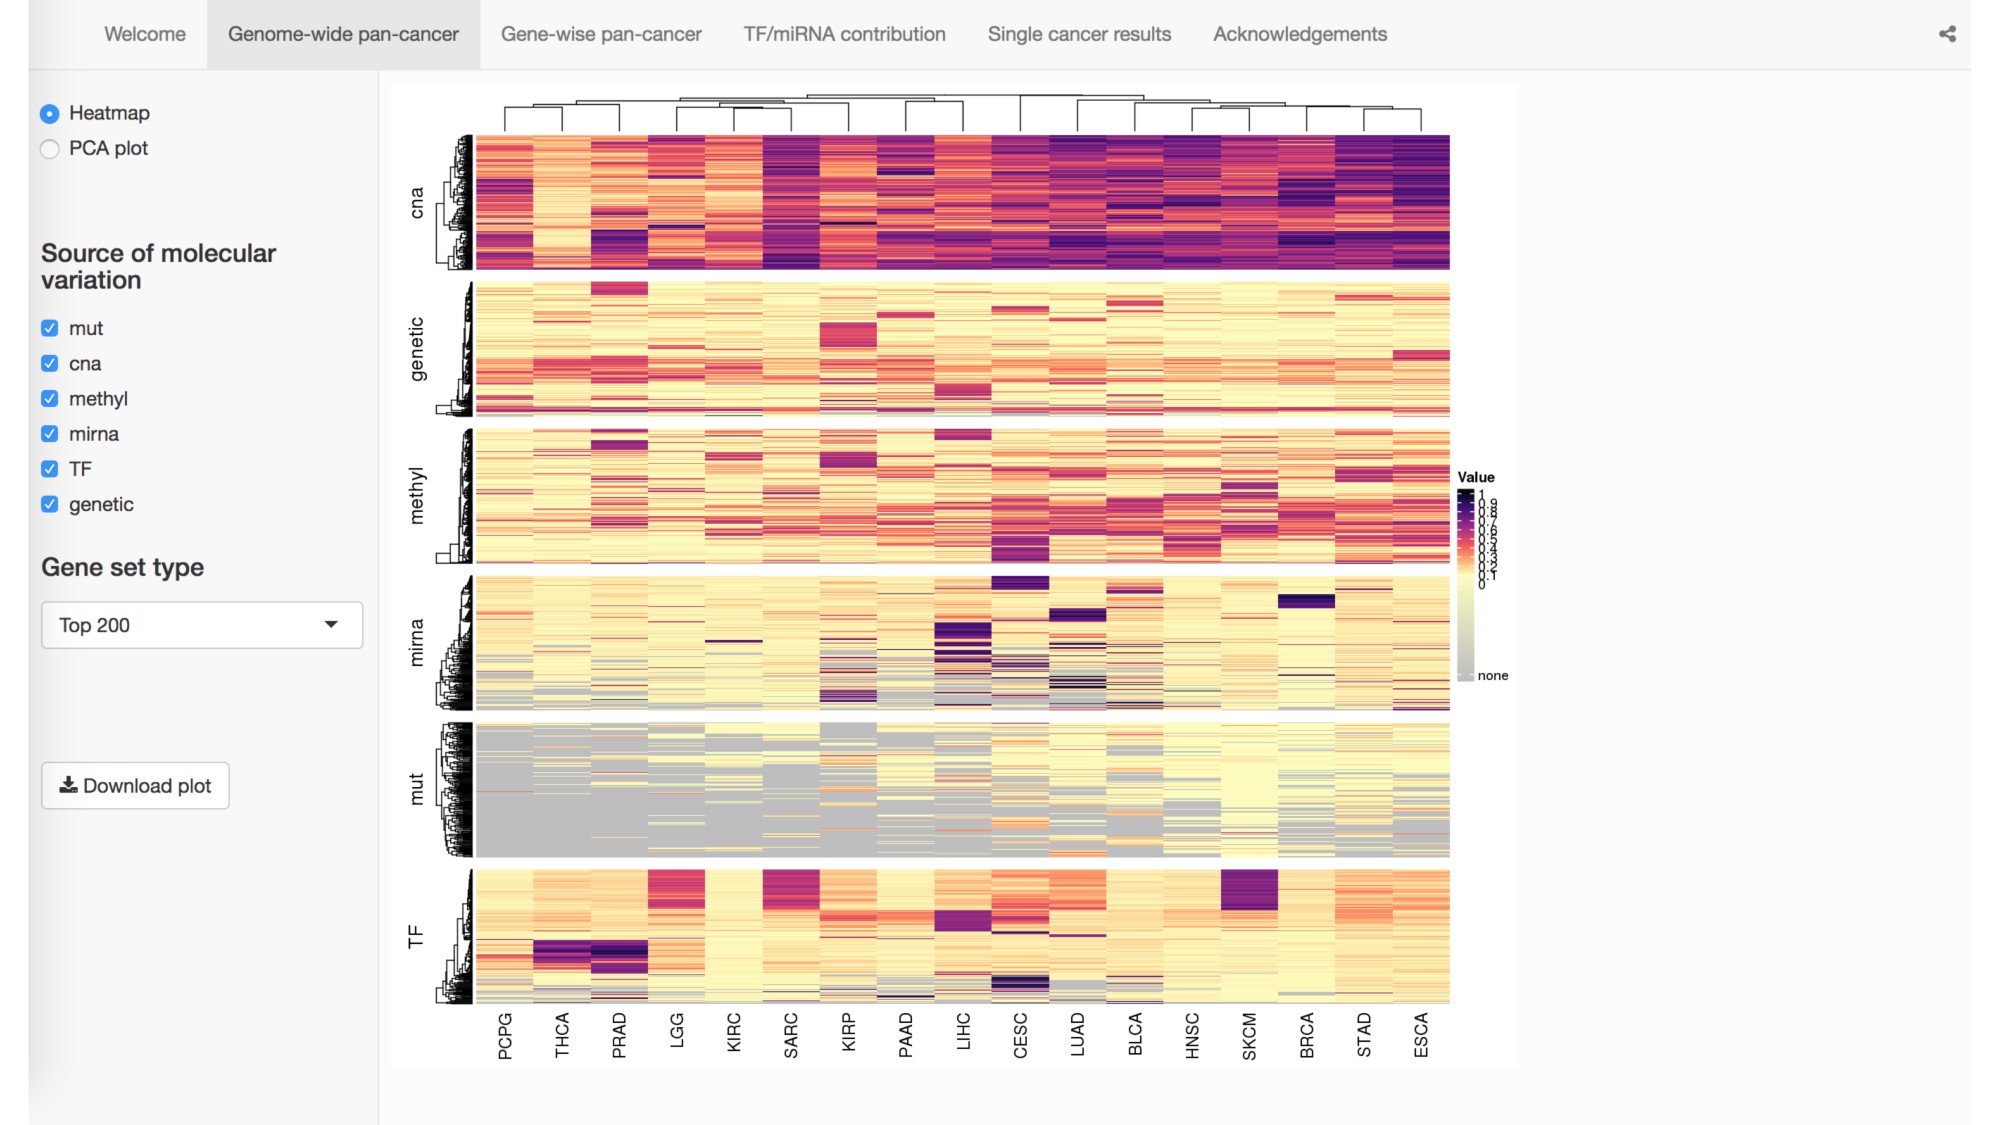
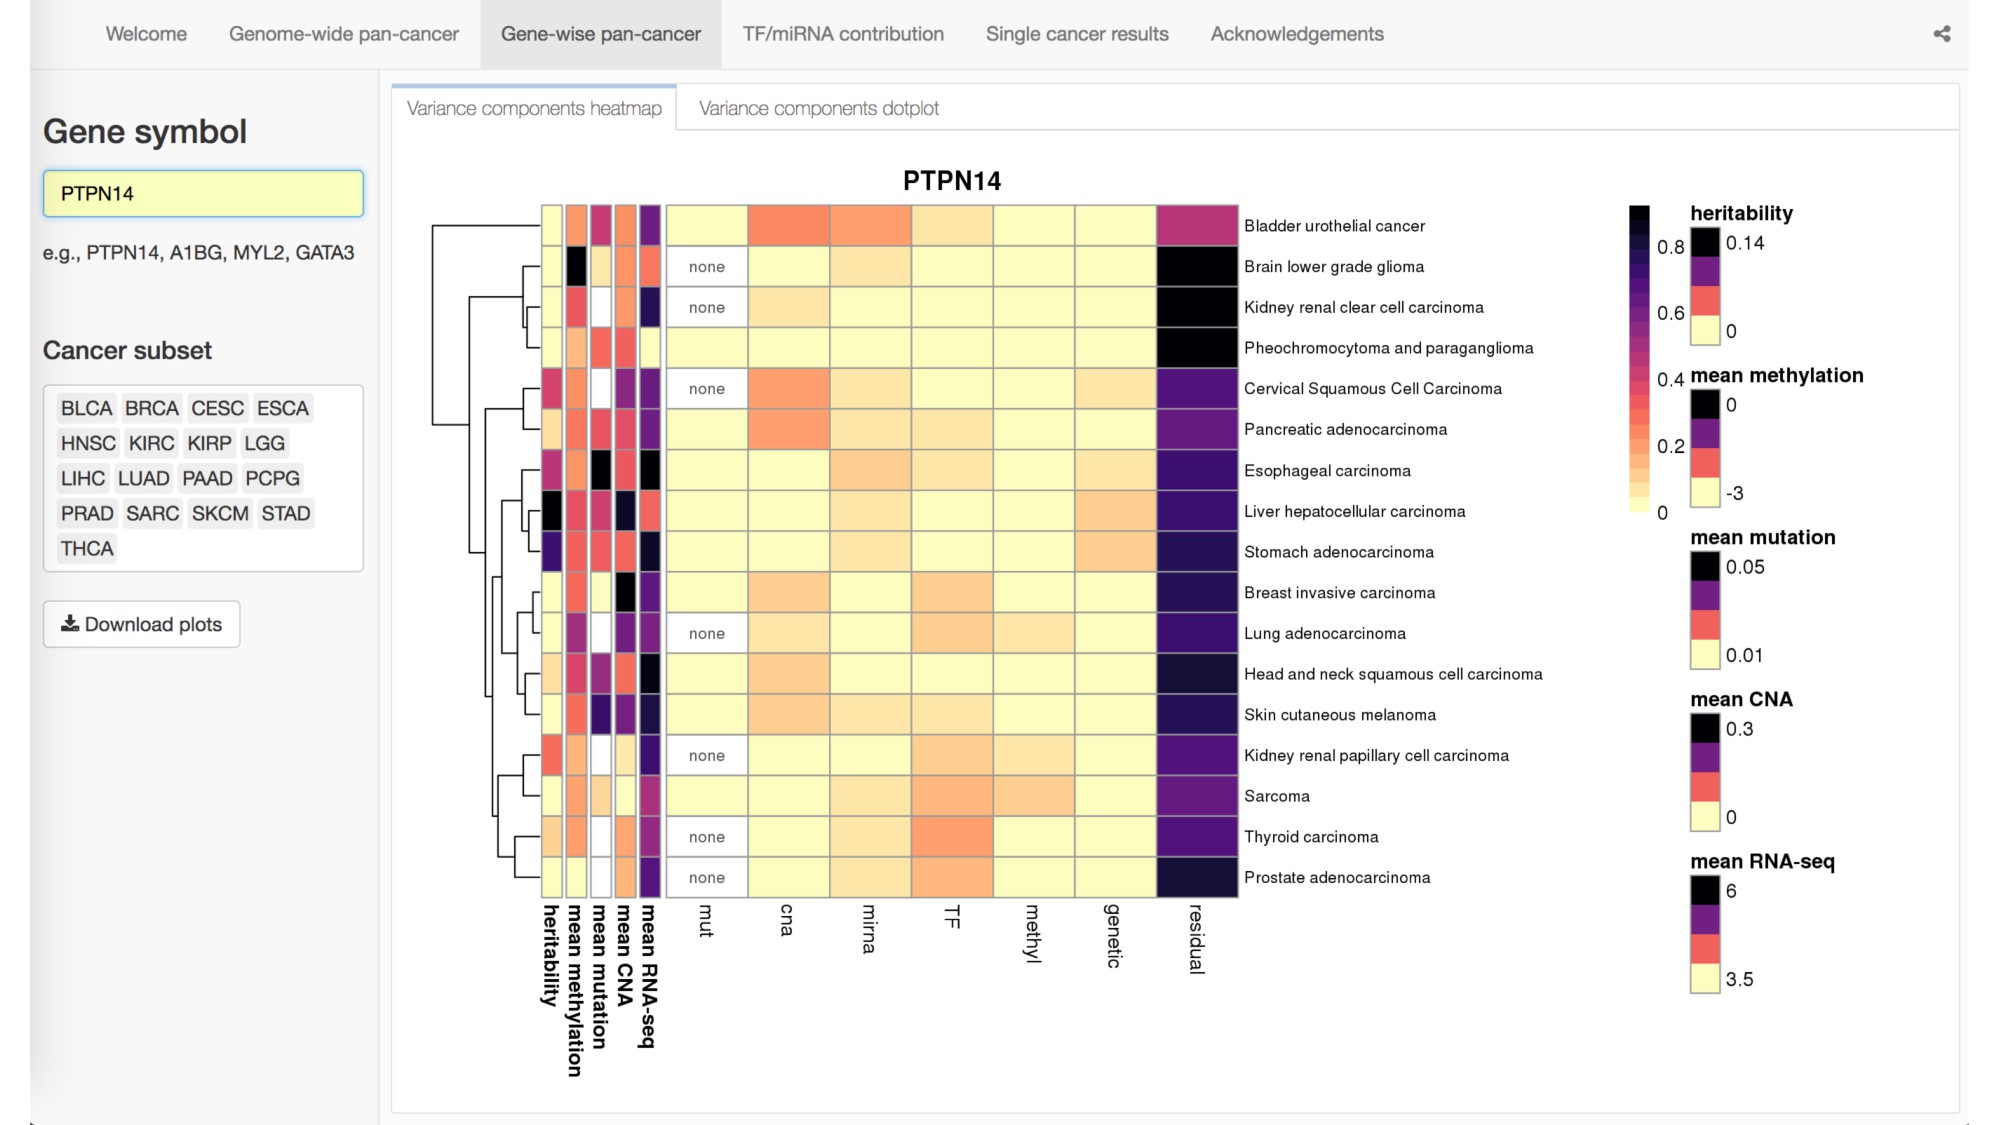
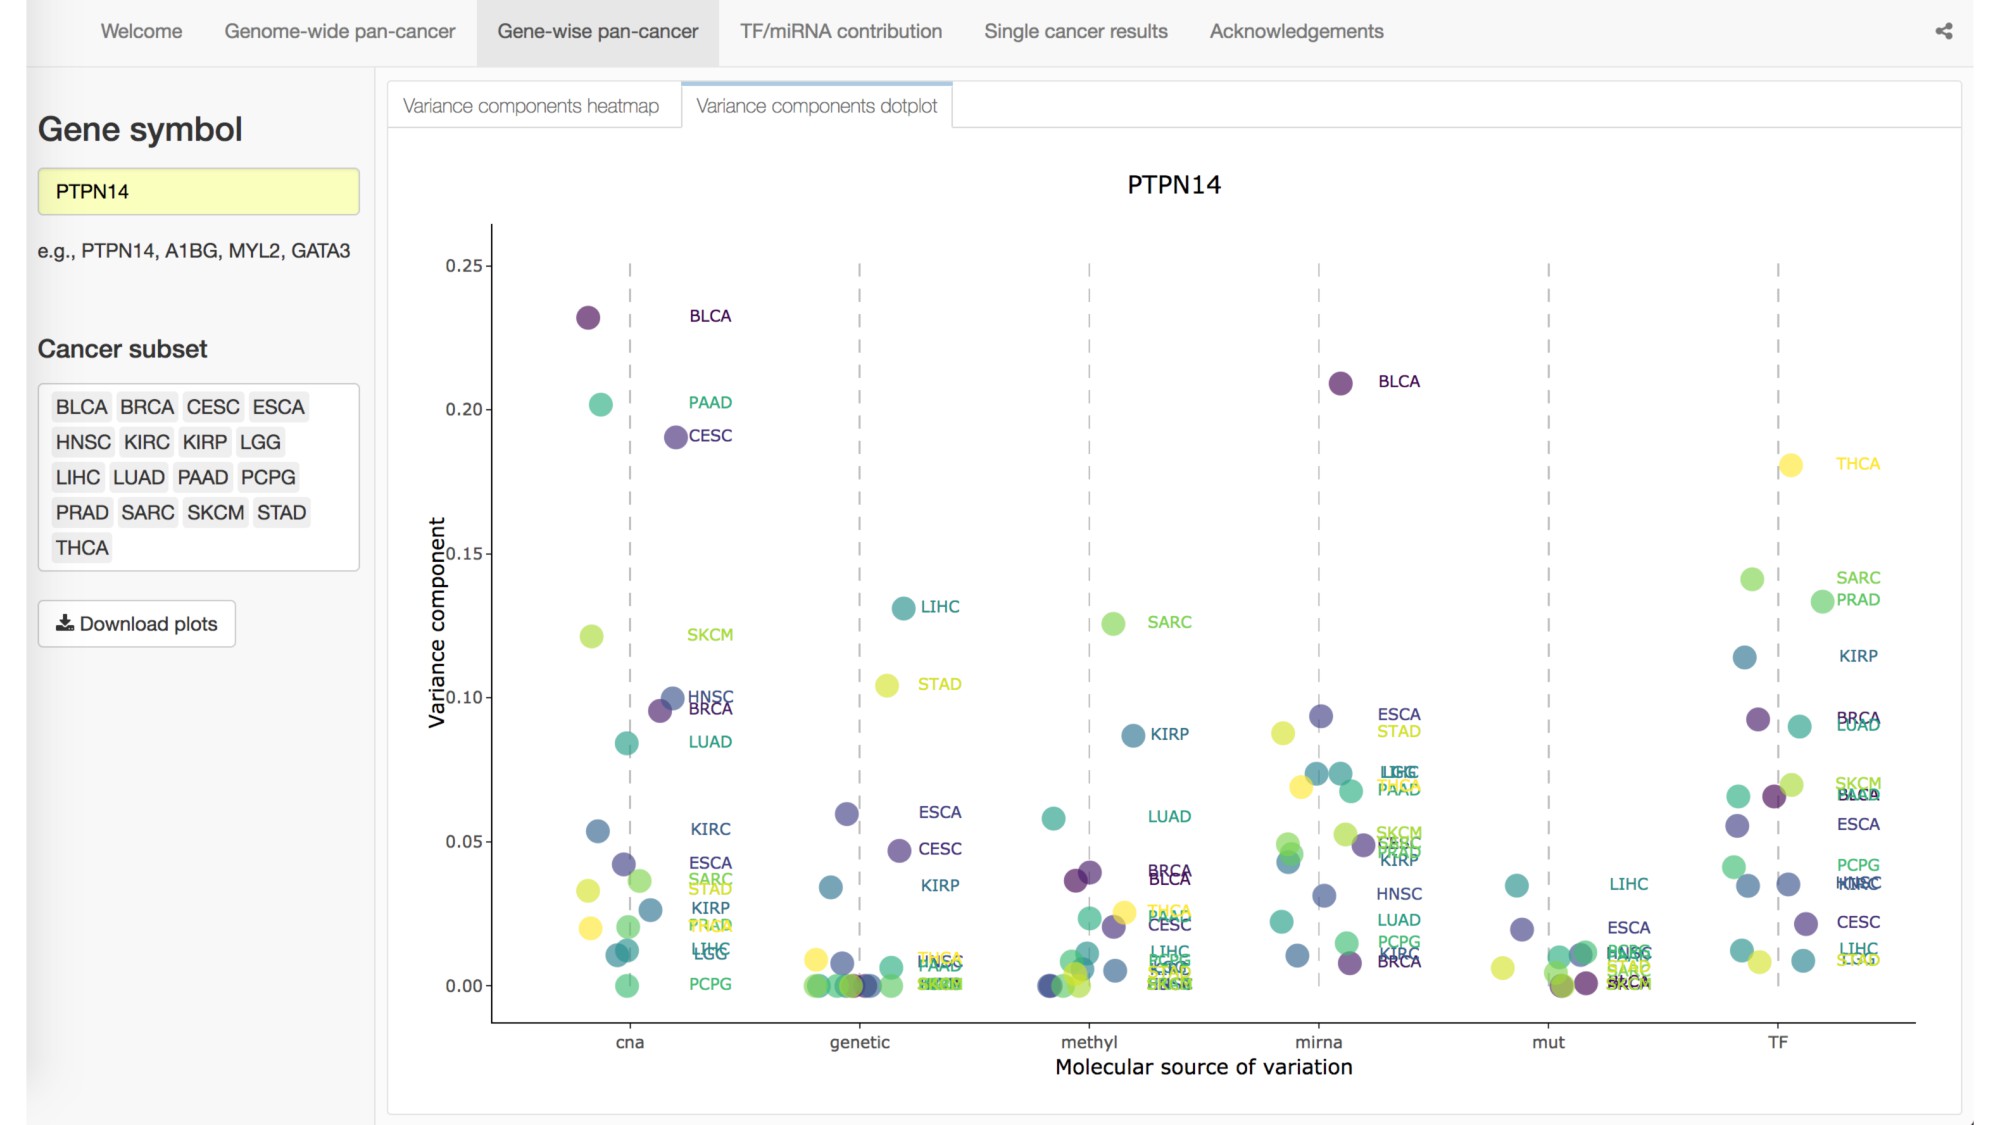
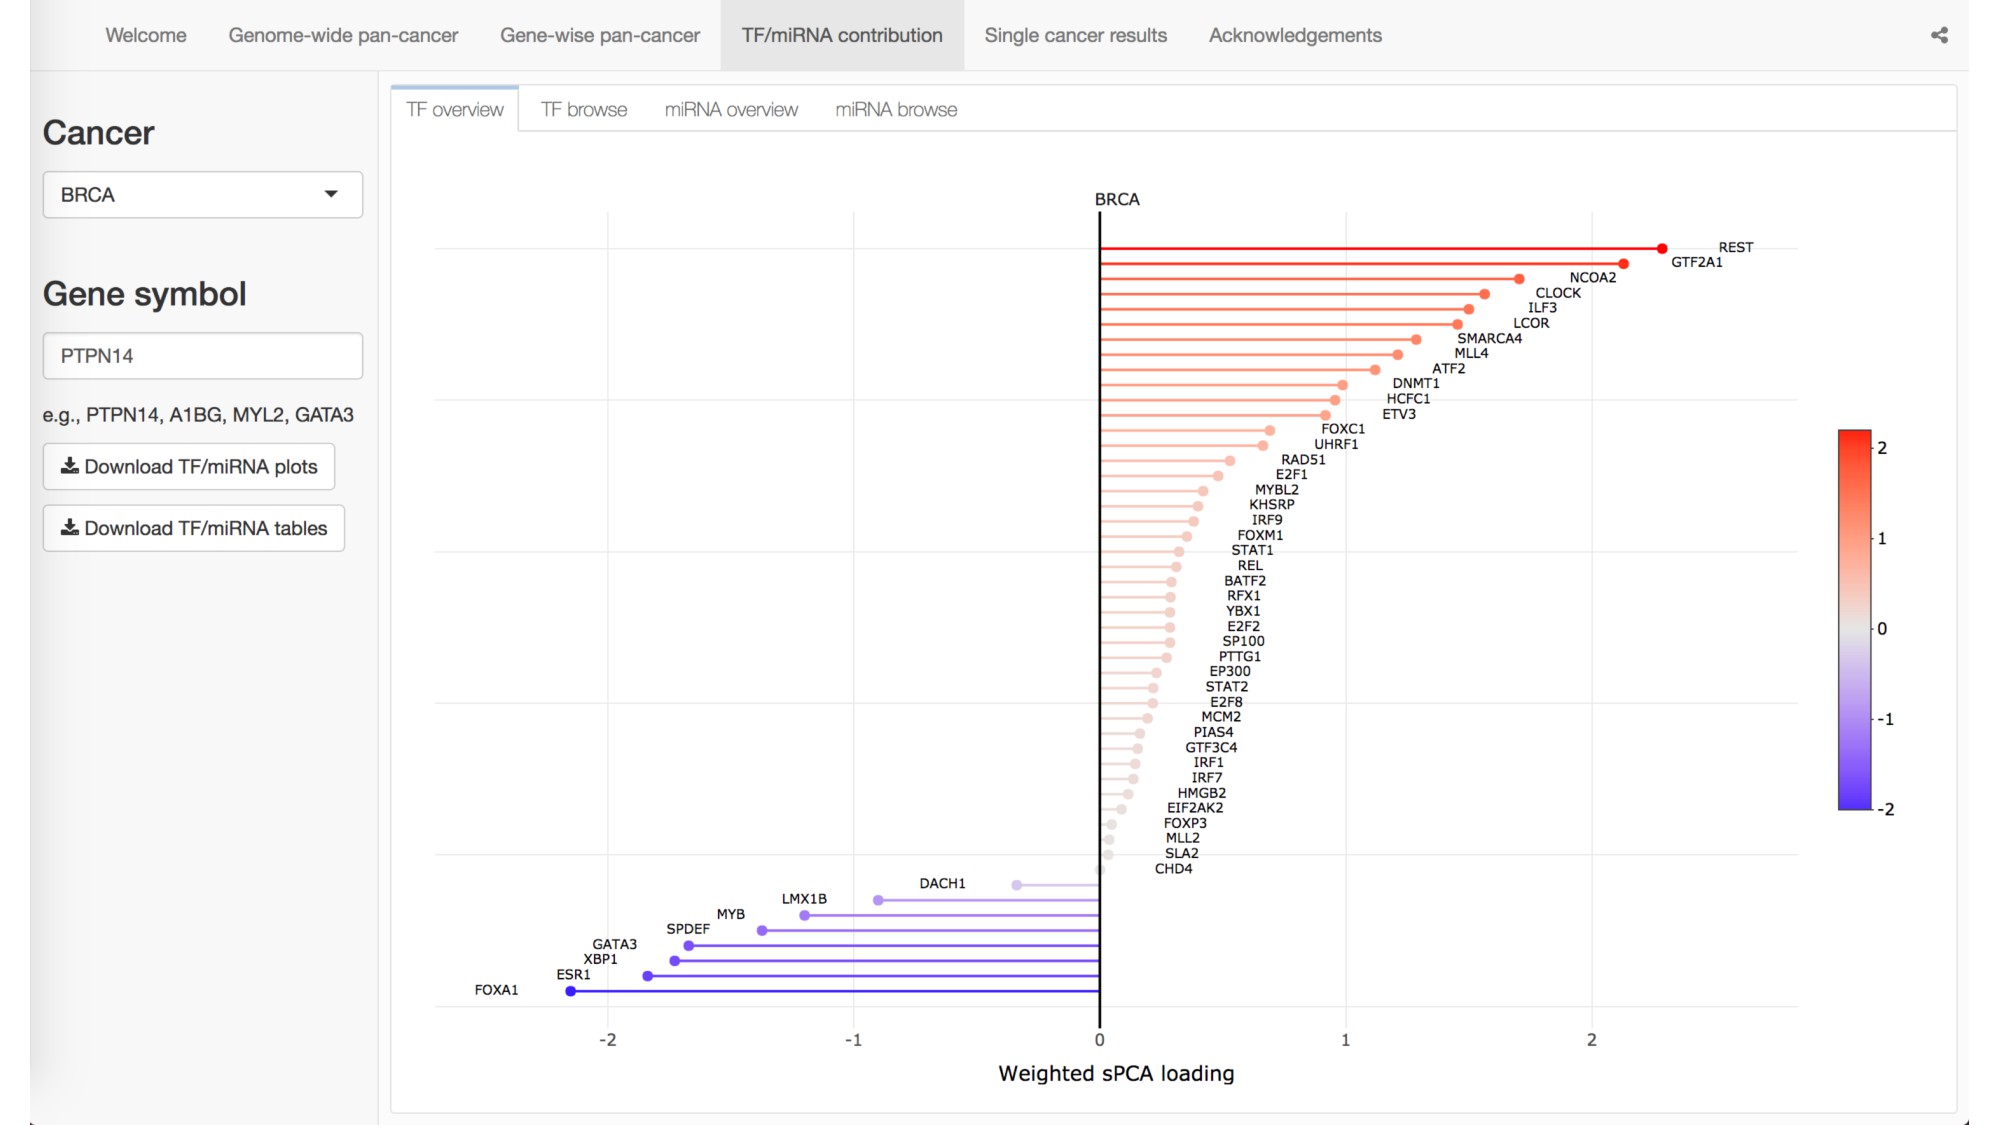
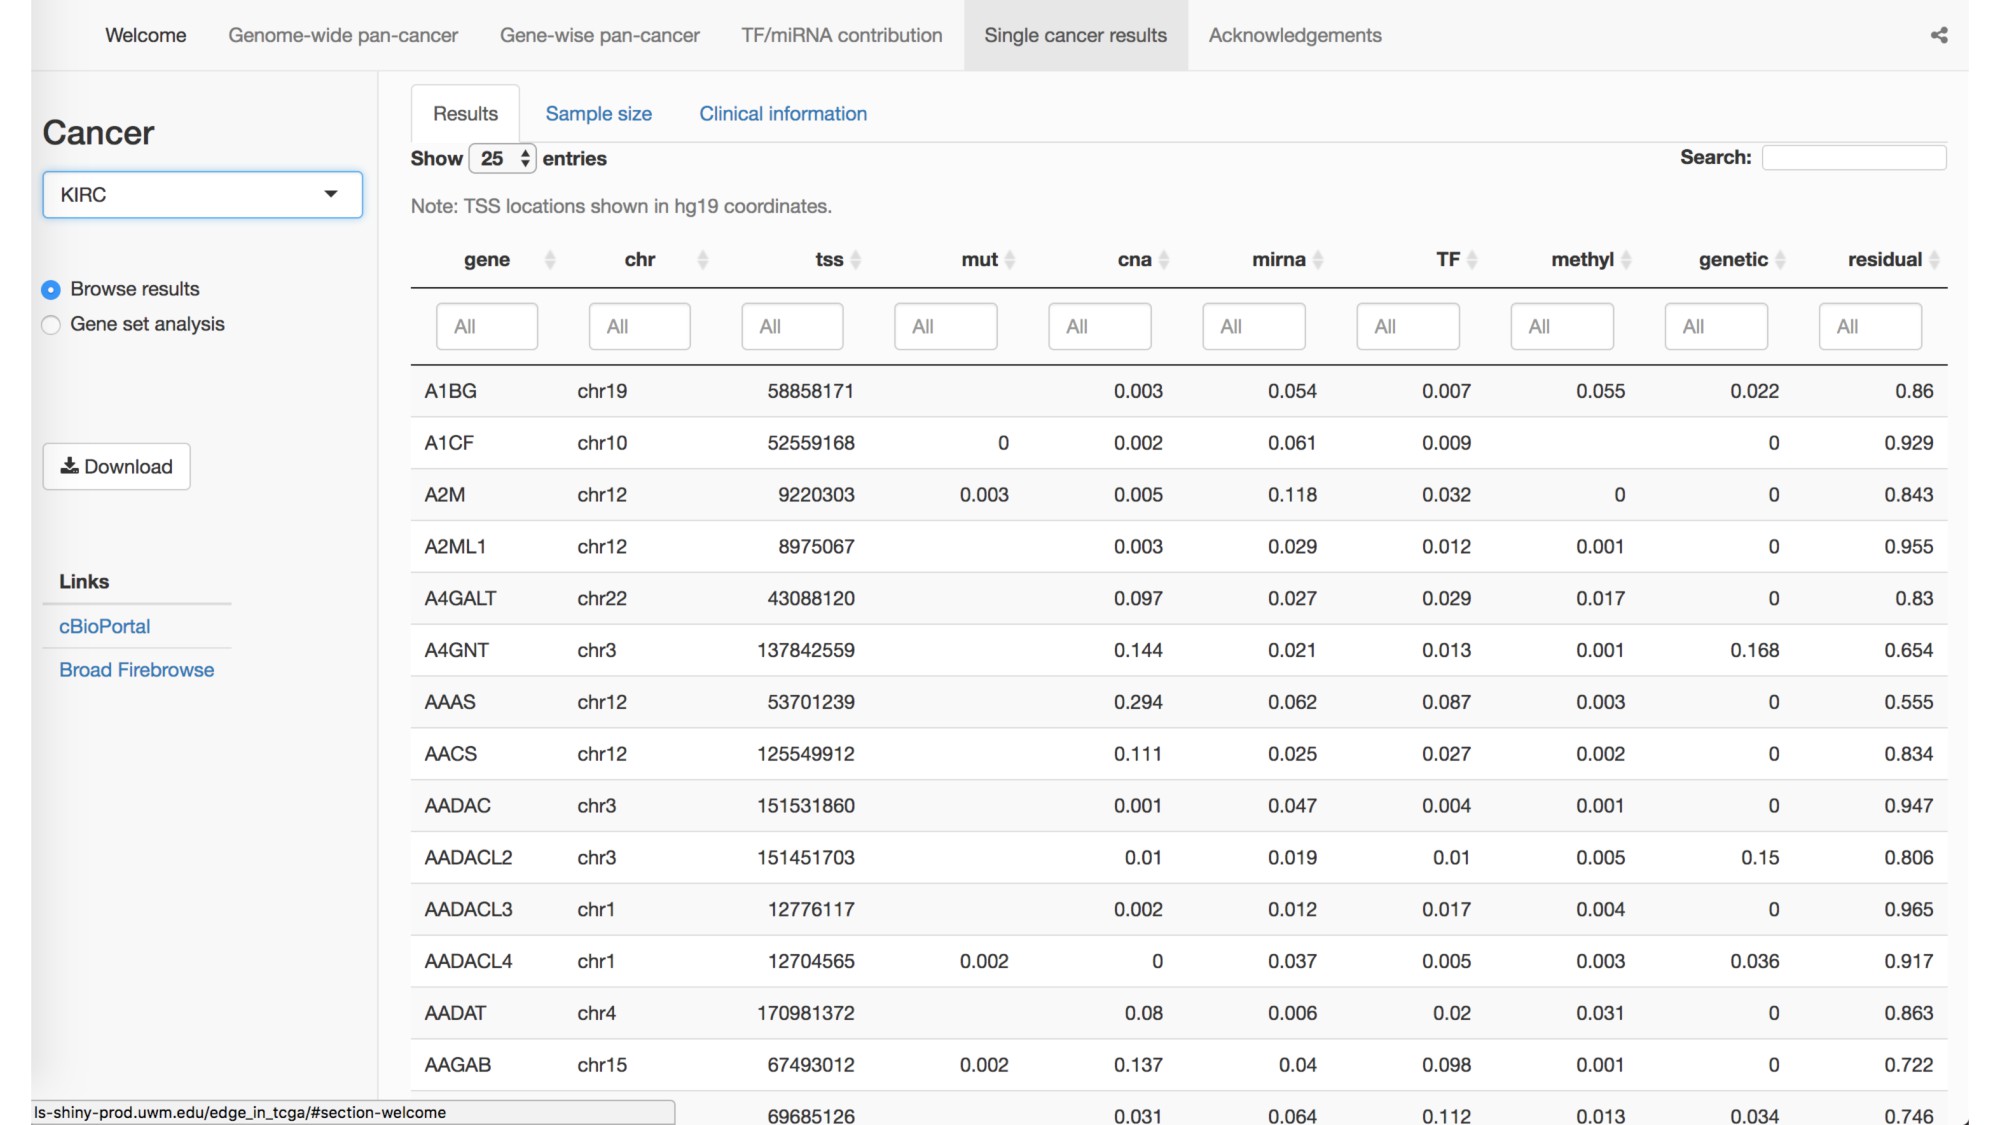
Abstract: The Cancer Genome Atlas (TCGA) has greatly advanced cancer research by generating, curating, and publicly releasing deeply measured molecular data from thousands of tumor samples. In particular, gene expression measures, both within and across cancer types, have been used to determine the genes and proteins that are active in tumor cells. To more thoroughly investigate the behavior of gene expression in TCGA tumor samples, we introduce a statistical framework for partitioning the variation in gene expression due to a variety of molecular variables including somatic mutations, transcription factors (TFs), microRNAs, copy number alternations, methylation, and germ-line genetic variation. As proof-of-principle, we identify and validate specific TFs that influence the expression of PTPN14 in breast cancer cells. We provide a freely available, user-friendly, browseable interactive web-based application for exploring the results of our transcriptome-wide analyses across 17 different cancers in TCGA.

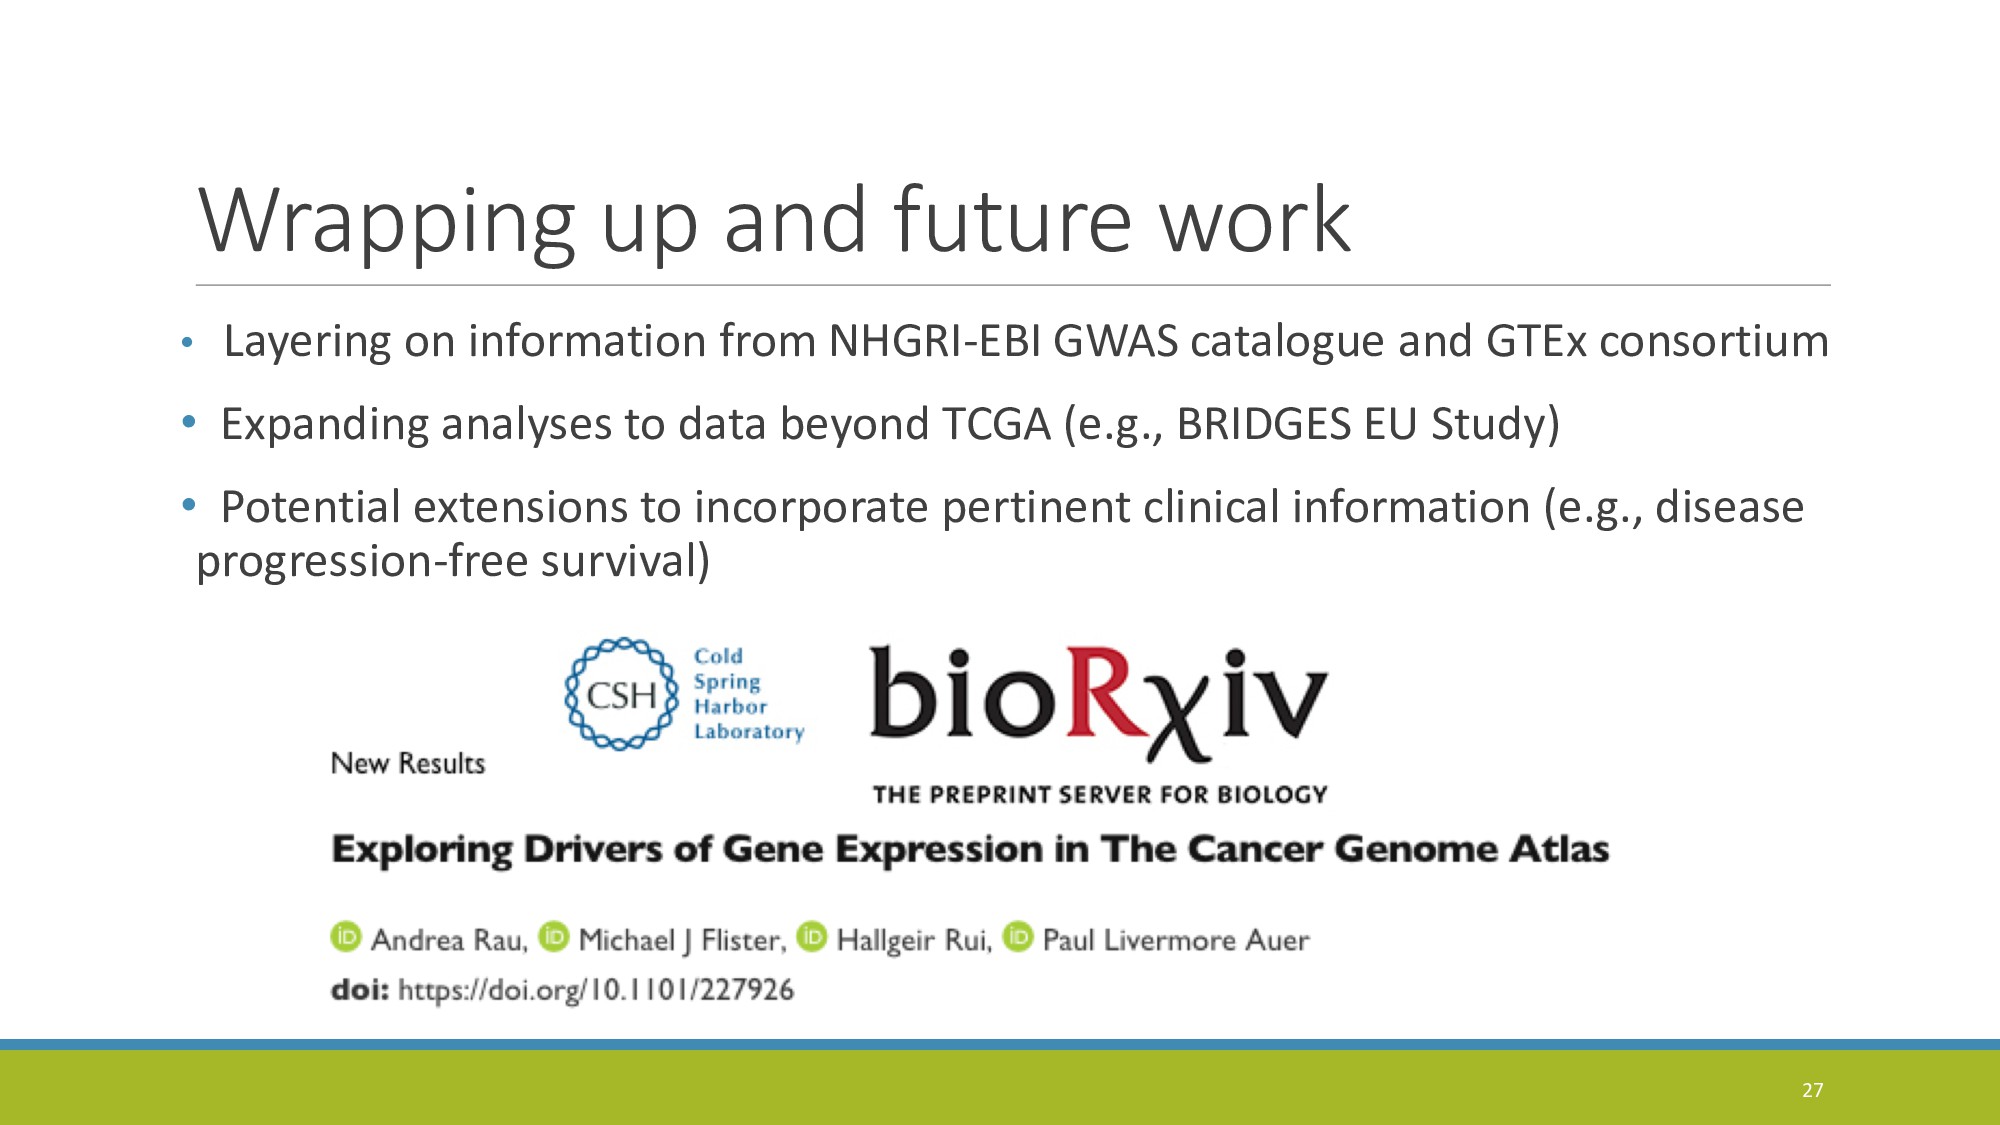
doi: https://doi.org/10.1101/227926

Andrea Rau

March 28, 2018
Tweet

More Decks by Andrea Rau

Other Decks in Science

Transcript

  1. Exploring Drivers of Gene Expression
    in The Cancer Genome Atlas
    ANDR EA R AU, PHD
    PHYSIOLOGY DEPARTM ENT SEM INAR
    M EDICAL COLLEGE OF W ISCONSIN
    M ARCH 28, 2018
    1
    http://www.andrea-rau.com, @andreamrau

    View Slide

  2. The Cancer Genome Atlas (TCGA)
    - Collaboration between the National Cancer Institute (NCI) and National Human Genome
    Research Institute (NHGRI) to accelerate the understanding of the molecular basis of cancer
    - Comprehensive, multi-dimensional maps of key genomic changes in 33 cancer types
    - Publically available data (multi-tiered data depending on patient identifiability)
    - Widely used by the research community (1000+ studies of cancer in publications by TCGA
    research network and independent researchers)
    2
    Diagnose – Treat – Prevent
    2005 2006 2011 2013 2016
    NIH
    launch
    Pilot
    project
    2008
    Glioblastoma
    report
    Ovarian
    cancer report
    Pan-cancer
    analysis
    2014
    10k cases
    complete
    NCI Genomic Data
    Commons opens

    View Slide

  3. 3
    Source: https://cancergenome.nih.gov/abouttcga

    View Slide

  4. 4
    Source: https://cancergenome.nih.gov/abouttcga
    Ø Basal-like subtype of breast cancer is molecularly similar to the
    serous subype of ovarian cancer, suggesting a common path of
    development and similar response to therapeutic strategies
    (TCGA Network et al., 2012)
    Ø Stomach cancer is made up of four subtypes, including one
    characterized by infection with Epstein-Barr virus
    (TCGA Network et al., 2014)
    Ø Identification of targetable genomic alterations in lung
    squamous cell carcinoma led to NCI’s Lung-Map Trial
    (TCGA Network et al., 2012)

    View Slide

  5. Gene expression in cancer
    • Cancer results from a gene not normally expressed in a cell being switched on and expressed at
    high levels due to mutations or alterations in gene regulation
    • Epigenetic, transcription, post-transcription, translation, post-translation, …
    • Tumor suppressor genes: active in normal cells to prevent uncontrolled cell growth (e.g. p53)
    • Oncogenes: overexpression can lead to uncontrolled cell growth (e.g. MYC)
    • Gene expression profiling often used to accurately classify tumors
    • Studying how to control transcriptional activation of gene expression in cancer can potentially
    lead to new therapeutic treatments for cancer
    5

    View Slide

  6. 6
    Gene expression
    TTTGCA
    AAACGT
    TF
    Transcription factor expression
    Copy number alterations
    Transcriptional regulation in cancer genomes
    Promoter methylation
    microRNA expression
    …GCAGCGTTCGA…
    …GCAACGTTAGA…
    Somatic mutations within tumors,
    Germline genetic variation

    View Slide

  7. Our big question
    How is gene expression influenced by other
    genomic & epigenomic mechanisms in
    cancer genomes?
    Does a TCGA pan-cancer analysis reveal patterns
    among subsets of cancer types?
    7

    View Slide

  8. Inferring global transcriptional regulation
    in cancers using TCGA

    Jiang et al. (2015) used TCGA gene expression data and ChIP-Seq data from
    ENCODE on 150 transcription factor profiles to search for cancer-associated TFs

    Analyzed data across genes
    within each sample
    to determine if TF targets were
    significantly up- or down-regulated (after adjusting for confounding factors)
    8
    TCGA-A3FO TCGA-A2MZ TCGA-A8JD
    gene 1
    .
    .
    .
    .
    gene 20,000
    Image source: Figure 2 from Jiang et al. (2015)

    View Slide

  9. Inferring drivers of expression at the
    gene-level using TCGA
    • Here, rather than fixing each sample and analyzing across genes,
    we aimed to make inferences specific to each gene
    • Motivating question: for a specific gene in a specific cancer type,
    what are the relative molecular drivers of its expression?
    9
    TCGA-A3FO TCGA-A2MZ TCGA-A8JD
    gene 1
    .
    .
    .
    .
    gene 20,000

    View Slide

  10. 10
    Gene expression
    TTTGCA
    AAACGT
    TF
    Transcription factor expression
    Copy number alterations
    TCGA Data Sources
    Promoter methylation
    microRNA expression
    …GCAGCGTTCGA…
    …GCAACGTTAGA…
    Somatic mutations within tumors,
    Germline genetic variation
    RNA-seq
    (tumor)
    miRNA-seq
    (tumor)
    RNA-seq as
    proxy (tumor)
    Exome sequencing (presence of
    nonsynonymous mutations, tumor)
    Illumina methylation
    arrays (tumor)
    Affymetrix 6.0
    genotyping arrays
    (tumor vs normal)
    Affymetrix 6.0 genotyping
    arrays (normal)

    View Slide

  11. Cancers in TCGA with all requisite data
    Cancer (sample size)
    Breast invasive carcinoma (506): BRCA Head and neck squamous cell carcinoma (245):HNSC
    Brain lower grade glioma (262): LGG Skin cutaneous melanoma (320): SKCM
    Thyroid carcinoma (265): THCA Sarcoma (210): SARC
    Pheochromoctyoma and paraganglioma (144): PCPG Lung adenocarcinoma (144): LUAD
    Esophageal carcinoma (113): ESCA Bladder urothelial cancer (109): BLCA
    Liver hepatocellular carcinoma (110): LIHC Kidney renal clear cell carcinoma (228): KIRC
    Pancreatic adenocarcinoma (131): PAAD Kidney renal papillary cell carcinoma (95): KIRP
    Stomach adenocarcinoma (138): STAD Prostate adenocarcinoma (132): PRAD
    Cervical squamous cell carcinoma (136): CESC
    11
    Note: analyses restricted to the largest population, individuals of self-reported European ancestry.
    Central nervous
    system
    Breast
    Endocrine
    system
    Gastro-
    intestinal
    Gynecologic
    Head and neck
    Skin
    Soft tissue
    Thoracic
    Urologic

    View Slide

  12. Statistical model: linear mixed effects
    where g is an n x 1 vector of the total genetic effects of the individuals with
    ! ~ # 0, &'(
    )
    and A is interpreted as the genetic relationship matrix (GRM)
    between individuals
    We fit1 this LMM for every gene in each cancer type, where:
    y = gene expression for a given gene
    A is estimated2 from the germline genetic data as a covariance matrix taken
    across SNPs, weighted by allele frequency
    X is a matrix of fixed effects representing non-genetic factors (methylation,
    somatic mutations, CNA, TF, miRNAs)
    12
    s: data management, estimation of the genetic relationships from SNPs, mixed linear
    Ps, estimation of the linkage disequilibrium structure, and GWAS simulation. We focus
    plained by all the SNPs on the X chromosome and testing the hypotheses of dosage
    e tool to estimate and partition complex trait variation with large GWAS data sets.
    wide association
    undreds of SNPs
    uman complex
    cture of human
    lained. For most
    y explain a small
    s not been any
    ing heritability.’’
    mber of common
    ith large effects,
    ntly proposed a
    t of phenotypic
    y ¼ Xb þ g þ 3 with V ¼ As2
    g
    þ Is2
    3
    ; (Equation 2)
    where g is an n 3 1 vector of the total genetic effects of the
    individuals with g $ Nð0; As2
    g
    Þ, and A is interpreted as the
    genetic relationship matrix (GRM) between individuals.
    We can therefore estimate s2
    g
    by the restricted maximum
    likelihood (REML) approach,10 relying on the GRM esti-
    mated from all the SNPs. Here we report a versatile tool
    called genome-wide complex trait analysis (GCTA), which
    implements the method of estimating variance explained
    by all SNPs, and extend the method to partition the genetic
    variance onto each of the chromosomes and also to esti-
    1 Via REML estimation on standardized expression residuals. 2 Using the GCTA software (Yang et al., 2011)

    View Slide

  13. TF and miRNA target genes
    - Expression measures available:
    ◦ ~850 TFs (combined list from IPA and TRRUST databases)
    ◦ ~800 miRNAs
    - TFs and miRNAs each potentially target multiple genes, each
    gene is potentially targeted by multiple TFs/miRNAs
    ◦Definitive mapping is unknown!
    - Many available methods / databases for predicted TF-target and
    miRNA-target pairs (via text-mining, bioinformatics approaches …)
    13

    View Slide

  14. Sparse representation of TF & miRNA effects
    • Primary goal: infer relative contribution of molecular drivers of gene expression by
    estimating the proportion of variance explained
    • Secondary goal: identify specific TFs / miRNAs influencing expression for a specific gene
    • Obstacles for our work:
    • Too many TFs and miRNAs to include all of them (p >> n problem)
    • Even if we could, a potential list of hundreds of TFs is not helpful…
    • TFs and miRNAs that target a specific gene are not definitely known
    • Solution: sparse Principal Component representation of TFs / miRNAs
    14
    Dimension reduction + enhanced interpretability!

    View Slide

  15. Sparse Principal Component Analysis (sPCA)
    • Principal components = linear combinations of original variables accounting for
    the most possible variability:
    ! = #$
    %$
    + #'
    %'
    … + #)
    %)
    Large weights (loadings) = important contribution to the PC. When large number of (potentially
    irrelevant) variables, interpretation can be difficult…
    • Sparse PCA = variable weights set to 0 for irrelevant variables:
    ! = * ∗ %$
    + #'
    %'
    … + 0 * %)
    15
    Image courtesy of Kim Anh Lê Cao (https://www.slideshare.net/AustralianBioinformatics/tuesday-session-8kimanhlecao1)
    mixOmics R package

    View Slide

  16. Sparse Principal Component Analysis (sPCA)
    • TFs and miRNAs with non-zero sPCA loadings correspond to those that
    contribute most to variation in overall TF / miRNA expression
    • Number of non-zero loadings in each sPC must be chosen by user ↦ 10
    • Select first 5 (uncorrelated) sPCs for both TF and miRNA
    data for inclusion in the X matrix of fixed effects
    16

    View Slide

  17. Back to the model: Quantities of interest
    • Heritability in gene expression: Price et al. (2011) and Gamazon et al. (2015)
    V = Var(y) = Var(genetic) + Var(residual)
    Heritability = Var(genetic)/Var(y) =
    !"
    #
    !$
    #
    • Contribution to overall variance by the fixed effects:
    %&'()*
    +): essentially a corrected R2 metric for LMMs Nakagawa & Schlielzeth (2013)
    • This “partitioning” of variance provides us with estimates for the
    relative contribution of each component on gene expression
    17
    s: data management, estimation of the genetic relationships from SNPs, mixed linear
    Ps, estimation of the linkage disequilibrium structure, and GWAS simulation. We focus
    plained by all the SNPs on the X chromosome and testing the hypotheses of dosage
    e tool to estimate and partition complex trait variation with large GWAS data sets.
    wide association
    undreds of SNPs
    uman complex
    cture of human
    lained. For most
    y explain a small
    s not been any
    ing heritability.’’
    mber of common
    ith large effects,
    ntly proposed a
    t of phenotypic
    y ¼ Xb þ g þ 3 with V ¼ As2
    g
    þ Is2
    3
    ; (Equation 2)
    where g is an n 3 1 vector of the total genetic effects of the
    individuals with g $ Nð0; As2
    g
    Þ, and A is interpreted as the
    genetic relationship matrix (GRM) between individuals.
    We can therefore estimate s2
    g
    by the restricted maximum
    likelihood (REML) approach,10 relying on the GRM esti-
    mated from all the SNPs. Here we report a versatile tool
    called genome-wide complex trait analysis (GCTA), which
    implements the method of estimating variance explained
    by all SNPs, and extend the method to partition the genetic
    variance onto each of the chromosomes and also to esti-

    View Slide

  18. Pan-cancer trends in expression drivers
    • CNAs represent most consistent driver of expression
    üCorresponds to previous reports of relative importance of aneuploidy versus
    somatic mutations or germline polymorphisms
    • PRAD and KIRP have highest number of genes with large germline
    genetic drivers of expression
    • LUAD and LIHC have largest number of genes affected by miRNA
    variation
    • Distinct clustering of cancers observed for the molecular drivers of
    some genes
    18

    View Slide

  19. 19
    p53-DNA repair pathway:
    • Major oncogenic pathway, responsible for
    maintaining fidelity of DNA replication/cell
    division
    • BRCA1 and BRCA2 have large variance
    components for TF expression in {LGG,
    SARC, LUAD, SKCM}

    View Slide

  20. 20
    LGG SKCM
    Weighted sPC TF loadings (BRCA2)
    • Similar TF programs for BRCA2 in these two cancers, with some unique differences

    View Slide

  21. 21
    Pan-cancer trends: MYC expression

    View Slide

  22. Efficiently exploring results
    • Interactive web-based R/Shiny Application called Exploring Drivers of Gene Expression (EDGE) in TCGA:
    http://ls-shiny-prod.uwm.edu/edge_in_tcga/
    • Exploratory results can be queried and visualized by gene and cancer site (among other fun stuff)
    22

    View Slide

  23. PTPN14 locus background
    • Non-receptor protein tyrosine phosphatase that regulates many breast cancer pathways
    ◦ Positive regulator of Her2
    ◦ Positive regulator of TGFB
    ◦ Negative regulator of HIPPO pathway (e.g., YAP)
    • Implicated in breast cancer growth and metastasis (suggest tumor suppressor role, but might
    also have some oncogenic functions).
    • A PTPN14 polymorphism is implicated with ER+ breast cancer risk in AA
    • However, somatic mutations or copy number variants of PTPN14 do not appear to be prevalent
    in breast cancer
    • The transcriptional regulators of PTPN14 appear to be unknown
    23

    View Slide

  24. Suggestive data from ENCODE
    → Largest variance components for PTPN14 in EDGE-in-TCGA app are CNAs and TFs
    24
    ENCODE CHIP-seq analysis of PTPN14 in T47D cells
    ChIP-seq data from ENCODE (breast cancer cell line T47D) suggest that FOXA1
    and GATA3 bind to the PTPN14 promoter

    View Slide

  25. PTPN14 TF results from EDGE in TCGA app
    25

    View Slide

  26. PTPN14 promoter assay validation
    • Flister lab (MCW) performed promoter
    reporter construct on GATA3 and FOXA1 for
    PTPN14 in breast cancer cell lines
    • Expression of GATA3 and FOXA1 down-
    regulated PTPN14
    • Next step → investigate how GATA3 and
    FOXA1 influence breast cancer outcomes…
    26

    View Slide

  27. Wrapping up and future work
    • Layering on information from NHGRI-EBI GWAS catalogue and GTEx consortium
    • Expanding analyses to data beyond TCGA (e.g., BRIDGES EU Study)
    • Potential extensions to incorporate pertinent clinical information (e.g., disease
    progression-free survival)
    27

    View Slide

  28. Acknowledgements
    Paul L. Auer Hallgeir Rui Michael Flister
    • Anthony San Lucas (MD Anderson)
    • Paul Scheet (MD Anderson)
    28

    View Slide

  29. Appendix
    SOME SCREENSHOTS OF EDGE-IN-TCGA SHINY APP (JUST IN CASE!)
    29

    View Slide

  30. 30

    View Slide

  31. 31

    View Slide

  32. 32

    View Slide

  33. 33

    View Slide

  34. 34

    View Slide

  35. 35

    View Slide