Upgrade to Pro — share decks privately, control downloads, hide ads and more …

Maps, Lies and Storytelling | P01| Introduction

Andrew W Hill
September 02, 2014

Maps, Lies and Storytelling | P01| Introduction

Introduction to the class. Personal introduction. Structure of assignments. Etcetera

Andrew W Hill

September 02, 2014
Tweet

More Decks by Andrew W Hill

Other Decks in Technology

Transcript

  1. Class 1 - What is a Map? Maps, Lies &

    Storytelling @AndrewXhill Fall - 2014
  2. To do that, we will each focus on a single

    **research topic** through the semester
  3. The lie of accessibility e.g. how do flat-maps and navigational

    maps hide the fact that the world is 3D? how does this affect people with mobility issues?
  4. The lie of environment how is environment portrayed in maps?

    what thematic methods are used by the NPS and Google? What is wild versus a garden and how have maps treated them?
  5. The lie of census How do numbers portray our population?

    what does it miss from reality? how can we bridge this gap better?
  6. The lie of color what tricks can you play with

    color on a map? What happens to people’s perception of data you are mapping? can you flip their beliefs only by color?
  7. The lie of weather maps often don’t change based on

    the weather. can we explore what would happen if they did? how does our perception of the world change based on the rain?
  8. The lie of time nothing is static. what has changed

    and how do we show it? what happens when we can draw maps out over time? what happens to things erased by time?
  9. The lie of location where am it? what is the

    best way to get home? where is my friend? where is a restaurant? what lies can and will be told based on your location?
  10. The lie of language it is easy to think your

    world exists in your language. what happens to maps when languages change? how can you make maps that are immune to the language of the viewer?
  11. A link, video, or image gallery ! At least one

    paragraph describing your map and what it tells us **lies & stories** For every map you should submit
  12. by the end of the semester, each of you should

    have a gallery of epic maps to share
  13. be comfortable ! mixing multimedia into your maps, hiding your

    map or making it non-visual, getting out in the streets and interview people, or to draw intersections, or to measure steps and collect new data
  14. m. keller a. moser j. roberts @auremoser | ushahidi @mhkeller

    | al jazeera @fantasticmaps | fantasticmaps.com
  15. WITH  hgrid              AS  (SELECT

     Cdb_rectanglegrid(Cdb_xyz_extent(8,  12,  5),                                    Cdb_xyz_resolution(5)  *  4,                                                          Cdb_xyz_resolution(5)  *  4)  AS  cell)     SELECT  x,                  y,                  Array_agg(c)  vals,                  Array_agg(d)  dates     FROM      (SELECT  St_xmax(hgrid.cell)                                                                                        x,                                  St_ymax(hgrid.cell)                                                                                        y,                                  Count(i.cartodb_id)                                                                                        c,                                  Floor((  Date_part('epoch',  built)  -­‐  -­‐10418716800  )  /  32837875)  d                    FROM      hgrid,                                  us_po_offices  i                    WHERE    St_intersects(i.the_geom_webmercator,  hgrid.cell)                    GROUP    BY  hgrid.cell,                                        Floor((  Date_part('epoch',  built)  -­‐  -­‐10418716800  )  /  32837875)                  )  f     GROUP    BY  x,                        y
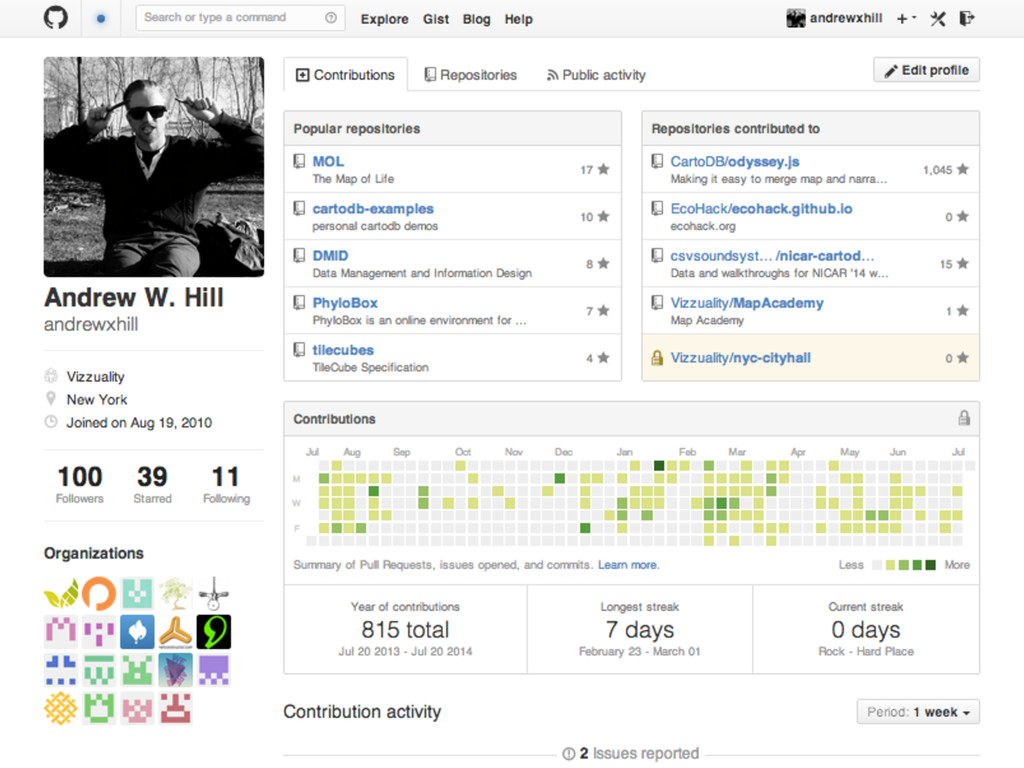
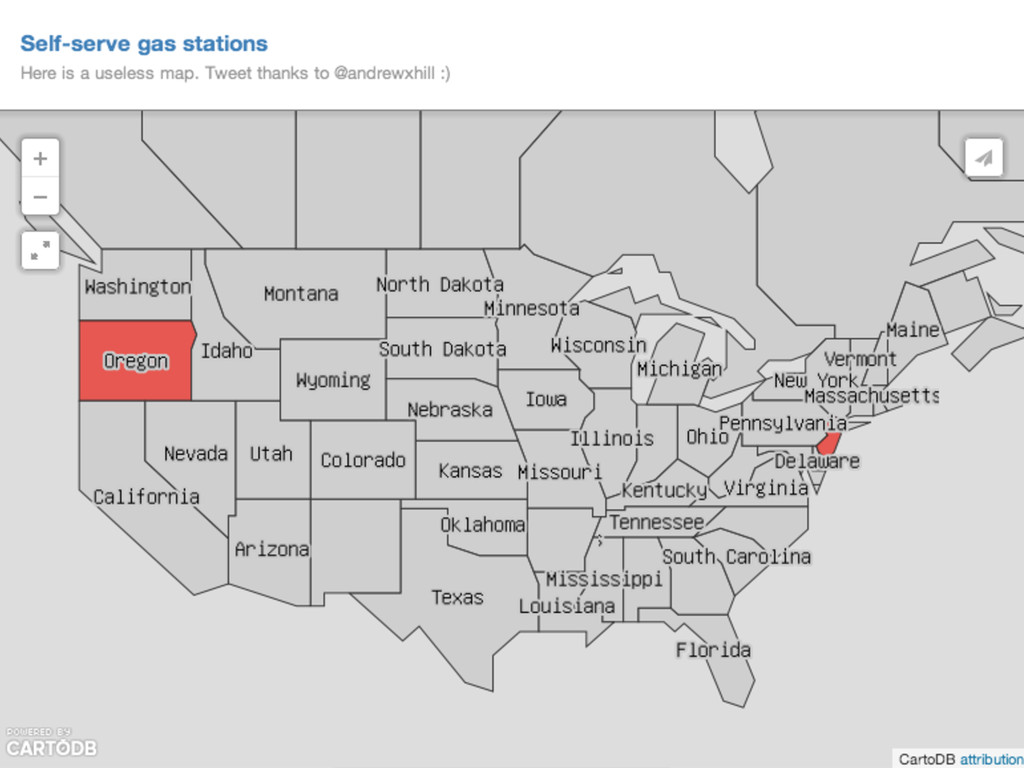