Upgrade to Pro — share decks privately, control downloads, hide ads and more …

Classifying train and car journeys using telematics data

Classifying train and car journeys using telematics data

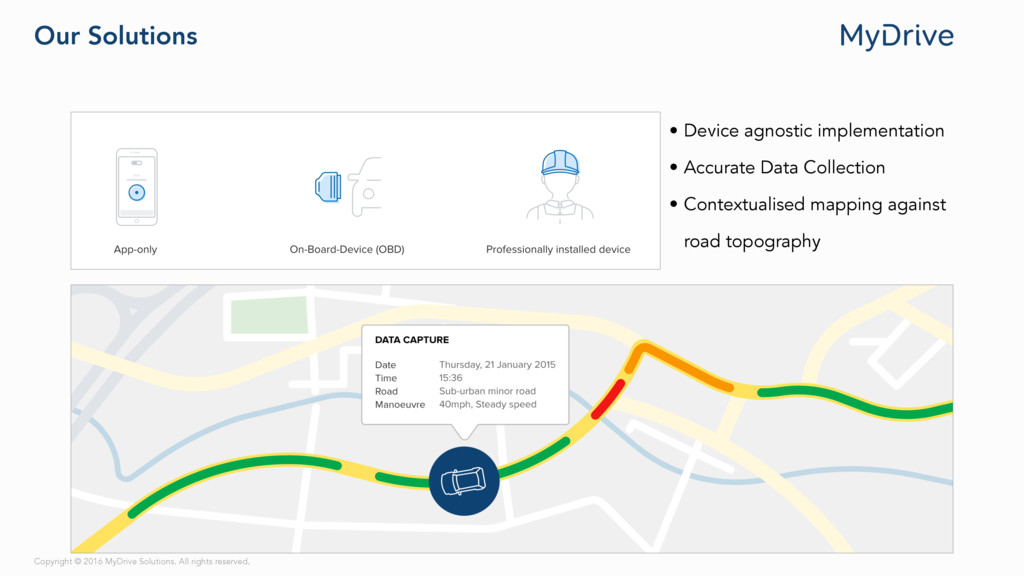
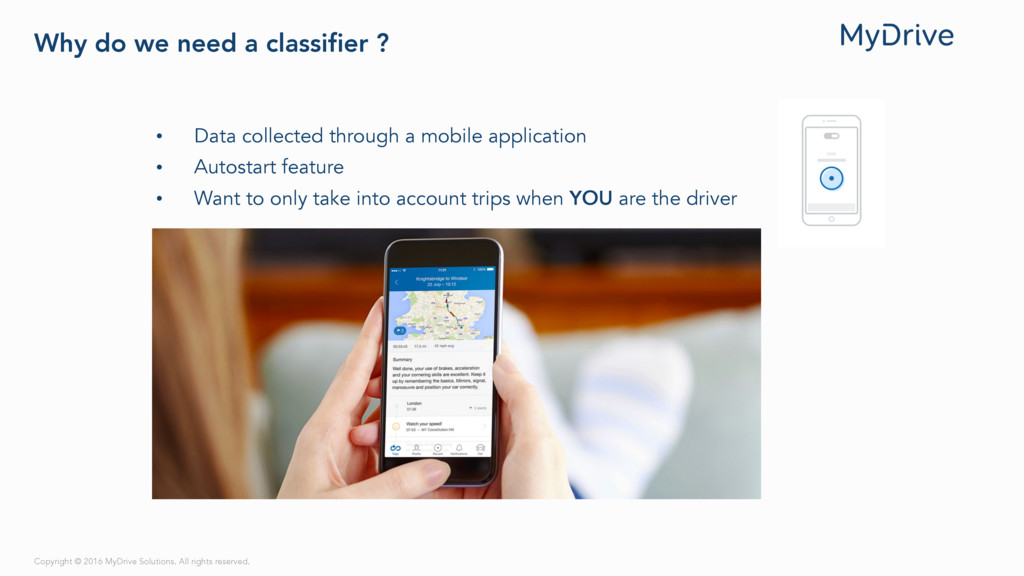
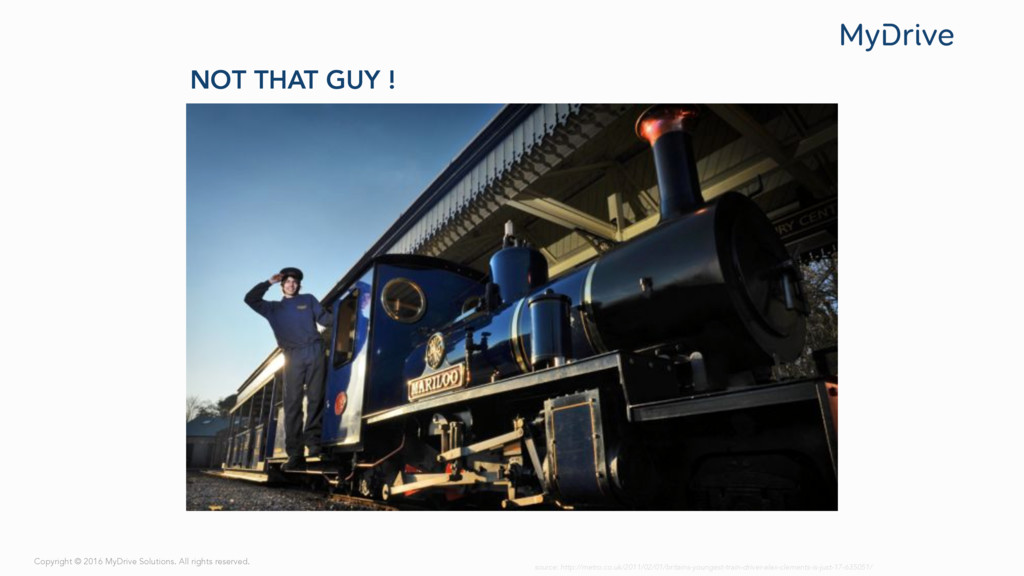
As insurers are moving away from traditional demographics factors to price car insurance products, telematics is becoming an increasingly popular solution to assess individual driver risk, optimise motor insurance premiums and encourage safer driving habits. As MyDrive Solutions is using a mobile application as an option to capture data, it is crucial for the company to be able to distinguish between train and car journeys to ensure that policy holders' driving behaviours are assessed fairly.

In this talk we will go through a methodology to classify train and car journeys, reviewing the various tools used to accomplish each task and highlighting the challenges encountered.

Annabelle Rolland

May 09, 2016
Tweet

More Decks by Annabelle Rolland

Other Decks in Technology

Transcript

  1. Copyright © 2016 MyDrive Solutions. All rights reserved. About Me

    • Applied mathematics and statistics background • First experience in Finance (Asset Management) • “Escaped the City” late 2013 • Joined Hailo’s data team at the beginning of 2014 • Joined MyDrive Solutions in February 2016
  2. Copyright © 2016 MyDrive Solutions. All rights reserved. The Data

    Team Maša Avakumović Data Scientist Copyright © 2016 MyDrive Solutions. All rights reserved.
  3. Who are MyDrive Solutions? MyDrive Solutions is a London based

    company founded in 2010 Acquired last summer by Generali, a leading insurance company serving 65 million customers in more than 60 countries We have two core pillars: data science and software engineering We are deploying robust data science to the challenges faced by insurance companies Our prime competence currently is in the driving domain We also are working on applying our technology to smart homes, e-health… Copyright © 2016 MyDrive Solutions. All rights reserved.
  4. Our Solutions Copyright © 2016 MyDrive Solutions. All rights reserved.

    • Device agnostic implementation • Accurate Data Collection • Contextualised mapping against road topography
  5. Our Solutions Copyright © 2016 MyDrive Solutions. All rights reserved.

    Drivers behavioural scoring Educational driving feedback: Top road safety tips to help improve driving habits
  6. Copyright © 2016 MyDrive Solutions. All rights reserved. Why do

    we need a classifier ? • Data collected through a mobile application • Autostart feature • Want to only take into account trips when YOU are the driver
  7. Copyright © 2016 MyDrive Solutions. All rights reserved. NOT THAT

    GUY ! source: http://metro.co.uk/2011/02/01/britains-youngest-train-driver-alex-clements-is-just-17-635051/
  8. Copyright © 2016 MyDrive Solutions. All rights reserved. MyDrive -

    Trips Data Highly precise 1 second GPS data For each point: • TripId • Latitude • Longitude • Timestamp • Speed • Satellites
  9. Copyright © 2016 MyDrive Solutions. All rights reserved. HERE -

    Stations Data HERE provides data for Train Stations and Commuter Rail Stations Columns: • Station Name • Station Type • Latitude • Longitude
  10. Copyright © 2016 MyDrive Solutions. All rights reserved. Tools •

    Qgis (2.14.0-Essen) • R (3.2.3) • RStudio • caret, ggplot2, leaflet, geosphere • Spark (1.6.1) • Zeppelin Notebook • PySpark, SQL, MLlib
  11. Copyright © 2016 MyDrive Solutions. All rights reserved. % Points

    Snapped to Roads Median: • Car: 57% • Train: 15%
  12. Copyright © 2016 MyDrive Solutions. All rights reserved. Other variables

    Other variables considered: • Breaking • Acceleration • Distance to link… Top Variables: • % Points Snapped to Roads • Train Stations per Trip • Path Efficiency
  13. Copyright © 2016 MyDrive Solutions. All rights reserved. Building and

    testing the model cv_opts <- trainControl(method="cv", number=10, summaryFunction = twoClassSummary, classProbs = TRUE) my_model <- train(train_flag ~ distinct_stations + pct_kept + path_efficiency, data=model_data_training, method="glm", family="binomial", trControl=cv_opts, metric = "ROC") Accuracy: 86% Logistic Regression Reference Prediction car train car 50% 4% train 11% 36%
  14. Copyright © 2016 MyDrive Solutions. All rights reserved. Building and

    testing the model rf_opts = data.frame(.mtry=c(1:3)) my_model2 <- train(train_flag ~ distinct_stations + pct_kept + path_efficiency, data=model_data_training, method=“rf”, tuneGrid=rf_opts, n.tree=100, trControl=cv_opts, metric = "ROC") Accuracy: 98% Reference Prediction car train car 59% 0% train 2% 39% Random Forests